The key is whether it can rise above 2706.15-2879.90
Hello, traders.
If you "Follow", you can always get new information quickly.
Please also click "Boost".
Have a nice day today.
-------------------------------------
(ETHUSDT 1M chart)
As it falls below 2706.15, the possibility of a downward trend is increasing.
Accordingly, the key is whether it can receive support near 2513.01-2706.15 and rise above the MS-Signal (M-Signal on the 1M chart) indicator.
-
(1D chart)
Therefore, the key is whether it can be supported around 2316.10-2513.01 and rise above 2706.15-2879.90.
The next volatility period is around February 16, which is the same as the volatility period of BTC.
-
Thank you for reading to the end.
I hope you have a successful trade.
--------------------------------------------------
- Big picture
I used TradingView's INDEX chart to check the entire range of BTC.
(BTCUSD 12M chart)
Looking at the big picture, it seems to have been maintaining an upward trend following a pattern since 2015.
In other words, it is a pattern that maintains a 3-year bull market and faces a 1-year bear market.
Accordingly, the upward trend is expected to continue until 2025.
-
(LOG chart)
As you can see from the LOG chart, the upward trend is decreasing.
Accordingly, the 46K-48K range is expected to be a very important support and resistance range from a long-term perspective.
Therefore, we do not expect to see prices below 44K-48K in the future.
-
The Fibonacci ratio on the left is the Fibonacci ratio of the upward trend that started in 2015.
In other words, it is the Fibonacci ratio of the first wave of the upward wave.
The Fibonacci ratio on the right is the Fibonacci ratio of the upward trend that started in 2019.
Therefore, it is expected that this Fibonacci ratio will be used until 2026.
-
No matter what anyone says, the chart has already been created and is already moving.
It is up to you to decide how to view and respond to this.
When the ATH is updated, there are no support and resistance points, so the Fibonacci ratio can be used appropriately.
However, although the Fibonacci ratio is useful for chart analysis, it is ambiguous when used as support and resistance.
This is because the user must directly select the important selection points required to create Fibonacci.
Therefore, since it is expressed differently depending on how the user specifies the selection points, it can be useful for chart analysis, but it can be seen as ambiguous when used for trading strategies.
1st : 44234.54
2nd : 61383.23
3rd : 89126.41
101875.70-106275.10 (Overshooting)
4th : 134018.28
151166.97-157451.83 (Overshooting)
5th : 178910.15
-----------------
Community ideas

GBPAUD - Short after filling the imbalance !!Hello traders!
‼️ This is my perspective on GBPAUD.
Technical analysis: Here we are in a bearish market structure from 4H timeframe perspective, so I look for a short. My point of interest is imbalance filled + rejection from bearish OB and level 1.99000.
Like, comment and subscribe to be in touch with my content!

SOLUSDT (4H Chart) Technical AnalysisSOLUSDT (4H Chart) Technical Analysis
1. Market Trend & Structure
The overall trend is bearish, as price remains below EMA 50, 100, and 200.
A descending channel pattern is forming, with lower highs and lower lows.
The red cloud zone represents strong selling pressure.
Price has tested a key support zone (~175-183 USDT) and is showing signs of a potential reversal.
2. Key Support & Resistance Levels
Support Zones:
183.44 - 192.62 USDT (potential demand zone).
175.08 USDT (entry zone for long positions).
Resistance Zones:
218.48 USDT (short-term resistance, supply zone).
221.20 USDT (Fib 38.2% retracement).
235.45 USDT (Fib 50%, mid-term resistance).
243.77 USDT (major resistance, supply zone).
269.98 - 295.82 USDT (long-term upside targets if a bullish breakout occurs).
3. Indicators & Market Sentiment
✅ Stochastic RSI: Oversold, indicating a possible bounce.
✅ MACD Histogram: Negative but reducing, suggesting weakening bearish momentum.
✅ EMA Structure: EMA 50 acting as resistance; a break above it could lead to further upside.
4. Trading Plan
Bullish Scenario (Long Position Plan)
✅ Entry: 183 - 192 USDT (demand zone).
✅ Targets:
218.48 USDT (first TP).
221.20 - 235.45 USDT (key levels).
243.77 USDT (supply zone).
✅ Stop Loss: Below 175 USDT (to avoid further downside risk).
Bearish Scenario (Short Position Plan)
✅ Entry: If price reaches 218 - 221 USDT and gets rejected.
✅ Targets: 200 - 192 USDT (support zone).
✅ Stop Loss: Above 225 USDT to prevent getting stopped by a breakout.
5. Risk Management & Considerations
Win rate: 73%, with a WL ratio of 2.72, indicating good trade probability.
If price fails to hold 183 USDT, further downside to 175 USDT is likely.
A break above 221 USDT could indicate trend reversal toward bullish.
Conclusion
SOLUSDT is testing a key support zone (183-192 USDT), with a possible reversal setup.
If price breaks above 218-221 USDT, a bullish rally to 243-269 USDT is possible.
If rejected at resistance, another drop to 183-175 USDT could occur.
📌 Trading Tip: Wait for confirmation signals before entering trades and use strict stop-loss strategies. 🚀

TLSA takes a breather, a deep oneTrend Barrier is broken.
Close below the Weekly Center-Line.
There's mostly a reaction to such events, so I expect a slight weekly pullback to the upside before a complete break to the PTG1.
PTG2 could be the continuation profit target mid term.
Rule #1: Protect You Soldiers


Beyond BTC - Why Coinbase (COIN) is a Long-Term Buy?As a trader, I'm always watching the markets, but building long-term wealth is also key. That's why I'm digging into assets like Coinbase (COIN) . While my day job is trading, Coinbase has definitely caught my eye as something portfolio-worthy for the long haul. We might have missed the IPO buzz back in 2021, but looking at where Coinbase is headed, I think we're still early in a massive growth story.
Don't let short-term crypto ups and downs distract you. Coinbase is playing a long game, and here's why it's a smart long-term investment -
CEO Brian Armstrong's Big Vision (and Big Numbers):
Already a Financial Giant: Think of Coinbase as a bank or brokerage – it's already HUGE. It's as big as the 21st largest US bank by assets ($0.42 trillion!) or the 8th largest brokerage. This size matters.
Going Global: Coinbase isn't just focused on the US. They're expanding worldwide to grab new users and markets.
Becoming Your All-in-One Financial Hub: Forget old-school banks. Coinbase wants to be your single crypto-powered financial account for everything – payments, investing, and more. This is where finance is heading.
Token Powerhouse: Crypto is about more than just Bitcoin. Coinbase wants to list every token, becoming the go-to place for the entire crypto universe.
Blending Crypto Worlds: Coinbase is smart – they're linking up with new decentralized crypto systems (DeFi) to give you the best of both worlds, easy to use but with more options.
Working with Regulators: Coinbase is playing it smart, working with governments to make crypto safe and trusted for everyone long-term.
Massive Crypto Payments: People are using crypto to pay – big time. $30 TRILLION in stablecoin payments happened last year alone. Coinbase is ready to cash in on this payment revolution.
Why This Matters for Long-Term Investors:
Crypto is Exploding: Everyone knows crypto is going to get bigger. Coinbase is in the perfect spot to ride this massive wave.
Big Money is Coming: Big institutions like banks are starting to invest in crypto. Coinbase is built for them – safe, secure, and ready for big players.
Coinbase is the Brand You Trust: Coinbase is the big name in crypto. People know and trust them, which is gold in a new market.
Bottom Line: Coinbase isn't just a trend; it's building the future of finance. Yes, crypto is bumpy, but for the long haul, Coinbase is positioned to be a winner.
Now let's get technical and have a look at what the charts are saying -
Uptrend is Clear: Forget short-term noise – this chart shows Coinbase has been on a solid climb since late 2023. There's a strong bullish structural break which indicates the trend has shifted up after a short bearish run.
$350 is the Line in the Sand: Think of $350 as the ceiling right now. The price hit it, and we saw some selling. Gotta break above $350 to really see the bulls charging again.
$225-$250 is the Safety Net: On the flip side, $225-$250 is like solid ground. As long as we stay above that, the bull run is still in play.
Just Taking a Breather: Right now, the chart says "consolidation." Think of it as Coinbase catching its breath after a big run. This pause can be a good thing – building up energy for the next push up.
RSI is Neutral for Now: The RSI thing is the 50% level. Not screaming "buy" or "sell," just saying "wait and see." After showing us bearish divergence we are likely to see oversold conditions within the current range - if that does happen it would be a good time to strike.
What to Watch For (Trader Style):
Breakout Above $350 = Green Light: If COIN blasts through $350 with some volume, that's the signal to jump in long. Think higher targets.
Stuck Between $250 and $350 = Range Trade Time: If it stays in this range, you can play the range – buy low, sell high within the range. But be ready for a break either way.
Drop Below $250 = Caution Flag: If we crack below $250, that's a warning sign. Might be time to get a bit more defensive.
Final Notes:
Coinbase looks good long-term, but we're in a "show me" moment right now. Watch those key levels – $350 and $250. Patience is key, but the chart is set up for a potential bullish move if we get the right trigger. If you're looking to invest for the long-haul, now would be a good time to add some shares to your portfolio.
Important Disclaimer:
Please remember, I am not a financial advisor. My analysis here is based on my personal research and is intended for informational and educational purposes only. Before making any investment decisions, it is essential to consult with a qualified financial professional who can provide advice tailored to your individual circumstances.
Investing in financial markets, especially in assets like cryptocurrencies and related stocks, carries significant risk. There are no guaranteed returns, and it's crucial to understand that investing is not gambling. Strategic investing involves thorough research, careful timing, and a clear understanding of your own risk tolerance and investment amounts. Always conduct your own independent research and due diligence before investing in any asset.
NASDAQ:COIN COINBASE:CBETHUSD COINBASE:CBETHETH COINBASE:CBETHUSDC OANDA:NAS100USD

BTCUSDT Reject and move Bearish trendGo the this analysis use trade wisely bearish trend for BTC/USDT, expecting the price to reject from the current level of 96K and possibly drop toward the support zone around 94K to 90K. This type of analysis could be based on various factors such as price action, resistance levels, or technical indicators.
If the price fails to break above
98K
, your expectation of a pullback towards the lower support levels might be a reasonable scenario. Keep an eye on how the market responds to those levels and any significant events or news that could impact the price movement.
You see more details in the chart.
PS Support with like and comments for more insights.

Google trading planHi traders what is your opinion on Google?as you can see it creates bearish flag for the second time the first one fails,are you expecting the second one to fails too or breakdown or continuation of the trend,this is very tricky ok, but simple to follow,weekly candlestick close lower as you can see let's findout whats next,I won't mind talking some buys from this trendline support followed by tight stop looses,yes it can breakdown and that will give alot of people's chances to take a long buy,however it's not going to easy one,as we have to make tough decisions from the current zones meaning it can bounce bek from current price or fall,that will be more than 10% if it continues to fall soo you can also expect some pull back after this drop for earning report,soo its up to you this is my trading plan.

HelenP. I Gold on Track to $2910: Uptrend ContinuesHi folks today I'm prepared for you Gold analytics. Not too long ago, the price broke through Support 2, which aligned with a support zone, and dropped down to the trend line. Following this move, the price began climbing along the trend line, but later it broke below it and fell further. Afterward, Gold rebounded to Support 2, broke it again, reached the trend line, and continued to rise from there. For a considerable period, the price was rising just below the trend line. However, after some time, Gold partially broke above this line but then resumed moving upward while staying below it. Eventually, the price broke through Support 1, which also coincided with a support zone, made a retest, and rebounded, finally managing to break through the trend line. From there, the price rallied from the trend line up to 2880 points, made a correction back to the trend line, and recently resumed its upward movement. In my view, XAU/USD may correct back to the trend line before continuing its ascent. With this in mind, my target is set at 2910 points. If you like my analytics you may support me with your like/comment ❤️

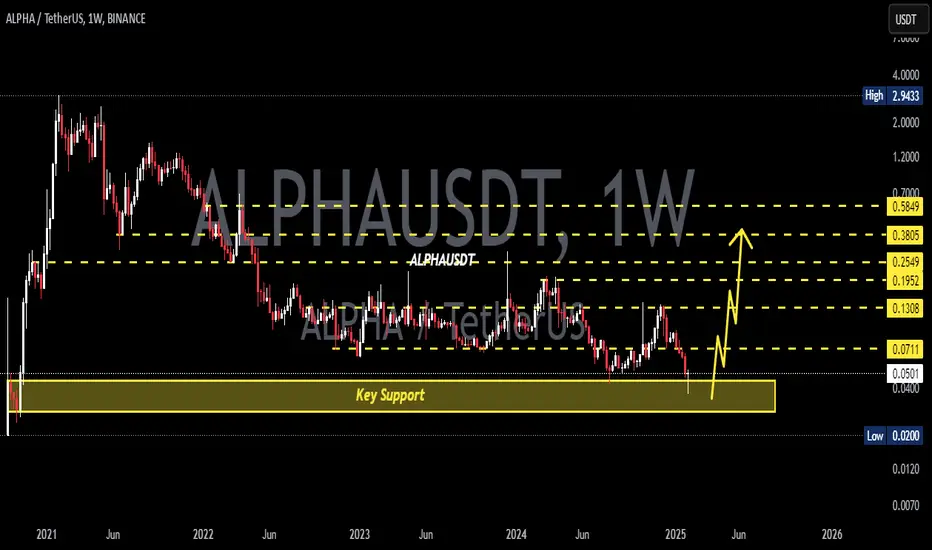
ALPHAUSDT 1WALPHA ~ 1W Analysis
#ALPHA If you still have a Conviction on this Coin, Maybe you can consider this support to start buying again, a minimum target of 20%+
XAU/USD 15M CHARTXAU/USD M15 CHART IDEA:
Why I will take a trade:
1) Resistance Zone - 84, 86
2) Supply Zone - Bearish CHoCH
3) FVG - Fair Value Gap in M5 TF
4) -OB - Bearish Order Block
5) Gann Box - Gann Box At Premium Zone
Fave fun With IDEA.

Bullish bounce off 61.8% Fibonacci support?S&P500 is falling towards the support level which is a pullback support that aligns with the 61.8% Fibonacci retracement and could bounce from this level to our take profit.
Entry: 5,989.66
Why we like it:
There is a pullback support level that aligns with the 61.8% Fibonacci retracement.
Stop loss: 5,932.99
Why we like it:
There is a pullback support level.
Take profit: 6,072.50
Why we like it:
There is a pullback resistance level.
Enjoying your TradingView experience? Review us!
Please be advised that the information presented on TradingView is provided to Vantage (‘Vantage Global Limited’, ‘we’) by a third-party provider (‘Everest Fortune Group’). Please be reminded that you are solely responsible for the trading decisions on your account. There is a very high degree of risk involved in trading. Any information and/or content is intended entirely for research, educational and informational purposes only and does not constitute investment or consultation advice or investment strategy. The information is not tailored to the investment needs of any specific person and therefore does not involve a consideration of any of the investment objectives, financial situation or needs of any viewer that may receive it. Kindly also note that past performance is not a reliable indicator of future results. Actual results may differ materially from those anticipated in forward-looking or past performance statements. We assume no liability as to the accuracy or completeness of any of the information and/or content provided herein and the Company cannot be held responsible for any omission, mistake nor for any loss or damage including without limitation to any loss of profit which may arise from reliance on any information supplied by Everest Fortune Group.

Solana in Weekly chart No one can confidently prospect the end of a correction but we can expect its existence. After a long time rally it make sense to see an appreciable correction of SOL. What I am seeing in this chart is the weakness of trend and we should wait to see what pattern it makes for wave II. There are 2 scenarios for wave 5 Primary.
In scenario 1, wave 5 Primary was finished in Jan 13 and we are in the wave a of II
or
We will see am ending diagonal that takes longer time which is not as possible as scenario one.
I expect a considerable correction for wave II, at least down to the level of wave 4 Primary or even down to wave (4) intermediate.
Thanks

TradeCityPro | APTUSDT Reaching the Bottom of the Range👋 Welcome to the TradeCityPro channel!
Let’s analyze APT, the so-called "Solana Killer", which was expected to replace Solana but is now hugging its support level.
🌐 Overview Bitcoin
Before diving into APT, let's first check Bitcoin’s 1-hour timeframe. Currently, BTC is sitting on a strong support trigger, making it a good zone for potential positions. Setting alerts in this area is logical and necessary these days.
If $95,747 breaks, I will personally look for a short position, provided there is an increase in volume, as it could lead to a test of the $92,701 support. If, at the same time, Bitcoin dominance is rising, I would also short an altcoin like Ethereum, which is relatively weaker against BTC.
🕵️♂️ Previous Analysis
Earlier this year, we publicly shared a bearish scenario for APT. Once $7.51 broke, a sharp decline followed, and now there is a possibility of moving toward $4.89.
📊 Weekly Timeframe
APT remains inside its large, volatile range, frequently bouncing between its highs and lows. However, this time, it has formed a lower high, which is not a positive sign.
Additionally, after breaking $7.78, sellers completely engulfed the weekly candle, and for the past five weeks, all candles have been red with high selling volume, confirming the downtrend.
There is no buy trigger at the moment, and I cannot recommend a buying opportunity until the market forms a new structure.
For selling, if APT drops below $4.97, it makes sense to exit and accept the loss instead of holding onto a losing position.
📈 Daily Timeframe
On the daily timeframe, APT failed to break the $14.61 resistance. Even worse, it couldn't even reach the previous high before getting rejected earlier, signaling weakness.
After breaking below $8.46, the market entered an MWC (Market Weakness Confirmation) downtrend.
Following the breakdown, a pullback retest occurred, and the daily candle engulfed the previous two days' candles, leading to further decline. Currently, APT is at $5.70, with RSI in the oversold zone, suggesting a possible short-term slowdown in selling pressure.
I personally feel that APT’s drop is sufficient for now, and we might enter a range here before a final move toward the $4.95 support. However, this does not mean it’s a buy signal. We need to wait for a new market structure before considering spot entries.
📝 Final Thoughts
Stay calm, trade wisely, and let's capture the market's best opportunities!
This analysis reflects our opinions and is not financial advice.
Share your thoughts in the comments, and don’t forget to share this analysis with your friends! ❤️

BTC is going 88kI JUST FEEL IT, the BTC market is just creating a AMD AND because if it wanted to go down it would all ready so its going to fake it by accumulating right now and later going up marking everything think is going up and then killing everyone down jajajaja

Bearish drop off pullback resistance?GBP/JPY is rising towards the pivot which acts as a pullback resistance and could drop to the 1st support.
Pivot: 189.58
1st Support: 183.14
1st Resistance: 194.56
Risk Warning:
Trading Forex and CFDs carries a high level of risk to your capital and you should only trade with money you can afford to lose. Trading Forex and CFDs may not be suitable for all investors, so please ensure that you fully understand the risks involved and seek independent advice if necessary.
Disclaimer:
The above opinions given constitute general market commentary, and do not constitute the opinion or advice of IC Markets or any form of personal or investment advice.
Any opinions, news, research, analyses, prices, other information, or links to third-party sites contained on this website are provided on an "as-is" basis, are intended only to be informative, is not an advice nor a recommendation, nor research, or a record of our trading prices, or an offer of, or solicitation for a transaction in any financial instrument and thus should not be treated as such. The information provided does not involve any specific investment objectives, financial situation and needs of any specific person who may receive it. Please be aware, that past performance is not a reliable indicator of future performance and/or results. Past Performance or Forward-looking scenarios based upon the reasonable beliefs of the third-party provider are not a guarantee of future performance. Actual results may differ materially from those anticipated in forward-looking or past performance statements. IC Markets makes no representation or warranty and assumes no liability as to the accuracy or completeness of the information provided, nor any loss arising from any investment based on a recommendation, forecast or any information supplied by any third-party.

Start shorting gold before the marketGood morning, dear traders! A new trading week has begun!
Last week, I consistently emphasized in my trading strategy that gold still had the potential to rally towards 2900. Since the market opened today, gold has accelerated its upward move, approaching 2900, which suggests a short squeeze from a technical perspective. Additionally, in my trading outlook shared on Friday, I specifically pointed out that as gold approaches or tests the 2900 level, we must remain cautious of a potential pullback. If gold fails to decisively break through the 2895-2905 resistance zone, a short-term retracement to the 2880 zone, or even the 2860 level is possible.
In the short term, I will continue to look for short opportunities within the 2895-2905 range, anticipating that gold will pull back as expected, setting us up for a strong start to the trading week!
Bros, do you have the courage to try shorting gold with me? If you want to learn more detailed trading ideas and get more trading signals, you can choose to join the channel at the bottom of the article to make trading no longer difficult and make making money a pleasure!

Bitcoin ..Down side 88000...My Bitcoin analysis with a sell position targeting specific price levels. Here's a breakdown of your analysis:
- *Current Position*: Sell
- *Entry Point*: 96,000 (assuming this is in USD or another fiat currency)
- *1st Target*: 92,000
- *2nd Target*: 88,000
This suggests you anticipate a downward movement in Bitcoin's price, with two potential profit-taking levels. Here are a few considerations for your analysis:
1. *Technical Indicators*: Are you using any specific indicators (e.g., RSI, MACD, moving averages) to support your sell position? These can help validate your bearish outlook.
2. *Support and Resistance Levels*: Ensure that your targets align with key support levels. If 92,000 and 88,000 are significant support zones, they could act as areas where price might reverse or consolidate.
3. *Risk Management*: Always define your stop-loss level to manage risk. For example, if Bitcoin moves above 96,000, where will you exit the trade to limit losses?
4. *Market Context*: Consider broader market conditions, such as news, macroeconomic factors, or Bitcoin's overall trend (bullish or bearish). These can influence price movements.
5. *Timeframe*: Specify the timeframe for your analysis (e.g., hourly, daily, weekly). Short-term and long-term trends can differ significantly.
If you'd like, I can help refine your analysis further or provide additional insights! Let me know.

Beware of the Bitcoin crash!I JUST FEEL IT, the BTC market is just creating a AMD AND because if it wanted to go down it would all ready so its going to fake it by accumulating right now and later going up marking everything think is going up and then killing everyone down

NAS100 SELL ANALYSIS HEAD AND SHOULDER PATTERNHere Nas100 price form a head and shoulder pattern and now try to go down so if line 21329.42 price is likely to continue moving down and trader should go for short with expect profit target of 21078.03 and 20807.17 . Use money management

Euro can drop to support level, exiting from pennantHello traders, I want share with you my opinion about Euro. When analyzing the chart, it’s clear that the price initially climbed to the resistance level, which overlapped with the seller zone, but immediately bounced back and dropped to the support level. Shortly after, the Euro broke through the support level, falling below the buyer zone. However, it quickly reversed and began rising within an upward channel. Within this channel, the Euro broke the 1.0265 support level and performed a retest, consolidating near that level for a while before continuing its upward momentum. Eventually, the Euro reached the resistance level, broke through it, and moved up to the resistance line of the channel, ultimately exiting the channel. Afterward, the price formed its first gap and started declining within a pennant pattern, where it soon broke the 1.0435 resistance level. Later, the price created a strong second gap, dropped below the support level, and hit the pennant's support line. From there, the Euro began rising again, breaking the support level once more and climbing back to the resistance level. However, not long ago, the price fell back to the pennant’s support line, creating a third gap. In my view, the Euro can attempt to rise to 1.0360 before dropping back to the support level and exiting the pennant pattern. For this reason, I’ve set my take-profit target at the 1.0265 support level. Please share this idea with your friends and click Boost 🚀

XRP is about to make new ATHon daily time frame we have bullish divergence on RSI for XRP , and we have a strong support below, so in my opinion XRP is about to raise fast to $5 ish

GOLD - Price can continue to move up inside rising channelHi guys, this is my overview for XAUUSD, feel free to check it and write your feedback in comments👊
Recently price started to trades inside flat, where it at once broke $2745 level, but soon fell back to support area.
Next, price bounced up to the top part of flat and then corrected back to support area, where it some time trades.
After this, Gold exited from support area and soon exited from flat and continued to move up inside rising channel.
In channel, price corrected to support line and then in a short time rose to $2850 level and broke it.
Then price reached resistance line of channel and fell to support area, after which it continued to move up.
So, I think that Gold can make a correction and then continue to move up to $2945 resistance line of channel.
If this post is useful to you, you can support me with like/boost and advice in comments❤️
