Community ideas

DXY Will Go Down From Resistance! Short!
Here is our detailed technical review for DXY.
Time Frame: 5h
Current Trend: Bearish
Sentiment: Overbought (based on 7-period RSI)
Forecast: Bearish
The price is testing a key resistance 108.210.
Taking into consideration the current market trend & overbought RSI, chances will be high to see a bearish movement to the downside at least to 107.439 level.
P.S
Overbought describes a period of time where there has been a significant and consistent upward move in price over a period of time without much pullback.
Like and subscribe and comment my ideas if you enjoy them!

SPX/Escalating Trade Tensions: New Tariffs on Steel and AluminumEscalating Trade Tensions: New Tariffs on Steel and Aluminum
The week began with yet another significant announcement, as President Trump, during a media briefing aboard Air Force One, declared a 25% tariff on steel and aluminum imports into the United States. He further indicated that additional reciprocal tariffs could be expected on Tuesday or Wednesday.
S&P 500 Technical Analysis
The price maintains bearish momentum, having already stabilized within a bearish zone. As long as it trades below 6,051, the market will continue its downward movement toward 6,020. A 4-hour candle closing below 6,020 would confirm a further decline toward 5,970.
However, if the price stabilizes above 6,059, it may advance toward 6,085. To establish a confirmed uptrend, the price must hold above 6,103.
Key Levels:
Pivot Point: 6051
Resistance Levels: 6079, 6103, 6143
Support Levels: 6020, 5969, 5937
Trend Outlook:
Bearish scenario: While below 6051, targeting 6020 – 5,970
Bullish scenario: Confirmation above 6059, targeting 6085 – 6103

Ethereum (ETH): Good Buy As Long As We Inside Bullish ChannelEthereum is still inside the bullish channel after that bigger liquidation movement we had where the price quickly touched $2000.
As we are back in the channel, we are looking for some sort of bullish volume to build up here and then a nice upward breakout.
Currently we are at strong support (bullish channel + EMAs are holding the price).
If all plays out nice, we might be heading toward the ATHs from here, so let's see!
Swallow Team


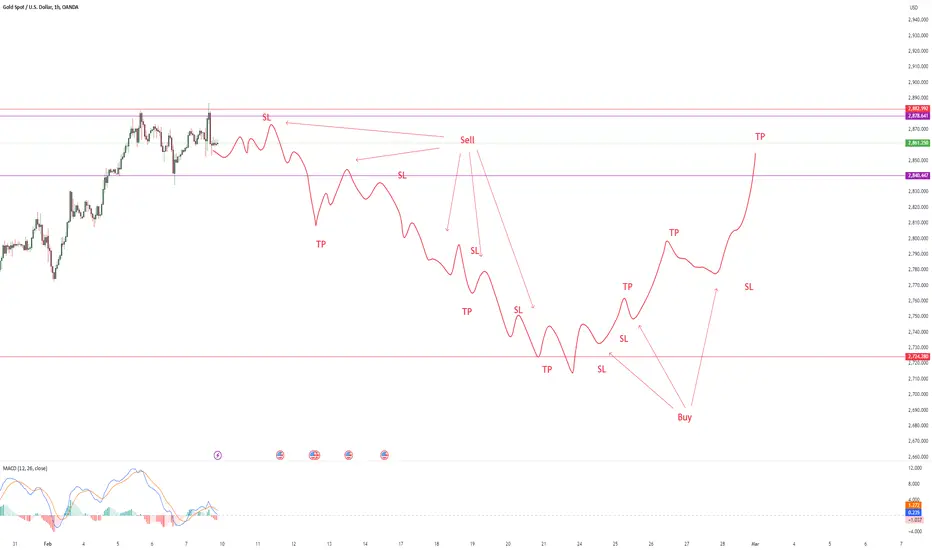
Gold - Sell and wait until it searches daily resistantGold will have potential sell and buy opportunities between daily support and resistant. Now let's wait until the revise pattern is formed at resistant level then start short. Turnaround, buy pattern will start at daily support.
Hello traders, please feel free to share your trading ideas, and please give a Boost if you agree with my trading plan. My trading strategy is Price Action, which is the simplest strategy of trading on the price movement. A key part of my discipline is Stop Loss set when opening a trading position, which ensures every trading is risk managed. My 1 to 1 trading training is available, please message. Trade well and good luck!
Bitcoin Short - Let's ManiuplateI'm overall bullish, however kinda betting on some f*ckery before we potentially move further up.

Intraday Trade: Silver SellTrend is bullish on the H4 timeframe, but there’s a possibility of a reversal on the H1 timeframe
Price is now at the fibonacci area, resistance, and trendline.
Entry: 32.2289
SL: 32.6284
TP: 31.4248
Disclamer on
Trade on your own risk
TVC:SILVER

Bitcoin Bear Market Scenario: $52.5K → $75K → $30K – Possible?Bitcoin's high volatility makes such price movements entirely plausible. Historically, the cryptocurrency has experienced sharp corrections and rebounds, as seen during the 2017 and 2021 market cycles. A drop to $52.5K could result from panic selling or bearish sentiment, potentially followed by a relief rally to $75K driven by renewed buying interest. However, broader economic pressures, such as high interest rates, regulatory uncertainty, or a risk-off environment, could lead to another steep decline to $30K.
Technical factors also support this scenario, as breaking key support and resistance levels often triggers momentum-driven price moves. Additionally, unforeseen black swan events, such as regulatory crackdowns or geopolitical crises, could amplify these shifts. While this scenario is speculative, it highlights the importance of risk management and strategic planning when trading in such volatile markets. What are your thoughts on this potential price path? Share your insights below! 🚀📉

Expanding Triangle on NuScale Power. SMRIndeed. 0.618 rally correction is followed now by a tenuous recovery. May it be E wave of triangle and technical indicators seem to brOadly support this notion. Bullish crosses in tandem on the VZO and Ehlers Stoch RSI, although the latter is a bit flat. Cross of the top end of the MIDAS envelope with positive gradient on both the US and vWAP lines. Time will tell.

possibility of uptrendThe correction at the current support levels is expected to end and we will see the start of an upward trend.

BTC/USDT will expected to Bullish direction.Go through this BTC/USDT analysis price will expected to Bullish direction.
Current price 96k if the price will rise from this zone then next will be Upward Movement to 98K If BTC breaks through resistance levels near 96K and starts to climb, 98K would likely be the first significant target. This price range might face some minor resistance, but if the momentum is strong, a break above could lead to further gains. and then next target 100K
Remember, market predictions always carry risk, so ensure you're also watching for signs of reversal or key levels where the price might pull back.
PS Support with like and comments for more insights thanks Traders.

Long - swing trade with 1H and 4H I just entered a long position mainly based on the chart set up in the 4H and 1H charts.
Daily (I always check daily)
Stochastic has reset and is moving to the upside.
4H
All 4H momentum indicators are clearly moving to the upside.
The 4H stochastic has just entered the bull zone, which gives enough time for the price to move up in the 1H chart.
4H candle closed above EMA 21.
1H
1H momentum indicators are all in the bull zone.

TSM - correction then 5th wave?I did a chart on this stock back in June 2024 that is kind of following the script. A lot of tech stocks and US equity is presenting EW counts that could suggest a decent correction could be coming soon. This count suggests that TSM has completed a 3rd wave and is now beginning a 4th wave correction.

Stay patient!You should patiently wait for US inflation data this Wednesday @ 1:30 pm ET before making your next move.
CRYPTOCAP:BTC and CRYPTOCAP:ETH have had stable weeks, whilst most altcoins have just bled continuously.
The inflation print this Wednesday will influence the Fed's next interest rate decision and, more importantly, its stance on Quantitative Tightening vs. Quantitative Easing.
If the FED ends Quantitative Tightening, this is very bullish because it suggests they will soon start Quantitative Easing.
QE will be great for altcoins as it will increase the liquidity available and bid up lower caps and also coincide with CRYPTOCAP:BTC Dominance having a blowoff top last week.
So stay patient better days may be coming!

bitcoin dreamsDon't stay in Bitcoin's short dream world, being exposed to long and massive dreams is reasonable to deal with throughout 2025!

XAUUSD 9/2/25XAU is running bullish for the sixth consecutive week. We called for a new all-time high last week and the week before. If new highs form, we will shift our attention to them, but as it stands, we are anticipating another all-time high. Gold is being driven by fundamentals as well as a strong potential for gains based on past performance.
We now look to Orion for the daily bias, and as expected, it remains bullish. Based on this, we have key lows marked on our chart, with the third being a high-volume low. From our understanding, we expect a counter-trend move to start the week before continuing with more long positions. If price reaches our lower areas, we will look for the correct entry to follow through on these moves.
Trade your plan and manage your risk. Always follow Orion.

Gold | Oil | Dollar | Silver | Natural Gas Price ForecastWeekly Commodities update:
Gold | Oil | Dollar | Silver | Natural Gas Price Forecast
Support & Resistance Analysis
Trend Analysis

NASDAQ repeating the 2021 and 2019 rallies.Nasdaq (NDX) is about to complete a Cup and Handle (C&H) pattern. The whole sequence since the August 22 2024 High appears to be very similar with the price action that preceded the 2021 and 2019 C&H patterns.
As you can see, both of those pattern had an identical trend towards them and equally rally after them, which targeted the 2.618 Fibonacci extension.
If the current C&H is completed on the 4H MA200 (orange trend-line), it is reasonable to expect to continue to repeat those past patterns. As long as the 20600 Low doesn't break, we expect a June rally to 24650 at least.
-------------------------------------------------------------------------------
** Please LIKE 👍, FOLLOW ✅, SHARE 🙌 and COMMENT ✍ if you enjoy this idea! Also share your ideas and charts in the comments section below! This is best way to keep it relevant, support us, keep the content here free and allow the idea to reach as many people as possible. **
-------------------------------------------------------------------------------
💸💸💸💸💸💸
👇 👇 👇 👇 👇 👇

This Breakout Will Trigger Massive Altseason!Hello, Skyrexians!
According to your activity we noticed that you are interested in Bitcoin and CRYPTOCAP:OTHERS.D analysis. This is not a top secret because everyone wants to know when altseason will be started. In our recent we warned you about drop for altcoins dominance below the support level and it happened next day. Now we have the potentially reversal signal, be need to wait for it's confirmation.
On the weekly chart we can count the previous massive altseason as the wave 3. Previously we considered corrective wave 4 as the triangle shaped, but now it looks like classical ABC. If this is correct, dump on dominance can continue, but the potential reversal signal has been flashed by the Bullish/Bearish Reversal Bar Indicator . This signal still has not been confirmed, but if candles will break 9% the huge rally in wave 5 is incoming - true altseason.
Best regards,
Skyrexio Team
___________________________________________________________
Please, boost this article and subscribe our page if you like analysis!

Live GOLD Daily/ Weekly Price Action AnalysisGold has been repeatedly making new all time highs again for the last week and we just did it again today! Usually when something like this happens there is a strong pullback in the market which is very common and is usually the easiest trade to catch if your patient.
There has been a lot of divergence between the highs and I can see we are almost there.
I have started scaling into gold shorts as I believe it will be lower than the price it is at right now and will be adding more if it goes up. This trade is being called live on the telegram -(tradingwithomz)
Let me know what you guys think.

Long timeICP did what it went to do, maybe something's still there to be done, who knows, but someday, someday it'll climb back to those double digits.
Carl the moon gave yesterday warning about altcoins, this might b a good signal to do the opposite,
Nah but seriously this might take some time . . . i wouldn't leverage... well maybe a 2 or 3 :D

XAUUSD WHAT NEXT ?ON XAUSD we are expecting gold to retrace 2880 area from there we can buy gold on confirmation on lower time frame
