History is repeating itself for BNB...Hello Traders 🐺,
Over the past few days, I’ve noticed that BNB is outperforming the overall market . After BTC.D consolidation , BNB started pumping , so I decided to publish an idea about it.
When I opened the chart, I saw something magical unfolding—a true piece of art, honestly!
So, as you can see in the chart, history is trying to repeat itself again . Let me explain it to you:
After the formation of a double top , the price enters a consolidation phase , or even better to say, we see a correction . This phase usually coincides with the BTC season, where we observe the formation of a rising wedge.
Then, the final phase begins when BTC.D starts dumping and the altcoin season kicks off . Right now, we are very close to breaking out of the rising wedge! 🚀
( Remember, this is not financial advice, and always do your own research )
Community ideas

EUR/GBP may rise to 0.83638 - 0.83451Preference
Long positions above 0.82926 with targets at 0.83638 and 0.83451 in extension.
Alternative
If below 0.82926 look for further downside with 0.82675 and 0.82546 as targets.

EUR/USD Under Pressure: Will the Downtrend Persist?Hello everyone! What do you think about buying or selling EUR/USD today? Let's explore this question together and gain deeper insights!
Currently, EUR/USD continues its downward trend for the third consecutive session, trading near 1.0310 during the Asian session on Monday. The pair is under pressure as investors anticipate a widening interest rate differential between the U.S. and the Eurozone.
On the 1-hour chart, the bearish trend remains intact, with prices reacting to the EMA 34 and 89, signaling further downside potential. Additionally, a previous large gap remains unfilled, while a recent smaller gap is fueling a slight corrective move within the broader downtrend. Given this setup, the most logical move for EUR/USD would be to decline, with resistance holding around the 1.0339 level.
What are your thoughts on EUR/USD’s next move?

xausd key areas to watch with detailed analysisHere's an analysis of XAU/USD at 2,861 as of February 10, 2025, incorporating technical and fundamental insights from the search results:
Current Context
Gold (XAU/USD) is trading near 2,861, a critical juncture given recent market dynamics. This level aligns with forecasts and technical patterns discussed in the search results, offering insights into potential bullish or bearish scenarios.
Key Technical Levels
Immediate Support:
2,861: Coincides with the lower bound of February 2025’s forecasted range (2,861.25–2,991.30). A hold here could signal bullish resilience.
2,746–2,695: Deeper support zones if a correction occurs, based on Fibonacci retracement levels and trendline analysis .
Resistance Levels:
2,868–2,900: The next psychological and technical hurdles, with 2,868.56 (R2) noted as a swing high target .
2,991–3,000: Upper bound of February’s projected range and a key breakout target .
Long-Term Trend:
Gold remains in an ascending channel (up ~27% since 2024), supported by geopolitical uncertainty and central bank demand .
The 100 SMA is above the 200 SMA on the 4-hour chart, indicating underlying bullish momentum .
Bullish Scenario
Triggers:
Fed Policy & Inflation: Continued dovish signals from the Fed (e.g., rate cuts) and persistent inflation could drive gold higher .
Geopolitical Risks: Escalating tensions (e.g., Middle East conflicts, U.S.-China trade policies) may boost safe-haven demand .
ETF Inflows: Positive gold ETF flows, as seen in late 2024, could reignite upward momentum 3.
Technical Outlook:
A bounce from 2,861 could target 2,900–2,991, aligning with February’s forecast .
A break above 2,991 opens the path to 3,000+, with institutions like JPMorgan forecasting $3,150 by year-end .
Bearish Risks
Triggers:
USD Strength: A stronger dollar (e.g., from robust U.S. data or hawkish Fed rhetoric) may pressure gold .
Profit-Taking: Overbought signals (RSI at 57) and resistance at 2,868 could trigger short-term pullbacks .
Reduced Safe-Haven Demand: Easing geopolitical tensions or risk-on sentiment might reduce gold’s appeal .
Technical Outlook:
A breakdown below 2,861 could test 2,746–2,695 (Fibonacci and trendline support) .
Sustained selling might invalidate the uptrend, risking a drop toward 2,625 (critical 100-day SMA).
Macro Drivers to Watch
U.S. Economic Data: Non-Farm Payrolls (NFP), CPI, and Fed rate decisions will influence USD and gold .
Geopolitical Events: Developments in Ukraine, Middle East, and U.S. trade policies under Trump .
Central Bank Activity: Continued gold purchases by central banks (e.g., China, India) may stabilize prices
Short-Term Forecast
Base Case: Consolidation near 2,861–2,900 as markets digest recent gains and await catalysts.
Upside Bias: Favored if gold holds above 2,861, targeting 2,991–3,000 .
Downside Risk: A close below 2,861 could trigger profit-taking toward 2,746
Conclusion
At 2,861, XAU/USD is at a pivotal level. While the broader trend remains bullish (supported by inflation, geopolitics, and central bank demand), short-term volatility from USD fluctuations and technical resistance could dominate. Traders should monitor 2,861 as a key support and watch for breaks above 2,900 or below 2,746 to confirm directional bias.
support and resistance for short term:
Resistance:
2872
2885
2894
2900
2911
2920
these resistance points can be used as bullish targets
Support:
2855
2851
2841
2833
2830
2819
2800
2782
these support points can act as bearish targets
LIKE BOOST AND SHARE US SUPPORT US

GOLD recovered strongly, Trump stimulated risk aversionDuring the Asian trading session on Monday (February 10), OANDA:XAUUSD Spot has recovered strongly after a short decline. Gold price has now recovered to about 2,874 USD/ounce, a sharp increase of about 15 USD during the day.
US President Donald Trump said on Sunday local time that he would announce a 25% tariff on all imported steel and aluminum on Monday.
Trump told reporters aboard Air Force One that the tariffs would apply to metal imports from every country. He did not specify when the tariffs would be applied. Trump also said he would announce corresponding tariffs later this week for countries that impose tariffs on U.S. imports.
These comments stimulated the market's risk aversion, the Asia-Pacific stock market and the US stock futures market fell, and the two safe-haven assets, the US dollar and gold, recovered together.
On the daily chart, OANDA:XAUUSD recovered after receiving support from the upper channel edge, and in terms of technical structure nothing changed from previous releases with a bullish bias dominating the technical chart.
Maintaining price activity above the 0.236% Fibonacci extension provides the conditions for continued upside with the next target being at $2,891 the 0.382% Fibonacci extension, more so than the original price point of $2,900.
With the price channel making a short-term uptrend, along with the Relative Strength Index providing no signs of a strong downside correction, gold is expected to continue searching for new all-time highs. The positions will be noted as follows.
Support: 2,869 – 2,844 – 2,834USD
Resistance: 2,891 – 2,900USD
SELL XAUUSD PRICE 2906 - 2904⚡️
↠↠ Stoploss 2910
→Take Profit 1 2899
↨
→Take Profit 2 2894
BUY XAUUSD PRICE 2829 - 2831⚡️
↠↠ Stoploss 2825
→Take Profit 1 2836
↨
→Take Profit 2 2841

Eyes on $3XRP is performing better than most altcoins, having broken its short-term downtrend. If buyers maintain control, XRP could test the $3.00 resistance, and a successful breakout might pave the way for a move toward $3.50. However, staying above key support levels will be essential for keeping the momentum going.

WORK OF ART ON BTC !there is a very nice reactions on #BTC chart and the VWAP indicator !
the price is exacly reacting to VWAP bonds and made lots of positions for us now the market owns the whole liq for a big rise so its obvious that after a small fall it will rise to the higher targets

NASDAQ SHORTConsidering Friday's PA where there was a liquidity grab,there is high resistance liquidity on the buyside. Formation of a one candle CISD further confirms that we might be bearish for a couple of days.
We will delve into the smaller timeframe (4H & 1H) to have our entry position and our targets will be at 20860 and 20670

ETH/USDT ANALYSIS As posted earlier about ETH/USDT about the 0.5Fib region being a potential LONG, it really held well and a good trade as well

NAS100 D1 | Potential bearish reversalNAS100 is rising towards a swing-high resistance and could potentially reverse off this level to drop lower.
Sell entry is at 21,759.06 which is a swing-high resistance.
Stop loss is at 22,000.00 which is a level that sits above the descending trendline and a swing-high resistance.
Take profit is at 21,194.43 which is a multi-swing-low support.
High Risk Investment Warning
Trading Forex/CFDs on margin carries a high level of risk and may not be suitable for all investors. Leverage can work against you.
Stratos Markets Limited (www.fxcm.com):
CFDs are complex instruments and come with a high risk of losing money rapidly due to leverage. 63% of retail investor accounts lose money when trading CFDs with this provider. You should consider whether you understand how CFDs work and whether you can afford to take the high risk of losing your money.
Stratos Europe Ltd (www.fxcm.com):
CFDs are complex instruments and come with a high risk of losing money rapidly due to leverage. 63% of retail investor accounts lose money when trading CFDs with this provider. You should consider whether you understand how CFDs work and whether you can afford to take the high risk of losing your money.
Stratos Trading Pty. Limited (www.fxcm.com):
Trading FX/CFDs carries significant risks. FXCM AU (AFSL 309763), please read the Financial Services Guide, Product Disclosure Statement, Target Market Determination and Terms of Business at www.fxcm.com
Stratos Global LLC (www.fxcm.com):
Losses can exceed deposits.
Please be advised that the information presented on TradingView is provided to FXCM (‘Company’, ‘we’) by a third-party provider (‘TFA Global Pte Ltd’). Please be reminded that you are solely responsible for the trading decisions on your account. There is a very high degree of risk involved in trading. Any information and/or content is intended entirely for research, educational and informational purposes only and does not constitute investment or consultation advice or investment strategy. The information is not tailored to the investment needs of any specific person and therefore does not involve a consideration of any of the investment objectives, financial situation or needs of any viewer that may receive it. Kindly also note that past performance is not a reliable indicator of future results. Actual results may differ materially from those anticipated in forward-looking or past performance statements. We assume no liability as to the accuracy or completeness of any of the information and/or content provided herein and the Company cannot be held responsible for any omission, mistake nor for any loss or damage including without limitation to any loss of profit which may arise from reliance on any information supplied by TFA Global Pte Ltd.
The speaker(s) is neither an employee, agent nor representative of FXCM and is therefore acting independently. The opinions given are their own, constitute general market commentary, and do not constitute the opinion or advice of FXCM or any form of personal or investment advice. FXCM neither endorses nor guarantees offerings of third-party speakers, nor is FXCM responsible for the content, veracity or opinions of third-party speakers, presenters or participants.

USD/CHF H1 | Bullish uptrend to continue?USD/CHF is falling towards a pullback support and could potentially bounce off this level to climb higher.
Buy entry is at 0.9102 which is a pullback support that intersects with an ascending trendline.
Stop loss is at 0.9060 which is a level that lies underneath an overlap support and the 38.2% Fibonacci retracement.
Take profit is at 0.9158 which is a pullback resistance that aligns with the 78.6% Fibonacci retracement level.
High Risk Investment Warning
Trading Forex/CFDs on margin carries a high level of risk and may not be suitable for all investors. Leverage can work against you.
Stratos Markets Limited (www.fxcm.com):
CFDs are complex instruments and come with a high risk of losing money rapidly due to leverage. 63% of retail investor accounts lose money when trading CFDs with this provider. You should consider whether you understand how CFDs work and whether you can afford to take the high risk of losing your money.
Stratos Europe Ltd (www.fxcm.com):
CFDs are complex instruments and come with a high risk of losing money rapidly due to leverage. 63% of retail investor accounts lose money when trading CFDs with this provider. You should consider whether you understand how CFDs work and whether you can afford to take the high risk of losing your money.
Stratos Trading Pty. Limited (www.fxcm.com):
Trading FX/CFDs carries significant risks. FXCM AU (AFSL 309763), please read the Financial Services Guide, Product Disclosure Statement, Target Market Determination and Terms of Business at www.fxcm.com
Stratos Global LLC (www.fxcm.com):
Losses can exceed deposits.
Please be advised that the information presented on TradingView is provided to FXCM (‘Company’, ‘we’) by a third-party provider (‘TFA Global Pte Ltd’). Please be reminded that you are solely responsible for the trading decisions on your account. There is a very high degree of risk involved in trading. Any information and/or content is intended entirely for research, educational and informational purposes only and does not constitute investment or consultation advice or investment strategy. The information is not tailored to the investment needs of any specific person and therefore does not involve a consideration of any of the investment objectives, financial situation or needs of any viewer that may receive it. Kindly also note that past performance is not a reliable indicator of future results. Actual results may differ materially from those anticipated in forward-looking or past performance statements. We assume no liability as to the accuracy or completeness of any of the information and/or content provided herein and the Company cannot be held responsible for any omission, mistake nor for any loss or damage including without limitation to any loss of profit which may arise from reliance on any information supplied by TFA Global Pte Ltd.
The speaker(s) is neither an employee, agent nor representative of FXCM and is therefore acting independently. The opinions given are their own, constitute general market commentary, and do not constitute the opinion or advice of FXCM or any form of personal or investment advice. FXCM neither endorses nor guarantees offerings of third-party speakers, nor is FXCM responsible for the content, veracity or opinions of third-party speakers, presenters or participants.

Eurusd shortI am liking this idea of short with 6 pip sl and a 57 pips take profit if it doesn’t make the move means the bull will take over and I will change my market biased

XRPxrp is ready for a drop, im not a retail trader im a institutional trader i have a doji left behind then a retest which price took out liquidity and now banks are comfprtable to start selling and targeting the previous low , the wick has a lot of liquidity so banks will go take that out

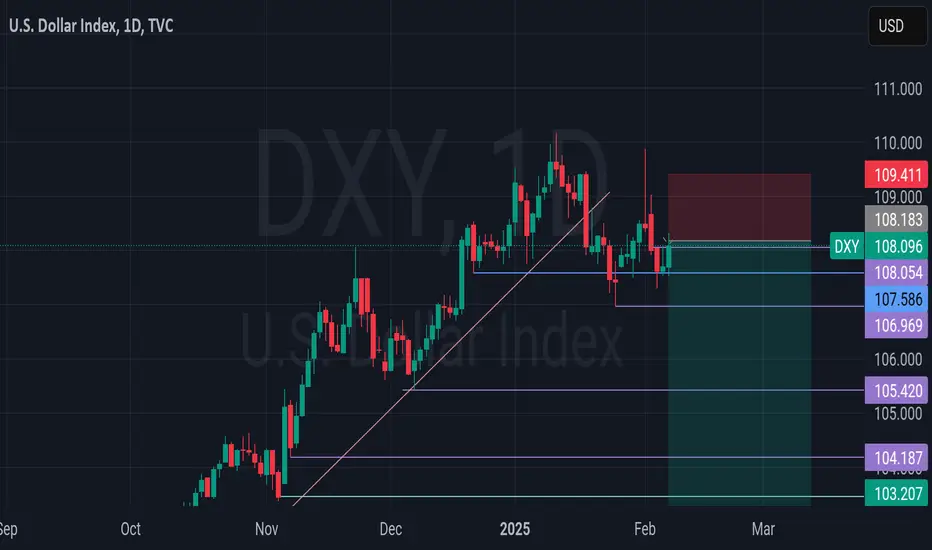
DXY is bearish, dont be caught off guardI've been saying this since beginning of this year. I've given macro reasons. The chart is also reflecting it now.
Monthly time frame
Dxy on the monthly formed an indecison candle. I'm expecting February to close bearish to complete the formation of evening star.
Wkly time frame
A close look at the weekly timeframe will show a double top forming. And it formed after taking a critical high. And evening star has already formed here. Last week price action caused a retest and rejection from the zone
Daily time frame
Now the daily time frame is filled with patterns pointing downwards.
We start with a 3 drive pattern that has been broken to the downside. Last weeks price action offered a retest and has also moved away from it with impulse.
We can also see a classic head and shoulder pattern. Some may be seeing double top depending on how you draw it.
Market has also been following a trendline since 30th September,2024. The trendline has been broken, retested and moved away from with impulse.
In all, the trend is down.
I wonder how you guys are missing all this
Now, I know you may be confused as a result of Trump's policies and sanctions and actions and inactions. fear not, he did the same in 2017, he wants dollar to be weaker to ease purchase for average Americans. The only thing he will offer is crazy spikes. That's all
The market has already recovered from his tariff shenanigans. It's all an illusion, a fugazi to swerve you from what is really happening, dollar will be weak. At least till 4th quarter of this year. My target is still 100. Let's see how it goes
You can use any of your strategy to look for buy in cross pairs like EUR ang GBP
I will also send some for you guys, just follow me to see it on time cos I mostly enter with buy order and not limit order.
Udo diri unu
HBAR Bullish ScenarioHBAR is one of the ISO20022 coins and might be showing a bullish cypher pattern unless proven otherwise. It has a lot of potential just like any other ISO20022 coins as we are gearing up for Quantum Financial System.

EURUSD Move EURUSD is still looking bearish but we might see it going up before its gonna fall on CPI news

GBPUSD - ANALYSIS👀 Observation:
Hello, everyone! I hope you're all doing well. Let me share my personal view on GBP/USD with you.
Based on the GBP/USD chart, I expect the price to continue its downward movement and reach 1.19872.
However, if GBP/USD closes above the 1.25012 level in the 4-hour timeframe, I expect further upward movement toward 1.28340.
📉 Expectation:
Bearish Scenario: Drop to 1.19872.
Bullish Scenario: Close above 1.25012, targeting 1.28340.
💡 Key Levels to Watch:
Resistance: 1.25012, 1.28340
Support: 1.19872
💬 What’s your outlook on GBP/USD? Share your thoughts in the comments below!
Trade safe

ETH/USDTeth ETF inflows are 2x BTC's
eric Trump calls it a good time to buy
gas fees down to just $0.04
eth foundation restructuring

EUR downtrend under pressureEUR/USD is currently showing a volatile downward trend, with prices hitting key support and resistance areas many times, and no significant directional breakthrough has occurred.
From the overall trend, prices have been falling since the high of 1.05230, breaking through multiple key support levels, and are currently hovering around 1.03217, showing weak characteristics. From the perspective of the trend line, the obvious downward trend line suppression has exerted continuous pressure on prices, and the current price has failed to break through the resistance point of 1.03721 above.
Resistance level: In the short term, 1.03721 is the current important resistance level, and prices need to break through this position to further open upside space. If this point is stable, it may test the higher 1.04200 area.
Support level: The key support level below is around 1.02299, which is the previous low and an area where bulls may exert their strength. If this support is broken, the downward space will be further opened, possibly pointing to 1.01500.
Pullback test: The current exchange rate may rebound and test the 1.03721 line. If it fails to break through this resistance, it may be blocked and fall back, continuing the downward trend.
Continuation of decline: If the price falls directly and falls below the 1.03000 area, it will confirm the dominance of shorts, and the target is 1.02299 or even lower.
Operation suggestions:
If the price touches the 1.03721 resistance level and there are obvious signs of pressure, you can try short-term short orders, with the target below 1.03000 and the stop loss set above 1.04000.
If the price falls back to 1.02299 and stabilizes, you can consider long orders, with the target at 1.03200, and the stop loss is recommended to be set below 1.02000.
The current EUR/USD trend is still dominated by oscillating downwards. It is necessary to pay attention to the breakthrough of key points to determine the next direction and maintain a flexible operation strategy.

Practice: Expecting SMS here.This is a practice from a new course I'm taking, for logging purposes.
Please do not trade.
Any constructive comment is accepted
Takeprofitttader
Tiktiktradee

NIFTY : Trading levels and plan for 11-Feb-2025
Key Levels to Watch
✅ Resistance Zones:
23,486 – Opening Resistance
23,558 – Last Intraday Resistance
23,694 – Strong Resistance & Potential Reversal Zone
✅ Support Zones:
23,364 - 23,394 – Opening Support/Resistance
23,292 – Important Support Level
23,000 - 23,062 – "Do or Die" Zone for Buyers
🚫 NO TRADE ZONE: 23,364 - 23,394 (Avoid trading inside this range unless a clear breakout or breakdown happens)
📌 Scenario 1: Gap-Up Opening (Above 23,394)
If NIFTY opens above 23,394, it signals strength. However, we must wait for a confirmation before entering a trade.
Bullish Plan: If NIFTY sustains above 23,394, consider going long with targets 23,486 → 23,558 → 23,694.
Stop Loss (SL): Below 23,394 on a 5-minute closing basis.
Alternative Trade: If NIFTY reaches 23,694 quickly, watch for exhaustion signs to take a reversal trade with a small SL.
🎯 Pro Tip: If momentum is strong, book partial profits near 23,558 and trail SL to cost for remaining quantity.
📌 Scenario 2: Flat Opening (Between 23,364 - 23,394)
A flat opening inside the NO TRADE ZONE means uncertainty. Here’s how to approach it:
If NIFTY breaks above 23,394, follow the gap-up plan and go long.
If NIFTY breaks below 23,364, it signals weakness. Enter short below 23,364 for targets 23,292 - 23,062.
If NIFTY remains sideways between 23,364 - 23,394, avoid trading and wait for a breakout/breakdown.
🎯 Pro Tip: If unsure, let the first 15-minute candle close before taking a trade.
📌 Scenario 3: Gap-Down Opening (Below 23,364)
If NIFTY opens below 23,364, it suggests bearish sentiment. However, there are key support levels nearby.
Bearish Plan: If price stays below 23,364, short with targets 23,292 → 23,062 → 23,000.
Reversal Opportunity: If NIFTY falls towards 23,000 - 23,062, watch for bullish confirmation. A bounce from this zone can offer a buying opportunity with SL below 23,000 and target 23,292.
Stop Loss (SL): Keep SL above 23,364 for short trades.
🎯 Pro Tip: If the gap-down is deep, avoid chasing shorts. Instead, wait for a pullback to 23,364 before shorting.
📢 Risk Management & Option Trading Tips 🛡️
✅ Always Use Stop Loss – Protect your capital at all times.
✅ Avoid Overtrading – Stick to your plan and don’t force trades.
✅ Position Sizing – Risk per trade should be 1-2% of total capital.
✅ Choose the Right Option Strikes – For CE trades, prefer entries near support zones. For PE trades, prefer entries near resistance zones.
✅ Avoid Buying Far OTM Options – Focus on ATM or slightly ITM strikes for better movement.
✅ Watch Open Interest (OI) Data – OI buildup at key levels can signal possible reversals.
📌 Summary & Conclusion 📊
🔹 Bullish Above: 23,394 → Targets 23,486 / 23,558 / 23,694
🔹 Bearish Below: 23,364 → Targets 23,292 / 23,062 / 23,000
🔹 No Trade Zone: 23,364 - 23,394 – Wait for breakout/breakdown.
🔹 Reversal Buy Zone: 23,000 - 23,062 – Watch for bullish confirmation.
⚠️ Patience & Discipline Win the Market! Stick to the Plan.
📊 Live Updates & Quick Analysis:
🚨 Disclaimer:
I am not a SEBI-registered analyst. This analysis is for educational purposes only. Please do your own research before taking trades. Trade safe! 📈🔥

XAUUSD BUY SIDE Hello Dear All Traders
Here is My XAUUSD GOLD Forcast Lets see and share your ideas in comments i will be Glad 😊
XAUUSD Outlook Pattern in BUY side from 2877 and nice way to moving buy side if the price will move at 2869 support after pull back to the resistance s shows in the charts
🔑Key Points
Support Level 2869
Resistance 2900
Here is Key points to take profit with scalping Mood

BUY USDJPY SOARINGGood day traders, hope you're having a profitable day, tune into this next move on USDJPY making a long, evident of a weak trend, a reversal is long overdue.
Check out our profile or our Instagram to join our free Telegram channel and learn more about this trade and gain access to exclusive features and updates.
