Nasdaq market analysis: 10-Feb-2025Good morning Dear Traders! Join me for the first Nasdaq market analysis for the week. Share your charts, ask questions, and let's discuss trading strategies.
Community ideas

Is Tata Motors Ready for a Bullish Reversal?Timeframe: Daily
Tata Motors (NSE) has been in an expanded flat correction pattern for the past 11 months. In this pattern, the highest high (HH) was 1179, and the lowest low (LL) was 683.2. Currently, the price is trading below the 200, 100, and 50 EMA levels, indicating a bearish trend.
In this expanded flat correction:
Wave (A) completed at 855.4,
Wave (B) peaked at 1179,
Sub-wave 4 of Wave (C) touched 786.65,
Sub-wave 5 is now unfolding.
Once Wave 5 is completed, traders can look for buying opportunities with target levels at 799 – 951 – 1050+. First, it’s crucial to identify the end of Wave (C) to confirm the correction’s completion and a bullish reversal.
Projecting ending point of wave (C):
Wave (C) may end at 2.618% of Wave (A) around 628.7.
Wave 5 has multiple potential targets/support levels:
0.618 extension of Wave 1 at 526,
0.382 extension of Wave 1 at 628,
1.618 reverse Fibonacci of Wave 4 at 657,
2.618 reverse Fibonacci of Wave 4 at 562.
We will update further information soon.

Solana (SOL): Symmetrical Triangle Nearing Decision PointOverview:
Solana (SOL) has been in a three-week downtrend, forming a symmetrical triangle pattern on the chart. The price is currently approaching a key trendline resistance and a supply zone, making this a crucial moment for price action.
Key Technical Observations:
Downtrend Structure: SOL has been respecting a downward trendline with four touchpoints, indicating strong seller dominance.
Symmetrical Triangle Formation: This pattern suggests a potential breakout scenario, with price compression indicating an imminent move.
Supply Zone Resistance: The price is nearing a critical supply zone, where previous rejections have occurred.
Volume Analysis: Declining volume within the triangle suggests a potential volatility spike upon breakout.
Potential Scenarios:
Bullish Breakout: A break above the downward trendline with increased volume could trigger a move toward 240-260 resistance, potentially flipping the trend bullish.
Bearish Breakdown: If SOL fails to reclaim the trendline, rejection from the supply zone could lead to a continuation of the downtrend, targeting lower support near 140-160.
Confirmation & Invalidations:
Break & Close Above Resistance: A daily close above the trendline with strong volume confirms a bullish breakout.
Rejection & Breakdown: If SOL gets rejected and breaks below triangle support, it may revisit lower support levels.
📌 Key Levels to Watch:
Support: $190-200 (Trendline & Supply Zone)
🔥 Conclusion:
SOL is at a make-or-break point as it approaches trendline resistance within a symmetrical triangle. Traders should watch for breakout confirmations, volume spikes, and momentum shifts before positioning for the next move. 🚀

ARKMUSDT 3DARKM ~ 3D Analysis
#ARKM If you still have a Conviction on this Coin, Maybe you can consider this support to start buying again.

$NVDA - week of Feb 10 2025NVDA -uptrend
Above 132-134 (demand/supply area)
Above 130- targets 132
Below 124 - Puts

USDJPY POSSIBLE BUY?Overall direction is to the upside based on Monthly and Weekly perspective.
The market is currently testing the current Weekly 0.61 & 0.786 Fib area. Based on 4HR TF, the market seems to be forming a possible reversal pattern which could lead to a possible reversal.
We could see BUYERS coming in strong should the current level hold.
Disclaimer:
Please be advised that the information presented on TradingView is solely intended for educational and informational purposes only.The analysis provided is based on my own view of the market. Please be reminded that you are solely responsible for the trading decisions on your account.
High-Risk Warning
Trading in foreign exchange on margin entails high risk and is not suitable for all investors. Past performance does not guarantee future results. In this case, the high degree of leverage can act both against you and in your favor

NAS100Hello Investors, we are in a global crisis "what's trending is tariffs, USAID, trade wars and AI". Each and every day, we are facing challenges The US President & his bad decision making. We are expecting the next market crash until issues are sorted out. The market is very bearish, I personally not expecting new highs. Am expecting 5000 pips drop first meaning we will be visiting all support areas were market held previous.
2023 support looks like a good area, where price can possibly hold. If not, things can get worse until further Feds and other sector take charge.
We are in a bearish market starting this Month.
Let's get ready book those profits

Fundamental and Techincal support the moveI really like this opportunity, so I'm making a big move first thing Monday morning. The earnings are strong, and the stock has broken out of the accumulation phase with a big candle and high volume. I see potential for a continuation up to $150, but let's see how it plays out.

Trading the VIX - A Balanced Strategy for Smart InvestorsWarning:
This strategy is presented as a trading idea and should not be considered guaranteed trading guidance. Traders are responsible for their own decisions and should carefully evaluate risks before executing any trades.
Given that VIX is generally between 13 and 20, I designed this option strategy.
Combination VIX Vertical Spreads
Strategy Overview:
Days to Expiry (DTE): 37
Option Positions:
Buy VIX 13 Call
Sell VIX 15 Put
Sell VIX 20 Call × 2
Visualized Setup
Strategy Summary:
This strategy results in a combination resembling a modified short straddle centered at VIX 20. However, in structure, it is better understood as a short strangle (neutral) combined with a bull call spread (bullish). The bullish component of the spread suggests that the trader expects the VIX to rise above 13 but remain below 20. The inclusion of a short strangle component helps offset the premium of the debit call spread.
This structured approach allows for a calculated risk-reward balance, aligning with the trader’s outlook on implied volatility while leveraging option spreads to optimize capital efficiency.
Risk and Reward Assessment:
The strategy is heavily weighted towards a long VIX bias, meaning the trader anticipates an increase in VIX, though at a measured pace within a month.
There is a slight increase in risk to the short side of VIX due to the exposure created by the short options.
The expected profit range suggests that VIX volatility will stay within a defined range of 14 to 24. While the trader acknowledges the possibility of VIX exceeding 20, it is not expected to surpass 24.
The probability of profit at expiry is estimated at 65% if entered today. Despite the additional short-side risk, the overall risk remains comparable to a standard short strangle.
Historical VIX data indicates that the index fluctuates between 12 and 40 on a monthly basis, with a 52-week high of 65.7 and a 52-week low of 10.6. This reinforces the strategy’s inherent higher risk to the long VIX side.
Key Considerations for Execution:
Event Risk: Confirm that no major events (e.g., geopolitical instability, Federal Reserve announcements) are expected that could push VIX above 30.
Entry Timing: Optimal entry is when VIX is at a relatively low level, such as observed last Friday (2/7/2025) morning.
Exit Strategy: The position should be closed in approximately two to three weeks or when profit exceeds 100%.
Notes and Alternative Strategy:
One challenge of this strategy is the uncertainty in determining a precise stop-loss strategy. However, given the nature of a strangle, there is no immediate need to exit within the first 20 days, making it a relatively "lazy" management strategy. The trader has ample time to adjust after the initial 20-day period.
Management should be approached by treating the bull call spread and short strangle separately. Given the natural variance of VIX, this approach should not be overly difficult to execute.
A suggested alternative strategy might provide more controlled risk exposure. For example, I would start the trade with a butterfly at 20 if I see the potential rise of VIX. Then, I would reassess it after 30 days (assuming DTE=37; a shorter DTE may also be considered). Alternatively, I could simply wait until expiration day to make a final decision. This strategy has a limited loss while maintaining a similar profit potential.
The suggested strategy manages the cost-efficiency aspect while also limiting potential losses. The decision-making process can then be based on market direction after the expected conditions begin to form.
In comparison to the original strategy in terms of profit and exit timing, the proposed strategy may offer a faster exit, whereas a butterfly setup may require waiting until expiration. However, traders may find early exits possible for condors or strangles.
Here is a visualization of the alternative setup:
Alternative Strategy Visualization
Thank you for reading. Wish you a successful options trading!

eurusd|foxforexA cup-handle formation has formed on the eurusd chart. A short position with a stop above the 1.035 level will be a profitable position.

GOLD TECHNICAL ANALYSIS WAIT FOR BREAKOUT THIS LEVEL.Gold forecast and technical analysis M30 time frame next move possible just wait for this level breakout 2898 then we expect down side move. Not financial advice.

US30 NEXT LEVEL IS 43000 - 42500I think now US30 ready for down trend. they did a double top on up-trend moving chanel. Maybe this is a sign for trend change in the short term.
I am looking at US30 on levels 43,000- 42,500.

GBPUSD AnalysisIn the previous few analyses, I was in favor of selling, and the point after hitting the target was
Now that
the pattern is targeted,
I expect the price
to retrace to 50% of
the previous wave.

ABOUT TRUMPUSDTMy option about trumpusdt it is time to bullish,and that is strong support,it’s time to buy in the right now and that’s only forecast not signal

DOTUSDT SLIGHT BULISH"After a few days, I can see a bullish movement in DOTUSDT for the short term.
This analysis is based on recent candles, and the targets are close together, making them achievable in the short term.
Note: Please pay close attention to the danger zone and stop loss levels to manage your positions effectively.
Note: My ideas are not intended for any type of scalping or scalpers!
You can find the full list of my ideas here: www.tradingview.com
Here are some of my ideas:


SILVER Technical Analysis! BUY!
My dear followers,
This is my opinion on the SILVER next move:
The asset is approaching an important pivot point 31.808
Bias - Bullish
Technical Indicators: Supper Trend generates a clear long signal while Pivot Point HL is currently determining the overall Bullish trend of the market.
Goal - 32.031
About Used Indicators:
For more efficient signals, super-trend is used in combination with other indicators like Pivot Points.
———————————
WISH YOU ALL LUCK

$DIA Analysis, Key Levels & Targets for Day Traders for Feb 10 2AMEX:DIA Analysis, Key Levels & Targets for Day Traders for Feb 10 2025
Red signal line.
Expected move between 435-450 for the week….
I don’t have a whole lot to say about this at the moment but as the week moves on I will add. DIA is definitely at a critical level here

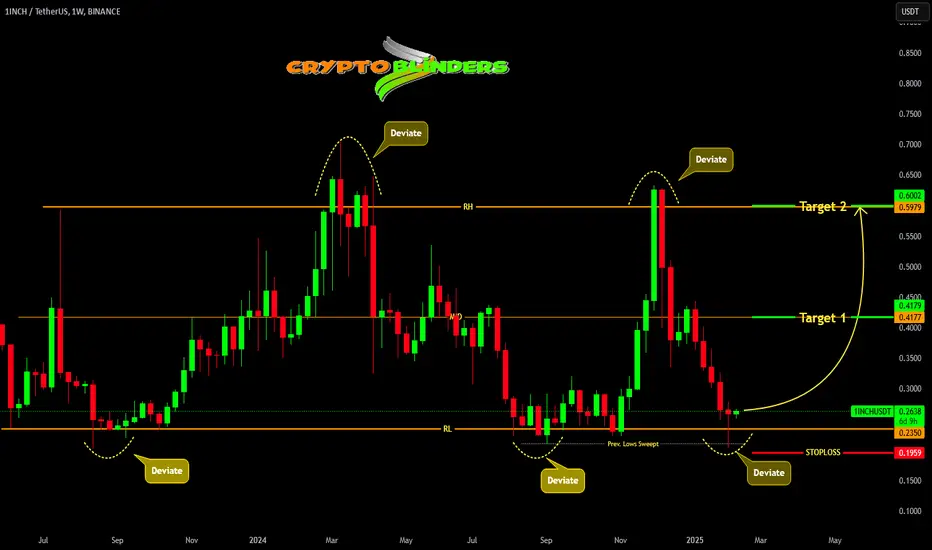
1INCH ABOUT TO MAKE A BIG MOVE !!!1inchusdt been trading in a range, had recently swept previous lows and deviated range low and reclaimed it. It signs a strength and we can expect targets of mid range and range high putting stops below recent low.
Monster Weekly Breakout?ASTS is forming a bullish pennant on the weekly chart, characterized by a pullback on declining volume after a strong impulse move. The stock recently made a high near $25 and is consolidating in a tightening range, indicating a potential continuation pattern. The declining volume during this pullback suggests sellers are weakening, while buyers are likely waiting for a breakout confirmation.
Trade Plan:
• Entry Trigger: A weekly close above $25 will confirm the breakout from the pennant and signal bullish continuation.
• Price Target: First target at $30, aligning with the measured move projection from the initial leg of the rally.
• Stop Loss: Below $23, to protect against a failed breakout and trend reversal.

AUD/USD Breakout Watch: Bullish Continuation or False Alarm?The AUD/USD pair is trading in a consolidation zone after breaking above a key descending trendline, signaling bullish momentum.
The price has retested the breakout level, turning resistance into support, strengthening the outlook. With the RSI at 51.32, holding above 0.6200 could push the price toward 0.6400, with a target near 0.6700.
A drop below this level may trigger a pullback.


DXY (Dollar Index)After breaking out of a rising wedge price failed to break lower. The 107.48 area is acting as a strong support together with a Bullish Order Block at 107.200
Once price breaks past the 109.380 level I'm anticipating a return/retest on that level for a re entry opportunity. More updates to follow
