USD/JPY: Potential Break and Yen Strengthening AheadHello everyone!
The USD/JPY exchange rate has dropped below the daily MA200 level and is currently testing support at 150.150. However, this support level does not appear to be strong enough and is likely to be broken soon, which would pave the way for further Yen strengthening towards 149.30 and more likely to 147.00.
The most significant resistance level in this scenario is at 147.00, as it coincides with the 0.618 Fibonacci support level and the weekly MA100 level. These technical factors suggest that if the price breaks lower, the Yen could gain significant momentum.
#USDJPY #ForexAnalysis #YenStrength #ForexTrading #TechnicalAnalysis #Fibonacci #SupportResistance #ForexSignals #MarketUpdate
Community ideas

Claasic Zigzag on DocuSign. DOCUIt is always fun to see the easy picks unfold. The textbook type. Not only are they easy to spot, if you actually read trader literature, they make further position management much, much easier. Adaptive indicators, momentum are in agreement with the Elliott Wave take on this picture.
Dollar Index - Trump & TariffsWith a lot of fundamental conflicts at play, one being the tariffs war on China, EU, Mexico and Canada (we don’t know yet if any more countries will be affected), we are seeing the result in price action.
We are trading in a range from 110.176 - 106.969 and so far, Dollar has managed to support the weekly BISI @ the 107.500 region but also trade up to and reject the 109.770 HTF PD array.
Ultimately, it will be fundamental news that will grant dollar the necessary volatility to run to liquidity pools. My guess, to the downside

$SPY February 10, 2025AMEX:SPY February 10, 2025
15 Minutes
For the rise 595.99 to 608.13 AMEX:SPY retraced 61.8%. So, 601-602 is a good level to go long with SL 598.
Since the retracement was 61.8% double top is possible around 607-608 levels.
So looks good R:R ratio.
Foe the fall 6018.13 to 600.65 need to cross 605.5 for uptrend.
Hence 601-602 buy will have a target 604-605 levels.
But AMEX:SPY at the moment is below moving averages with 200 and 50 being around 603 to 604 levels which i expect to be resisted.
Hence no trade today.

DXY "DXY Sell Setup: With easing US tariffs and a shift to risk-off sentiment, I'm targeting a move down to around 106.969 before any rebound. Stay sharp—this sell opportunity could be significant. #DXY #Forex #SellSignal"

XAUUSD, 1h ANALYSISHello traders and investors !
hope you are fit and fine doing well today.
What are you thinking about Gold today?
Gold is in stong bullish trend showing buyers pressure here,however at the current market levels there are 2 risky zone one is to enter sell from 2882 with low risk regarding a target of 2840 and the other zone to place buy at current market for scalping with a target of 2882 and 2900, if the volatility occurs in Gold then we may see $3000 soon .
Please don't forget to like and comment on idea its motivation for me
happy trading
Best wishes Tom

DXY Weekly BiasMy bias for this index is bearish considering that we retested and confirmed the Weekly Bearish Order Block at 109.65.
I do anticipate that the index might be attracted towards Sellside Liquidity at 107.27, 106.95 ,and 105.4.
Our daily setup will further give us the best entry and stop loss.

BTC/USD - 4H Analysis & PredictionBTC/USD - 4H Analysis & Prediction
🔻 Key Demand Zone:
✅ $93,326 - $90,268 (Strong liquidity area)
📊 Expected Scenario:
Price may dip into this demand zone before a bullish reversal.
Fibonacci levels indicate potential resistance at $98,640 (0.5), $100,381 (0.618), and $102,859 (0.786).
Watch for confirmations of bullish momentum before entering long positions! 🚀
#FXFOREVER #BTCUSD #CryptoTrading #SmartMoney #Fibonacci #Bitcoin

Gold Focus for the Week (XAUUSD)Looking at the chart, Gold is currently ranging within a Ranging Box and is testing a key Sell Zone at 2863 - 2866.
Expected Market Movements:
1. Bearish Move First:
• If price respects the Sell Zone, we might see a short-term drop to lower support levels around 2850 - 2827 before gathering liquidity.
2. Bullish Reversal Expected:
• After liquidity grab at lower levels, a bullish push could send price rallying back up to 2874 - 2890.
Key Levels to Watch:
• Sell Zone: 2863 - 2866
• Support Levels: 2850 2839 and 2827
• Resistance Levels: 2873 - 2890
🔹 Strategy Suggestion:
• Look for sell entries if price holds below the sell zone.
• Watch for a buy setup after the liquidity grab below 2850.
📌 Stay patient and wait for confirmation before entering trades!

#Bitcoin 2024\2025 mega bull process is loading!Do not take seriously the negative news feeds served before the bull run!
2024, will be the mega bull start year as it was in 2012\2016\2020!

EUR/USD & GBP/USD - Is the Bull still alive...After the Trump tariffs gap last week, the EUR/USD and GBP/USD experienced a significant gap down but recovered nicely. GBP/USD positions were closed at a small profit to protect overall risk but still holding long positions on the EUR/USD and continue to look for 1.0600 as long as price does not exceed 1.0200.
Expecting some volatility this upcoming week especially with Fed chairman Powell testifying on both Tuesday and Wednesday. Will keep an eye on price action and it's development.
Aside from FX, still holding SOXL and looking for the gap to be filled but keeping a close eye on the breakdown below $24.
Good Luck & Trade Safe.

SOL 4 hr breakout coming 2 Patterns ConvergeLook at my busy chart, been keeping it all for the run...
But SOL on 4hr is ready to breakout. may be a retest to 198.5 but both a falling wedge pattern with the red arrow and the measured move from the W pattern both break north somewhat like the Lark lines in yellow, to 216 not much in the way to 230, may snap north
Stop loss below the base of the W
Download the chart if you want and look at the greater trend lines on the 3-5 day time frames

gbpnzd|foxforexgbpnzd started to pull back with the reaction it received from the upper resistance of its falling channel. It will first pull back to the level of 2.1840.


ADA with a series of 1-2Cardano's ADA continues to maintain its structure, as long as it stays above the first invalidation level, preserving the current degree wave 1-2. I anticipate a strong bullish continuation due to the long price history and strong community backing.


Solana (SOL): Possible Fill of FVG / Waiting For BoS.Solana has a chance to break from structure, which would lead to a fill of FVG! After that we are going to look for a drop of 12%!
More in-depth info is in the video—enjoy!
Swallow Team


Breakout on FUTU Holdings. FUTUNo indicator is really needed to tell that there is a breakout happening. This may be a start of a Wave 3 of impulse. Technically the picture is looking bullish in unison. Another list of factors why is probably not necessary.
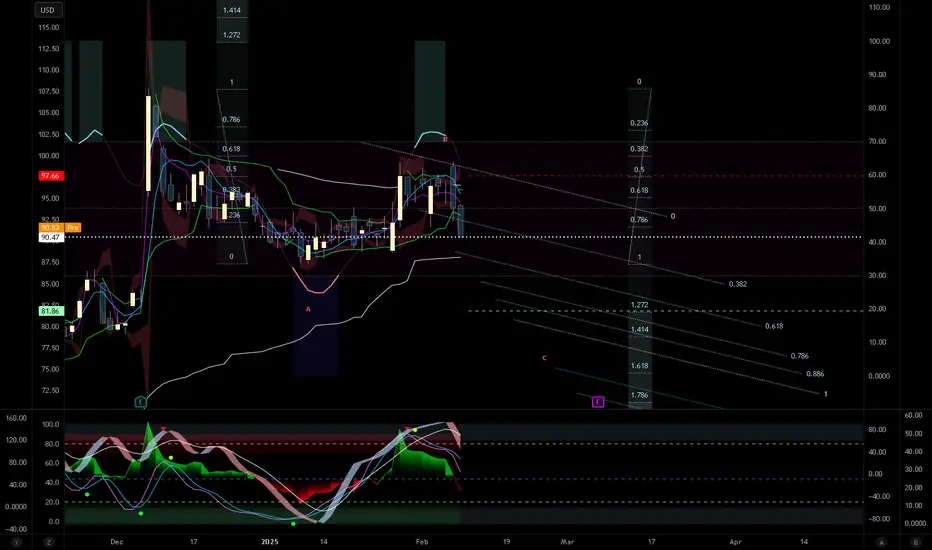
IO Weekly Technicals Review [2025/06]: Correction Looms SGX TSI Iron Ore CFR China (62% Fe Fines) Index Futures (“SGX IO Futures”) rose last week, closing USD 2.25/ton higher by 07/Feb (Fri).
SGX IO Futures opened at USD 105.05/ton on 03/Feb (Mon) and closed at USD 107.30/ton on 07/Feb (Fri).
Prices briefly touched a weekly high of USD 107.50/ton on 07/Feb (Fri) and a low of USD 102.00/ton on 03/Feb (Mon). It traded in a range of USD 5.50/ton during the week, which was wider than the prior week.
Prices traded between the pivot point of USD 105.35 and S1 point of 103.85 throughout the week, crossing the R1 point of USD 107.20/ton on Fri and closing above it.
Volume peaked on 07/Jan (Fri) with volume increasing significantly compared to the previous week levels.
Iron Ore Fundamentals in Summary
Dalian iron ore futures reached a four-month high, posting strong weekly gains. The recovery was driven by steel mills resuming production, increased activity in the property sector, and rising Chinese equities after the Lunar New Year.
China filed a WTO complaint against new U.S. tariffs and urged dialogue. While trade tensions remain a concern, steel-related commodities continued to rise, with steelmaking ingredients and Shanghai Futures Exchange benchmarks posting strong gains.
Iron ore futures rebounded as a softer U.S. dollar (-0.4%) made commodities more affordable for global buyers. Additionally, Rio Tinto cleared ships from Western Australian ports due to cyclone threats, adding a risk premium to prices.
China's port IO stockpiles rose by 4.63 million tons (+3.19%) WoW to 149.91 million tons for the week ending 07/Feb per MMI data.
Based on seasonality, SGX IO Futures Mar contract trades 17.3% below its last 5-year average (USD 125.16/ton).
Short-Term Moving Averages Signal Bullish Trend, But Correction Looms
Formation of a golden cross on 17/ Jan (Fri) followed by upward trend for three weeks indicating that the bullishness may sustain in the near term. Prices are trading above both the short-term moving averages.
Long-Term Averages Indicate Convergence of Moving Averages
IO prices crossed and closed significantly above the 200-day DMA. Signaling a strengthening bullish trend as prices beats the 200-day DMA, with a probability of convergence between long-term moving averages.
MACD Signals Bullish Momentum; RSI Inching Towards Overbought Zone
The MACD signals a positive momentum starting from 14/Jan with growing bullishness observed last week. Meanwhile, the RSI is at 65.08, is inching towards the overbought zone and it hovers above the midpoint, with its RSI-based moving average at 60.97.
Volatility Rose, Price Closed Above 50% Fibonacci Level
Volatility gained upward momentum late in the week. Prices traded between the 38.2% Fibonacci level (USD 103.10/ton) and the 61.8% level (USD 107.62/ton), closing below the 61.8% Fibonacci level. Going forward, 61.8% Fibonacci level (USD 107.62/ton) may act as resistance, with 50.0% Fibonacci level (USD 105.36/ton) as support.
Buying Pressure Intensified, Price Trading Near the Upper-Bollinger Bands
Buying pressure has intensified in the later part of the week according to the Accumulation/Distribution (A/D) indicator. The price is trading between the upper-volume node and basis-volume node, closing the week near the upper-volume node.
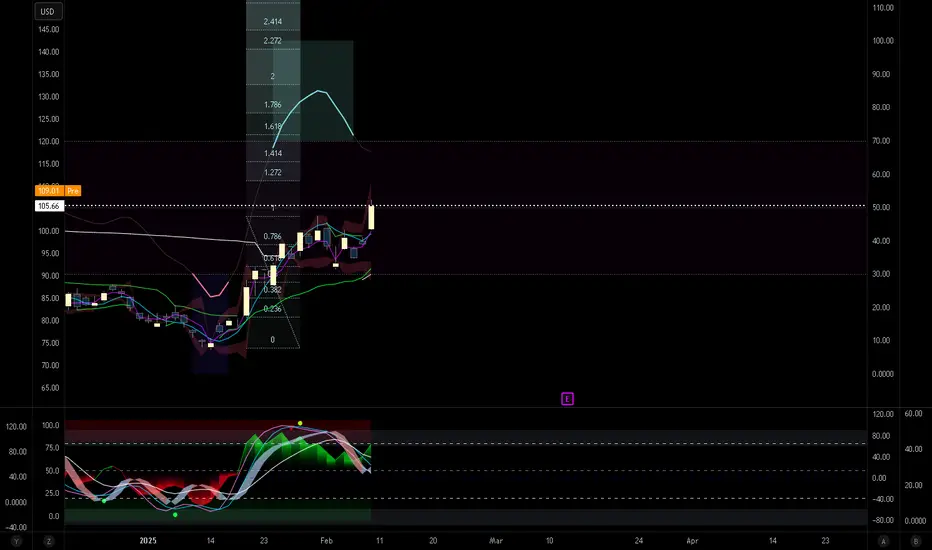
IO Prices Rise Towards CNY & Then Decline Thereafter
Between 2021 & 2024, SGX IO futures prices have risen leading up to the Chinese New Year before tapering off ten trading days after the holiday. Prices declined before & after CNY holidays only in 2024 while prices continued to rise even after CNY before falling sharply in 2021 & 2022.
A similar trend was observed in the ten-day period leading up to CNY 2025.
IO Futures Only Aggregate Exposure
Financial Institutions (FIs) are net long with 136.6k lots across all futures expiries. Managed Money participants, Physicals participants and Others are net short with 15.5k, 103.5k and 17.3k lots respectively across all futures expires. Managed Money decreased net short positions, Physicals increased net short positions while FIs decreased net long positions last week. Overall futures open interest was 1,179,418 lots as of 31/Jan stood at lots (-3.5%) while it was 1,222,981 lots as of 24/Jan.
Source: SGX
IO Futures & Options Aggregate Exposure
Financial Institutions (FIs) are net long with 133.2k lots across all futures & options expiries. Managed Money participants, Physicals participants and Others are net short with 7.0k, 106.9k and 19.2k lots respectively across all futures and options expires. Managed Money decreased net short positions, Physicals increased net short positions while FIs decreased net long positions last week. Overall futures and options open interest was 1,421,263 as of 31/Jan stood at lots (-5.2%) while it was 1,499,318 lots as of 24/Jan.
Source: SGX
Historical Futures Aggregate Exposure by Market Participants
Physical participants have switched from net long to net short over the last three weeks. Managed Money participants have maintained net short positions for the past month. Financial Institutions continue to hold net long positions since the second quarter of this year.
Source: SGX
Hypothetical Trade Setup
Prices are currently trading above short-term moving averages and significantly above both long-term moving averages, hovering near the upper Bollinger Band, which suggests potential resistance at these levels. Historical trends indicate a pattern of price declines in the last three days of the 10-day period following the Chinese Lunar New Year, a movement that could potentially repeat this year. While managed money participants have reduced their short positions over the past two weeks, signaling a more optimistic outlook, we take a contrarian view and recommend a short position strategy this week, anticipating a potential price correction from current levels.
The hypothetical trade setup involves entering a short position at USD 107.6/ton with a take profit level at USD 104.3/ton combined with a stop loss at USD 109.0/ton resulting in a 2.35x reward-to-risk ratio.
DISCLAIMER
This case study is for educational purposes only and does not constitute investment recommendations or advice. Nor are they used to promote any specific products, or services.
Trading or investment ideas cited here are for illustration only, as an integral part of a case study to demonstrate the fundamental concepts in risk management or trading under the market scenarios being discussed. Please read the FULL DISCLAIMER the link to which is provided in our profile description.

SUIUSDT 1H Analysis Update✅ SUIUSDT 1H Analysis Update
🔹 Support Level: 2.7 USDT
🔹 Resistance Level: 4.3 USDT
📊 Key Insights:
In the short-term analysis, SUI has strong support at $2.7, indicating a potential 60% growth from this level. This movement is likely to occur with the reopening of global markets.
———————————————————
📥 For more analysis:
🔗 @MohsenHasanlu
📅 2025/02/10

eurnzd|foxforexEURNZD fell to an important support level. We think it will break its downward trend with the reaction it will receive from this support. After the retest, the first TP will be 1.8400, then the second TP will be 1.8500.

GBPUSD CONTINUE ITS TREND Technically:
GBPUSD respecting the trend line
GBPUSD after retracement continue to make new HH
Fundamentally:
According to COT data
BXY is bullish
DXY is bearish
