BTC SHORT TP:95,000 07-02-2025"Btc is currently looking for a short position on a two-hour timeframe, targeting a take profit in the range of 95,000 to 95,500. This anticipated movement is expected to occur within a timeframe of 5 to 15 hours; if it does not happen within this period, the analysis will be considered invalid. Please stay updated for further follow-up on this position."
Community ideas

A BUY and a SELL on GOLD (5 mins/15 mins TF)Hello guys,
According to the chart, it looks like most traders are sellers in the market. However, the price needs to rise a bit more before a sell movement begins.
An important note: I see an uptrend for gold in the higher time frames (HTF), so all positions should be scalped with a small stop-loss (SL). Please be careful and manage your entry volume accordingly.
Let me know your thoughts on these positions.

EURUSD: Market of Buyers
Remember that we can not, and should not impose our will on the market but rather listen to its whims and make profit by following it. And thus shall be done today on the EURUSD pair which is likely to be pushed up by the bulls so we will buy!
❤️ Please, support our work with like & comment! ❤️

BTC BITCOIN SHORTPrice took London High And made a MSS , after formed an FVG, They ENtry On The FVG Retracement

USDJPY BUY ANALYSIS DOUBLE BOTTOM PATTERNHere on Usdjpy price form double bottom pattern and is likely to continue moving up as line 152.455 has broken so trader should go for long with expect profit target of 153.031 and 153.820 . Use money management

GOLDGOLD on ascending 30min trendline found support to push into a new all time high but the rally will experience 4hr supply roof in the zone of 2906-2911 and my sell zone is 2922-2918.
GOOD LUCK.


CAD/JPY SELLERS WILL DOMINATE THE MARKET|SHORT
Hello, Friends!
The BB upper band is nearby so CAD/JPY is in the overbought territory. Thus, despite the uptrend on the 1W timeframe I think that we will see a bearish reaction from the resistance line above and a move down towards the target at around 105.821.
✅LIKE AND COMMENT MY IDEAS✅

EUR/USD - Potential short if price moves to resistanceClear market structure where we see support and resistance respecting price at 1.03500. That can also clearly be seen at 4h chart.
Price is forming lower lows and lower highs
1h 50ema also closing in at 1.03500 + Pivot

AFFLE | SWING | POSITIONAL | LONGOne of the few Nifty 500 stocks which is showing Bullish price action is AFFLE. The stock is consistently forming Higher Lows and is now perfectly poised to breach new levels.
Notice how the price is trading comfortably above the Monthly Pivot which indicates Bulls are in control.
I've taken a long position in the stock for a Target to 2100 price level.

Be careful with UNI !!!The price has formed a bullish wedge on the 1h time frame, and if it breaks out, it can drive the price up to around $10.
Give me some energy !!
✨We spend hours finding potential opportunities and writing useful ideas, we would be happy if you support us.
Best regards CobraVanguard.💚
_ _ _ _ __ _ _ _ _ _ _ _ _ _ _ _ _ _ _ _ _ _ _ _ _ _ _ _ _ _ _ _
✅Thank you, and for more ideas, hit ❤️Like❤️ and 🌟Follow🌟!
⚠️Things can change...
The markets are always changing and even with all these signals, the market changes tend to be strong and fast!!

XAGUSD - Market Structure - structure probabilityhi, this is a long postion trade, i trade simple and very clean concept, use risk managment and trade safe,

here what is the possible scenario for Xauusd"XAUUSD (Gold) is presenting a strong bullish setup driven by multiple factors. Here’s why it’s a prime time to consider buying:
Safe-Haven Demand: Geopolitical tensions and economic uncertainty are driving investors toward gold as a reliable store of value.
Weakening USD: The US Dollar is showing signs of weakness, which typically boosts gold prices as it becomes cheaper for foreign buyers.
Inflation Hedge: With rising inflation concerns, gold is attracting attention as a hedge against currency devaluation.
Technical Breakout: XAUUSD has broken key resistance levels, confirming a strong upward trend with potential for further gains.
Central Bank Buying: Increased gold purchases by central banks worldwide are supporting long-term price appreciation.
Don’t miss this opportunity to capitalize on gold’s upward momentum. Always manage risk and set appropriate stop-loss levels. 🚀📈"
Disclaimer: This is not financial advice. Do your own research before trading.

AUDJPY - ShortAUDJPY is forming new Lower lows.
No bullish divergence is there.
Entry is at retracement at LH.

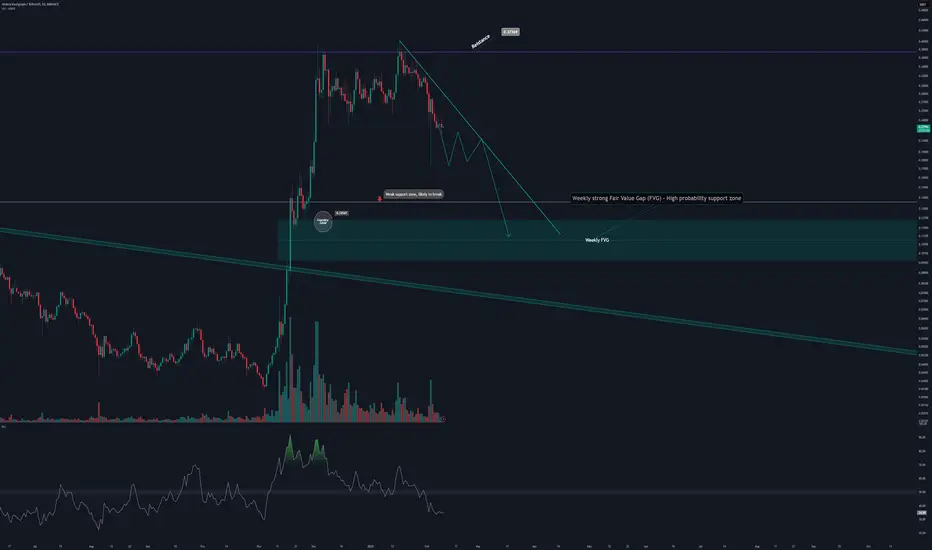
HBARUSDT Approaching Key Weekly Zone with Potential Reversal SetBINANCE:HBARUSDT HBARUSDT is approaching a weak support zone, which shows a higher probability of breaking due to insufficient strength. Below this lies a weekly strong Fair Value Gap (FVG), which is a critical level for potential price reversal and continuation of the bullish trend.
If the price enters this weekly FVG zone, it could signal a high-probability buying opportunity for traders anticipating a rebound. On the other hand, failure to hold this zone could lead to further downside.
Keep an eye on price action near the key levels for confirmation of potential entries. Always ensure to have clear stop-loss levels and realistic profit targets in place.
Best regards,
Happy trading!
SUIUSDTThe Chikou Span closed below the Kumo Cloud, confirming a full bearish trend shift, while Williams %R remained in the oversold zone (-80 to -100), signaling strong downside momentum. At the same time, Money Flow Index (MFI) was negative, indicating institutional selling pressure rather than a potential bear trap. With all three confirmations aligned, I entered a short trade, placing my stop-loss just above the Kijun-Sen and Kumo to protect against invalidation. My take-profit target is set at the next major support level, ensuring I capitalize on the momentum while managing risk effectively. 🚀📉

SPX500 - Strong sell signalSPX500 - Strong sell signal for short.
Hello traders, please feel free to share your trading ideas, and please give a Boost if you agree with my trading plan. My trading strategy is Price Action, which is the simplest strategy of trading on the price movement. A key part of my discipline is Stop Loss set when opening a trading position, which ensures every trading is risk managed. My 1 to 1 trading training is available, please message. Trade well and good luck!

GBPUSD Game Plan for the weekGBPUSD 1hr chart
Hello... A new week is coming up, We getting set to make some money... here is one of my game plan for GBPUSD for the week... I will keep updating u guys as i have other biases regarding this and other pair.
If we do get a strong bearish break of the region marked, we will be looking to short

Gold Setup: Filling Gaps Before the Next Leg Up?Gold (XAU/USD) continues to exhibit strong bullish momentum, maintaining its position within an uptrend. Currently, price is trading in the premium zone, suggesting that it may seek liquidity before continuing higher. The recent move swept liquidity on the 4-hour timeframe, taking out short-term sell-side liquidity (SSL) before stalling at $2,886.80 , the most recent high.
Looking at the price structure, there is a 4-hour gap around $2,820-$2,830 , which could act as an initial support zone. However, given the current market dynamics, there's a possibility that this gap might not hold, leading price to fill the fair value gap (FVG) between $2,780-$2,800 before reversing to the upside. This deeper retracement would allow gold to tap into fresh demand and accumulate more liquidity before resuming its bullish trend.
Gold remains fundamentally strong, and with its bullish structure intact, any pullback into these key levels could present a high-probability long setup. If price fills the lower FVG and shows signs of buying pressure, we could see a continuation towards new highs, possibly retesting and breaking above $2,886.80 in the near term.
Traders should monitor price action closely in these key demand zones, looking for bullish confirmations such as rejection wicks, order block formations, or bullish engulfing candles before entering long positions. As long as gold remains above structural support, the overall bias remains bullish, with potential for further upside in the coming sessions.

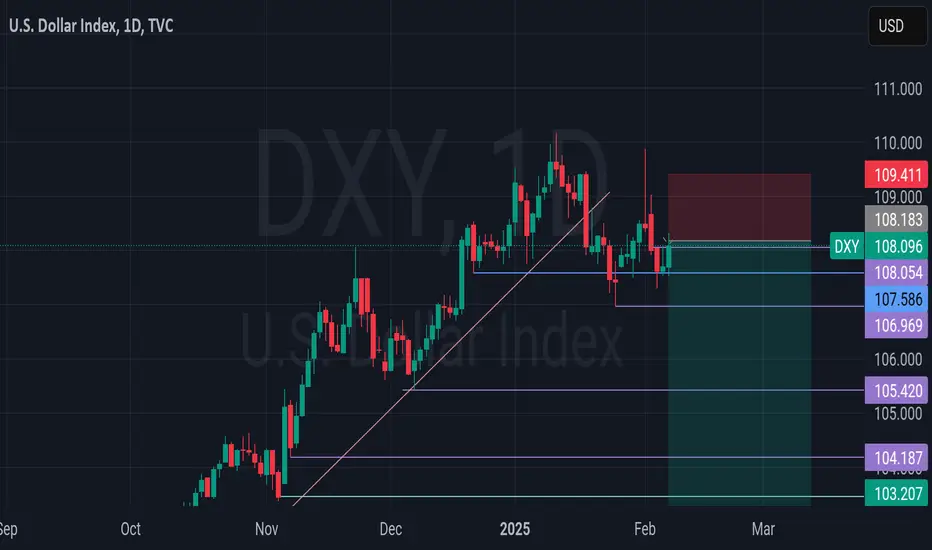
DXY is bearish, dont be caught off guardI've been saying this since beginning of this year. I've given macro reasons. The chart is also reflecting it now.
Monthly time frame
Dxy on the monthly formed an indecison candle. I'm expecting February to close bearish to complete the formation of evening star.
Wkly time frame
A close look at the weekly timeframe will show a double top forming. And it formed after taking a critical high. And evening star has already formed here. Last week price action caused a retest and rejection from the zone
Daily time frame
Now the daily time frame is filled with patterns pointing downwards.
We start with a 3 drive pattern that has been broken to the downside. Last weeks price action offered a retest and has also moved away from it with impulse.
We can also see a classic head and shoulder pattern. Some may be seeing double top depending on how you draw it.
Market has also been following a trendline since 30th September,2024. The trendline has been broken, retested and moved away from with impulse.
In all, the trend is down.
I wonder how you guys are missing all this
Now, I know you may be confused as a result of Trump's policies and sanctions and actions and inactions. fear not, he did the same in 2017, he wants dollar to be weaker to ease purchase for average Americans. The only thing he will offer is crazy spikes. That's all
The market has already recovered from his tariff shenanigans. It's all an illusion, a fugazi to swerve you from what is really happening, dollar will be weak. At least till 4th quarter of this year. My target is still 100. Let's see how it goes
You can use any of your strategy to look for buy in cross pairs like EUR ang GBP
I will also send some for you guys, just follow me to see it on time cos I mostly enter with buy order and not limit order.
Udo diri unu
#GOLD Buy 2855 - 2847💎 #GOLD Buy 2855 - 2847 💎
Stoploss 2831
Breakeven 2855.5
TakeProfit 1: 2857
TakeProfit 2: 2859
TakeProfit 3: 2861
TakeProfit 4: 2863
TakeProfit 5: 2865
TakeProfit 10: 2875
TakeProfit 20: 2895
TakeProfit 30: 2915
Trade at your own risk
Protect your capital
The Wizard 🧙♂️
Thursday 02/06/2025 10:00 AM EST

BTCUSDT BUY ENTRY OPPORTUNITYBTCUSD ranging down while still maintaining the equal lows with liquidity sweep am only looking outs for second leg down to complete the pattern double bottom for a buying entry opportunity and holding till breakouts and retest for 98k levels

USDZAR sailing in turbulent Trump tidesLast week has been a rollercoaster for the ZAR after gaping up and touching a high of 19.00 in the early hours of Monday morning following the news of Trumps executive order. The rand however regained its footing as the news got digested which allowed the rand to pull the pair below the 50-day MA currently at 18.45. It seems as if an ABC corrective wave has taken place which is indicative of another 5-wave impulse higher for the pair.
The 50-day MA at 18.45 and the current yearly low of 18.30 serve as the critical levels to watch on the pair. A failed break below 18.30 will create a double bottom at this level which will leave the rand stranded ready to be pulled higher towards 19.22.
A break below 18.30 will however allow the rand to pull the pair out of the current upward channel and test the 200-day support at 18.12. This move will invalidate my current idea on the pair.
The main event to watch for the week is the US CPI print for January, which is expected to remain unchanged at 2.9%, just like it did back for the December print. US inflation has been ticking higher since October last year, almost right after the Fed started their cutting cycle and anything other than an inline or lower than expected CPI print will have the USDZAR packing and making its way above 19.00 since it will indicate that the Fed will stay higher for longer.
