GOOGL GEX Analysis and Option Trading SuggestionsKey Observations from GEX Chart
1. Call Resistance:
* Strong call resistance at $210, indicated by the highest positive gamma concentration. This level is likely to act as a ceiling unless there's a strong bullish breakout.
2. Put Support:
* Significant put support is observed at $185, with additional support near $180. These levels are critical for maintaining bullish momentum.
3. Gamma Pivot Zone:
* $200 appears to be the gamma flip zone, where the gamma exposure transitions between negative and positive. Holding above this level suggests bullish sentiment, while falling below could signal bearish pressure.
4. IVR (Implied Volatility Rank):
* IVR at 61 indicates moderately high implied volatility, presenting an opportunity for premium-selling strategies.
5. Implied Volatility (IVx):
* IVx at 45.8 suggests stable volatility expectations, which may favor directional or neutral strategies depending on the market structure.
Option Trading Suggestions
1. Bullish Scenario:
* If GOOGL sustains above $200:
* Trade Idea: Buy a Call Debit Spread.
* Strike 1: $200 (Buy Call)
* Strike 2: $205 (Sell Call)
* Expiry: 1-2 weeks out.
* Reasoning: Targets the resistance at $205 while reducing cost and risk.
2. Bearish Scenario:
* If GOOGL fails to hold $200:
* Trade Idea: Buy a Put Debit Spread.
* Strike 1: $200 (Buy Put)
* Strike 2: $195 (Sell Put)
* Expiry: 1-2 weeks out.
* Reasoning: Aims to capture downside movement toward the next support at $195.
3. Neutral Strategy:
* For a range-bound movement between $195 and $205:
* Trade Idea: Sell an Iron Condor.
* Sell Put: $195
* Buy Put: $190
* Sell Call: $205
* Buy Call: $210
* Reasoning: Captures premium within the expected range while limiting risk.
Thoughts and Insights
* Momentum Assessment: The $200 level is critical for maintaining bullish momentum. A breakout above $205 could open the door to $210.
* Volatility Context: Moderately high IVR suggests that premium-selling strategies like Iron Condors could be effective.
* Key Levels to Monitor:
* Support: $195, $185
* Resistance: $205, $210
Reminder:
GEX data updates automatically every 15 minutes. Always check real-time data before making trading decisions to ensure accuracy and adjust for any new developments.
Disclaimer:
This analysis is for educational purposes only and does not constitute financial advice. Always perform your own due diligence and risk management before trading.
Community ideas

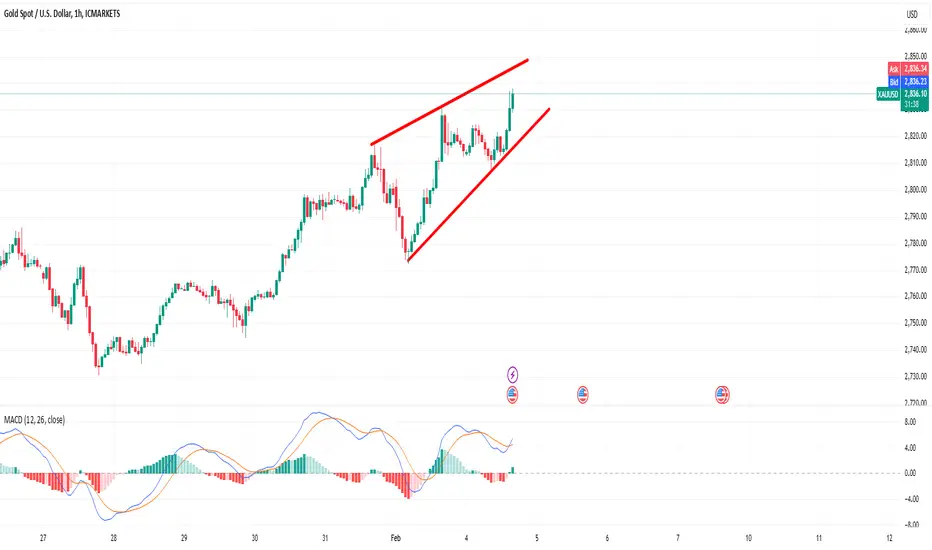
GOLD 1H CHART TRADING PLAN FOR THE DAY / READ CAPTIONAnalysis of the 1H Timeframe Chart for Gold (XAU/USD)
Previous Chart Review
The bearish move from the ENTRY LEVEL at 2,796 reached Take Profit 1 (TP1) at 2,778, validating the support at GOLDTURN levels AT 2,778.
GOLDTURN acted as a critical support level, rejecting lower prices and triggering a bullish rebound.
The upward move successfully achieved:
TP1: 2,798 ✅
TP2: 2,807 ✅
TP3: 2,817 ✅
Current Market Structure
Key Resistance Levels:
Supply Zone: 2,830.57 (Highs above TP3)
Bullish targets identified at:
2,837 (TP2)
2,856 (TP3) for extended upward momentum.
Support Levels:
Immediate support: GOLDTURN levels at 2,813
Additional supports:
2,803
2,793
2,783
2,774
Retracement range: 2,732–2,740
EMA Analysis:
The EMA5 (2,815.20) is a key pivot zone, indicating short-term trends:
A break and hold above 2,817 it suggests continuation of bullish momentum.
A break below it signals a possible test of support levels.
Trend Analysis:
Current candles reflect a potential pullback to the 2,813 level.
A bullish continuation above 2,817 could confirm upward momentum toward 2,837 and beyond.
A failure to hold above 2,813 may test lower GOLDTURN levels.
Trading Plan:
Bullish Strategy:
Monitor EMA5 crossing and holding above 2,817 for:
Immediate targets: 2,837, followed by 2,856.
Buy dips at support levels (2,813, 2,803, 2,793) targeting 30–40 pip gains.
Bearish Risks:
Downside triggers include:
EMA5 crossing below 2,817 leading to a test of 2,798.
Sustained moves below 2,798 may target 2,744 and 2,732–2,740.
Range Confirmation:
Await confirmation through a break and lock above/below key levels:
Bullish continuation: Above 2,837.
Bearish momentum: Below 2,813.
Long-Term Outlook
The bullish bias remains intact, with pullbacks offering opportunities to accumulate positions.
Focus remains on risk management by entering at support levels and exiting at predefined targets (20–40 pips per level).
Final Thoughts
Confidence and discipline are essential to navigate market fluctuations effectively.
This structured approach ensures traders are prepared for both bullish and bearish scenarios.
Check out further updates and multi-timeframe for more insights!
Please support us by liking, comments and boosting if you think our analysis is worth it.
The Quantum Trading Mastery

XAUUSD Enters a new High Time Frame RangeThe price of gold had a convicting weekly close into the new high time frame range of 2775-2935.
With fundamentals currently driving the prices of gold higher and the technical levels achieved it only makes sense for gold to continue its bullish trajectory. Price is strongly moving in an upwards channel.
A pullback to 2765-2784 zone to retest this breakout into this new range can bring a great entry point to go long but when analysing previous range breaks can not be guaranteed and price can continue from current levels. Deep corrections are not needed to keep driving the prices of gold higher as clearly seen on my chart.
Mid ranges are always magnets and this will be my first area of interest.
Good luck

Weekly CLS, KL , OB MP, Model 2Weekly CLS, KL , OB MP, Model 2
you are welcome to comment with your thoughts and share your charts or questions below, I like any constructive discussion.
What is CLS?
This company is trading for the biggest investment banks and central banks. They trade over 6.5 trillion daily volume. They are smart money of the all markets.
CLS operates in the specific times which will give you huge advantage and precisions to you entries. Focus on that. Its accuracy is amazing.
Good luck and I hope this educational post helps to become better trader
“Adapt what is useful, reject what is useless, and add what is specifically your own.”
Dave FX Hunter ⚔

NASDAQ a look ahead...As the NASDAQ and other major U.S. Equity Indexes face the pressure of economic uncertainty, the price action between days show that investors are not quite convinced this bull run has seen its finish line. However, we shouldn't only be looking toward private investor sentiment, but also that of the Federal Reserve's presence in the market and how the bond market reflects the Fed's position moving forward.
As shown here, the all time high for the TVC:NDQ is $22,133.22. Our position is that the NASDAQ must reclaim, retest, and continue beyond the all time high in order for us to continue our confirmation on the bull run. The path described should look as shown below...
In this instance, we can assume the bull run should continue. However, we should also be prepared for an alternate scenario where investors leave risk assets behind to chase non-risk assets (bonds for example). This scenario would look as shown below.
All though these are not the only two possible scenarios, we can most likely expect the future to play out in a similar fashion as the examples.
As for the market metrics to keep an eye on, look to TVC:US10Y for any bond yield manipulation, FRED:RRPONTSYD for market liquidity metrics, and FRED:M1V for M1 money velocity. Furthermore, keep an eye on tariffs for consumer tech ( NASDAQ:AAPL , NASDAQ:NVDA , NYSE:TSM ) and military activity ( NYSE:LMT , NYSE:RTX , NYSE:NOC ). Lastly, keep an eye on the banking and financial sector for more than likely banking deregulations withing the coming years.

Next bull: HennessyHennessy is a provider of different funds. The top funds have a 5-star rating from morningstar.
Technical:
(+) textbook chart pattern (price and volume)
(+) consolidation around 12$ on low volume
(+) low float
(-) very low volume
Fundamental:
(+) Good EPS increase due to a rise in the assets under management (live tracker on homepage :-)
(+) Asset under managemtn is currently 4.9 bln, up from 4.6 from september '24
(+) high insider coverage
(+) low short interest.
Buy: ~ 12 $
SL: ~ 11$
Sell: ~ 18$ (50% increase)
--> quarterly report in two days. Could be interesting to enter before. Expect minimum 0,30 EPS, but hope for more due to more assets under mgmt.
Beware, this is really a tiny company.

Long Usd/jpyI am deciding to Long USD/JPY because i am justing following the channel, its currently ranging downward and has hit the third point on the channel thats my reason lets discuss

BTC Fair Value OfferHere we have a FVG (Gray Box) with an overlapping PD Array in the form of a Short Term Low (White Line). I am waiting for entry confirmation which will be a Bearish Fair Value Gap in between timeframes 3-5 Minutes or higher. My Target is $95,285.22.

WIF/USDT Elliott Wave C Analysis1️⃣ Fibonacci Targets for Wave C Completion
Wave C in an ABC correction typically extends to key Fibonacci levels derived from Wave A:
1.000 Fib Extension (~$2.851) → Most common Wave C completion target.
1.236 Fib Extension (~$4.049) → Stronger bearish momentum may push towards this level.
1.382 Fib Extension (~$5.031) → Overextended correction possibility.
1.618 Fib Extension (~$6.144) → Rare but possible deep Wave C completion.
📌 Interpretation: These levels represent potential Wave C termination zones where price might find support before transitioning into a new wave structure.
2️⃣ Fibonacci Retracement Levels for Wave C Support Zones
If the downward correction deepens, these retracement levels act as critical support:
0.618 Fib Retracement (~$0.614) – First deep corrective support, price may attempt a bounce here.
1.236 Fib Retracement (~$0.723) – Key structure validation level, break below signals further downside.
1.382 Fib Retracement (~$0.579) – Final support zone before significant breakdown risk.
📌 Interpretation: A rebound from these levels would support Wave C completion, whereas failure to hold them could indicate prolonged bearish pressure.
3️⃣ Elliott Wave Structure & Wave C Confirmation
Bullish Reversal Conditions
For Wave C to complete and initiate a reversal, the following must happen:
Price must break above the 1.000 Fib Extension ($2.851) to signal bullish intent.
Volume confirmation: A significant increase in buying volume at key support levels.
MACD bullish crossover on mid to high timeframes (1D/4H).
Bearish Risk Factors
Failure to hold $0.614 → Signals continued bearish control.
MACD remains bearish → No confirmation of trend reversal.
No breakout above $2.851 → Suggests deeper downside risk.
📌 Key Reversal Confirmation:
✅ Break above $2.851 → End of Wave C, potential trend shift.
❌ Close below $0.579 → Signals extended correction or potential new bearish trend.
4️⃣ Why Wave 5 is Unlikely
A potential Wave 5 scenario would require:
A break above $4.880 (prior resistance) to confirm a new bullish impulse.
Strong volume and momentum continuation beyond $5.551, $8.43, and $15.347.
📌 Low Probability Factors for Wave 5:
Lack of impulsive wave structure beyond Wave C extension.
Price structure still following corrective ABC movement.
No clear wave formation beyond the corrective phase.
🚨 Conclusion:
Wave 5 is not highly likely unless a breakout above $4.880 occurs, triggering further impulse movement.
5️⃣ Conclusion & Trade Considerations
✅ Primary Scenario (Wave C Completion)
Wave C Targets: $2.851, $4.049, $5.031, $6.144.
Support Zones: $0.614, $0.723, $0.579.
Reversal Confirmation: Break above $2.851 needed to validate end of correction.
❌ Low Probability Scenario (Wave 5)
Invalid unless $4.880 breaks with volume.
Target zones for Wave 5: $5.551, $8.43, $15.347.
Failure to break key levels = no wave 5.
📌 Trade Strategy Considerations:
Look for long entries near Wave C completion zones ($2.851 - $0.614).
Monitor volume & RSI for bullish divergence before confirming trades.
Avoid premature entries until clear reversal signs emerge.

XAUUSD triangleXAUUSD triangles usually form on Wave 5 of a pattern indicating correcting move. Exercise caution.
US 100 NEXT MOVEbuy after bullish candle stick pattern, Sell after bearish candle stick pattern
Best bullish pattern , engulfing candle or green hammer
Best bearish pattern , engulfing candle or red shooting star
Stop lost before pattern
R/R 1/3

GOLD 4H TECHNICAL ANALYSIS GOLD ATH / READ CAPTION CAREFULLY Dear Traders,
Please find our updated analysis of the 4H Chart (5th February):
Key Observations:
Orange Circles: Highlight previously achieved targets, showcasing the precision and effectiveness of our analysis.
Previous Chart Review:
TP1 (2788): Successfully hit.
TP2 (2815): Successfully hit.
TP3 (2841): Successfully hit.
Market Overview:
* TP1 (2850) Successfully Achieved
* GOLD is trading at an ATH of 2851, oscillating between the weighted level with a gap above 2850 and a gap below the 2823 Entry Level.
* EMA5 and FVG are offering strong support in this range.
* Price action will test these levels side-by-side until a decisive break and lock above/below the weighted levels confirm the next directional move.
Resistance Levels:
2850, 2876, 2903
Key Support: 2776
Support Levels (GOLDTURN Levels):
2828 (Critical Weighted Level)
2803 (Critical Weighted Level)
2776 (Major Support Level)
2747 (Lower Major Demand Zone)
EMA5 (Red Line):
* Currently below TP1 (2850), indicating sustained bullish momentum.
* EMA5’s behavior will be pivotal in determining the next price action trajectory.
Recommendations
* Focus on EMA5 Behavior:
Bearish Case:
* If EMA5 holds below TP1 (2850) and resistance levels remain intact, bearish momentum may drive prices to retest GOLDTURN weighted levels.
* Scenario 1: If EMA5 crosses and locks below Entry 2823, expect further bearish movement toward GOLDTURN 2803.
* Scenario 2: If EMA5 crosses and locks below GOLDTURN 2803, anticipate another decline toward the major support at GOLDTURN 2776.
Bullish Case:
Scenario 1: If EMA5 crosses and locks above TP1 (2850), the next bullish target is 2876.
Scenario 2: If EMA5 crosses and locks above TP2 (2876), the subsequent bullish target will be 2903.
Scenario 3: A crossover and lock above TP3 (2903) will set the stage for the next target at 2925.
Short-Term:
Utilize 1H and 4H timeframes to capture pullbacks at GOLDTURN levels.
Target 30–40 pips per trade, focusing on shorter positions in this range-bound market.
Each Level allows 30 -40 pips bounce, buy at dip level for proper risk management
Long-Term Outlook:
* Maintain a bullish bias, viewing pullbacks as buying opportunities.
* Buying dips from key levels ensures better risk management, avoiding the pitfalls of chasing tops.
Final Thoughts:
Trade with confidence and discipline. Our detailed and accurate analysis equips you to navigate market movements effectively. Stay tuned for daily updates and multi-timeframe insights to stay ahead in the game.
Please support us by likes, comments, boosts and following our channel
Best regards,
📉💰 The Quantum Trading Mastery

Falling towards overlap support?GBP/AUD is falling towards the support level which is an overlap support that is slightly above the 50% Fibonacci retracement and could bounce frm this level to our take profit.
Entry: 1.9897
Why we like it:
There is an overlap support level that is slightly above the 50% Fibonacci retracement.
Stop loss: 1.9769
Why we like it:
There is a pullback support level that is slightly above the 161.8% Fibonacci extension.
Take profit: 2.0083
Why we like it:
There is a pullback resistance.
Enjoying your TradingView experience? Review us!
Please be advised that the information presented on TradingView is provided to Vantage (‘Vantage Global Limited’, ‘we’) by a third-party provider (‘Everest Fortune Group’). Please be reminded that you are solely responsible for the trading decisions on your account. There is a very high degree of risk involved in trading. Any information and/or content is intended entirely for research, educational and informational purposes only and does not constitute investment or consultation advice or investment strategy. The information is not tailored to the investment needs of any specific person and therefore does not involve a consideration of any of the investment objectives, financial situation or needs of any viewer that may receive it. Kindly also note that past performance is not a reliable indicator of future results. Actual results may differ materially from those anticipated in forward-looking or past performance statements. We assume no liability as to the accuracy or completeness of any of the information and/or content provided herein and the Company cannot be held responsible for any omission, mistake nor for any loss or damage including without limitation to any loss of profit which may arise from reliance on any information supplied by Everest Fortune Group.

GBP/CAD Reversal Play: Riding the Support Zone to Triple TPIn this setup, I identified a strong support zone on the GBP/CAD 4-hour chart, marked in green. The price action tested this support multiple times, confirming its validity. Observing the bullish rejection wicks and the consolidation around this level, I anticipated a potential reversal.
I entered a long position at 1.78902, just above the support zone, ensuring a safe entry with confirmation of bullish momentum. My stop loss is placed slightly below the support at 1.77866 to protect against a false breakout while giving the trade enough breathing room.
For my take profit strategy, I set three target levels aligned with key resistance points:
Take Profit 1 at 1.79635 – This is the first resistance level, providing a conservative target.
Take Profit 2 at 1.79966 – A mid-level resistance, offering a balanced risk-reward ratio.
Take Profit 3 at 1.80379 – Targeting the upper resistance, maximizing potential gains if the bullish trend continues. OANDA:GBPCAD OANDA:GBPCAD

#XAUUSD (GOLD) READY FOR SELL NOW OR AGAIN BUY FOR NEW ATH ?Hello Everyone Here is My Today's #XAUUSD (GOLD) Market Analysis
Please Check & Share Your Kind Opinions in the Comments section. Thanks! 🙏
Today on Monday 03 February 2025
#Gold Current Price is $2786 with Key ( Pivot Point: $2795 )
📉Bearish Scenario: #Gold is currently trading below the Pivot point ($2795) which suggests a bearish outlook.
📉First Support Targets: 2780 / 2770
If Gold continues below the pivot point it could further test the demand Zone at ( $2760 $2750, and $2740 )
📊Key Action : If the H4 candle closes below the pivot point ( $2795 ) consider a sell position targeting the support levels mentioned.
A break below $2760 would indicate further downside potential pushing Gold into the lower support levels.
📈Bullish Scenario: #Gold can maintain a bullish trend as long as it remains above the pivot point ( $2795 )
📈First Resistance Targets: $2808 / $2817
If #Gold successfully breaks above $2800 we may see a continuation towards higher resistance levels.
📊Key Action: If the H4 candle closes above the pivot point ( $2795 ) and the price crosses $2800 this could signal a potential #Buy position with targets at $2831 \$2842
A sustained close above $2800 would confirm the bullish momentum and open up further upside opportunities.
📊Key Levels:
📊Pivot Point: $2795
📉Support Targets $2780 / $2770
📉Target1) $2760
📉Target2) $2750
📉Target3) $2740
📉Target4) $2730
📉Demand Zone : 2726/2612
📈Resistance Targets: $2808 / $2817
📈New ATH : $2831 / $2841
📊Trend Outlook:
📈Bullish above : $2795 / $2800
📉Bearish below : $2795 / $2780
If you like my analysis, Don’t forget to Like, Follow & Comment


Bitcoin long to retest $102600 then dumpJust opened a bitcoin long. I anticipate the market will push back up to test 102600 area then start to dump back down.

ANOTHER MAKE or BREAK area for NIFTY…?NIFTY has rallied over 1000++ points from our demand zone and has now reached another MAKE or BREAK level trendline which has been acting as a crucial zone hence we may see rejection around this trendline if opens flat but will eventually breakout for new highs so plan your trades accordingly.

XAU/USD Short Trade for swing tradersThe market is reaching an all-time high every day. According to the analysis, we should see a good corrective move in the coming days.
From our previous analysis, we gained almost 200 pips from 2830 to 2808. Now, we are planning a swing sell trade with a 1-5 risk-reward ratio; if this trade fails, we will plan the next swing trade with a 1-8 risk-reward ratio.
you are all kindly requested to follow proper risk management to follow these analyses and execute the provided trades.

SOL updated analysisAfter the massive push up for SOL after the TRUMP coin caused huge volumes on SOL network, SOL has now come right back to support as seen on left chart where price reacted off the green vwap line and the green trendline.
The right chart shows how the 260usd blue line is major resistance. Price currently trying to reclaim the purple npoc.
So, now what?
Well, as a smart trader you always have 2 scenarios, up or down.
If SOL can reclaim the light green vwap line above price on left chart this could be a nice v shape recovery move playing out. 260usd is where we will know if bull run is resuming once SOL closes above this level.
If SOL loses the green vwap line below price then SOL could go as low as the next green vwap line at 154usd.
Smash that like button!

BTC SHORT TP:95,000 04-02-2025Btc short on a one-hour timeframe, with a take profit at 95,000. This should happen within 5 to 15 hours; otherwise, the analysis is invalidated.

Gold bulls mind side buy higher..As of February 5, 2025, gold prices have reached record highs, with spot gold trading at approximately $2,855.32 per ounce, and U.S. gold futures at $2,884.60. This surge is primarily driven by escalating trade tensions between the United States and China, leading investors to seek safe-haven assets.
Given the current market dynamics, your proposed trade strategy of buying gold at $2,860 with a take-profit (TP) level at $2,875 and a target of $2,930 aligns with the prevailing bullish sentiment. Analysts suggest that if the trade war escalates further, gold prices might reach $3,000.
Technical analysis indicates that gold remains bullish, with $2,800 as a key resistance level. A breakout above this level could target $3,000, while $2,700 and $2,600 serve as strong support levels.
However, it's essential to monitor the market closely, as geopolitical developments and economic data releases can significantly impact gold prices. For instance, upcoming employment reports may provide further insights into the U.S. economy, potentially influencing gold's trajectory.
In summary, your trading plan is consistent with current market analyses, but remain vigilant to adjust your strategy in response to new information.

Bitcoin and altcoin overview (February 05-06)Yesterday, Bitcoin reacted to the $99,200–$98,000 zone, but the reaction was insufficient for a full-fledged resumption of buying.
At the moment, on the 4H timeframe, we have not yet consolidated below this buy zone. The cumulative delta shows absorption of selling pressure.
We are considering two scenarios for a potential rebound:
Break and consolidation above the volume zone with a local trend shift, followed by a long entry on the retest (this scenario is marked on the chart).
Testing a more significant volume zone below.
Sell Zone:
$107,000–$109,000 (volume anomalies).
Buy Zones:
$99,200–$98,000 (aggressive volume push).
$95,000–$93,000 (volume anomalies).
$89,000–$86,300 (accumulated volumes).
Interesting Altcoins:
SWARM is showing early signs of a trend reversal with strong movement potential. If the $0.042–$0.037 zone is tested and reacts accordingly, we enter a long position.
