Order flow / Delta Volume Indicator (PAID)Order flow Delta Volume Indicator – Performance Update
Last week, I shared an analysis using the Order flow Delta Volume Indicator, and here’s this week’s performance update.
In the chart, the black line represents the VWAP, which helps in identifying the overall market trend. However, the key element of this indicator is the blue line—the Cumulative Delta Volume—which plays a crucial role in validating the trend’s strength.
How Does the Cumulative Delta Volume Work?
While VWAP signals the trend direction, the blue line (Cumulative Delta Volume) confirms whether the trend is genuine and strong or weak and deceptive:
✔ If the blue line moves in sync with price action, it indicates a strong, sustainable trend.
❌ If the blue line diverges from price action, it signals a potential trap—suggesting that the current price movement may not hold.
Additionally, green and red background are the volume imbalances highlight key moments of buyer and seller dominance.
Trading Signals & Strategy
• The indicator only generates buy signals when price is above VWAP and sell signals when below VWAP, ensuring directional accuracy.
• These signals provide a solid foundation for trading decisions, but profit-taking strategies are up to the trader, depending on whether they prefer long or short trades.
This tool remains one of the most effective ways to interpret market strength using Delta Volume. If you’d like to learn more or see it in action, feel free to reach out!
Thanks
Community ideas

USDJPY Will Go Up! Long!
Please, check our technical outlook for USDJPY.
Time Frame: 1D
Current Trend: Bullish
Sentiment: Oversold (based on 7-period RSI)
Forecast: Bullish
The market is testing a major horizontal structure 152.244.
Taking into consideration the structure & trend analysis, I believe that the market will reach 155.085 level soon.
P.S
The term oversold refers to a condition where an asset has traded lower in price and has the potential for a price bounce.
Overbought refers to market scenarios where the instrument is traded considerably higher than its fair value. Overvaluation is caused by market sentiments when there is positive news.
Like and subscribe and comment my ideas if you enjoy them!

BTC UPDATE !!!As for BTC update, it seems like we have completed the correction of wave 2.
If that cleared, then we can see major move up to 115k and then 130k.
Until then green box marked is the region for wave 2.
Invalidation of count is marked at below 91k.

BTC_USD Bitcoin price is currently in a Pump or Dump point (Do or Die situation).
As we can see can it's Consolidating in a symmetrical triangle with resistance above and Support below, with low volume.
Overall market trend is Bearish, Even though I'm still bias Bullish to the $100k zone, from what I can see, though no volume yet.
But let's see how price plays out.

EURUSD Feb, 2025Idiots from Black Sabbath are back on stage.
Everything poss then.
All currencies appearing in this post are fictitious. Any resemblance to real currencies, existing or dead, is purely coincidental.

BUY CHFJPY LONGGood day traders, hope you're having a profitable day, tune into this next move on EURJPY making a long, evident of a weak trend, a reversal is long overdue.
Check out our profile or our Instagram to join our free Telegram channel and learn more about this trade and gain access to exclusive features and updates.

Oil weekly forecast with key buy and sell levels Oil on the weekly with key levels and buy and sell suggestions.

USDJPY4HJPYUSD 4H Local Timeframe Analysis
On the 4-hour local timeframe, after clearing liquidity in the form of last month's low, I am considering a long position from the weekly order block. On the local timeframe, the entry is planned at the OTE level.
On the 1-hour timeframe, there is a shift in character (CHOCH), signaling a potential reversal. However, I am cautious as this shift may be false. A change in character often points to a possible market reversal, but confirmation is key.
Trade Plan:
This is a long-term trade, so we will manage risk carefully. The risk per trade is limited to 1% of the deposit, with the stop-loss placed beyond the boundary of the weekly order block.
Targets:
Target 1: 155.88This is a slightly challenging level as it contains an OTE zone, where a reversal is possible, though unlikely. Upon reaching this target, the stop-loss will be moved to breakeven, securing the trade.
Target 2: 156.75At this level, 30% of the position will be closed to lock in profits.
Final Target: 158.87This corresponds to the imbalance on the weekly timeframe. The position will be fully closed at this level.
Summary:
By following this plan, risk is minimized, and profits are strategically secured along the way. The long setup is based on higher timeframe confluences and potential price reversals indicated by changes in market structure.

Lululemon is Getting Sour. LULUThis is not a perfect harmonic, far from it. The AB bounce is quite high, although mostly in wick, and BCD is only 0.786 of XAB fibtime wise. Nonetheless, vWAP cross happened with the bearish engulfing and Ehlers UltraSmoother is resistant with down going gradient. Stoch/RSI and VZO flipped a while back and %PCT has been progressively dropping and will no doubt flip soon with that bearish candle.

EURUSD will Grow to TopHi traders what do you think about EURUSD suggestion in comments.
EUR/USD Price looking we're noticing a gap that's almost filled. now Price will Grow To Top.
Gaps can often act as key levels, Gap is nearing completion. Gaps typically get filled but now the price will break to the resistance.
Resistance we're suggesting that once the gap is filled, the price could face resistance at higher levels. we’ve identified two targets First Target: 1.04550 2nd Target 1.05220.
if you like this analysis please support my work and fallow thanks for Love.

check the trendIt is expected that after some fluctuation and correction, the upward trend will continue to form until the specified resistance level. Then there is a possibility of a trend change.
If the price crosses the resistance level, the upward trend will likely continue.

Shopify (SHOP) AnalysisCompany Overview:
Shopify NYSE:SHOP is a leading e-commerce platform that continues to grow by expanding into AI-driven solutions and fulfillment services, aiming to optimize merchant growth. Shopify is positioning itself as a major player in the e-commerce ecosystem, particularly with Shopify Plus, which is gaining momentum among large retailers.
Key Catalysts:
AI-Powered Tools for Merchants 🤖
Shopify is integrating AI-driven solutions to enhance marketing, inventory management, and checkout optimization, which improves merchant retention and adoption.
Enterprise Growth 📈
Shopify Plus is experiencing strong adoption among larger retailers, helping diversify revenue and reduce the company's reliance on small businesses. This supports more stable growth.
Long-Term E-commerce Growth 🌐
With e-commerce projected to grow at a 9.5% CAGR through 2030, Shopify holds a 10% market share in the U.S., positioning it for long-term growth in an expanding digital marketplace.
Financial Strength 💰
Free cash flow margin rose to 19%, underscoring Shopify’s robust financial health and ability to reinvest in future growth initiatives.
Investment Outlook:
Bullish Case: We are bullish on SHOP above the $102.00-$105.00 range, driven by AI expansion, growing enterprise adoption, and strong cash flow.
Upside Potential: Our price target is $170.00-$172.00, reflecting the company’s dominance in e-commerce and its ongoing innovations.
📢 Shopify—Shaping the Future of E-Commerce and AI. #Ecommerce #AIExpansion #SHOP

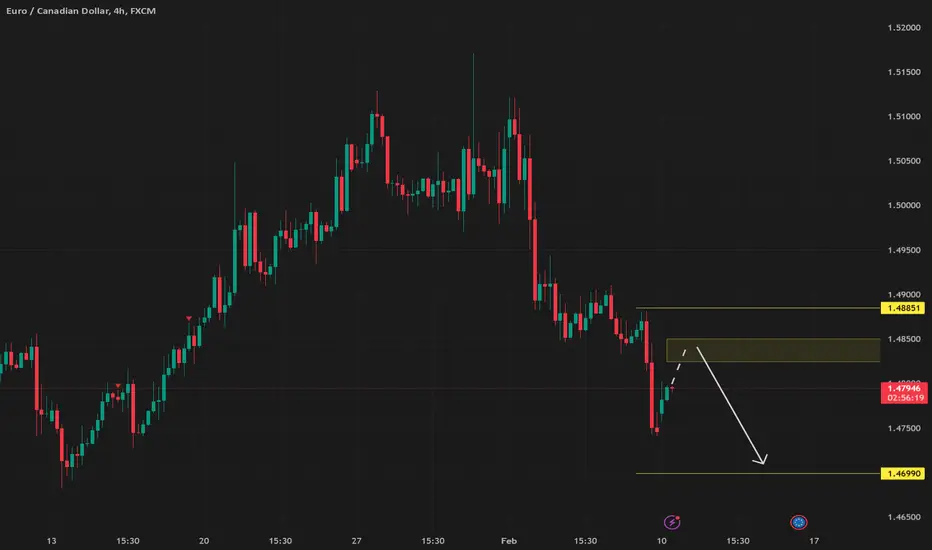
EURCAD Short from Premium Zone🔴 Type: Intraday Reversal Short
✅ Entry Zone: 1.4825-1.4850 (Bearish OB + Liquidity Pool).
✅ Stop Loss: 1.4875 (Above Institutional Order Block).
✅ Take Profits:
🎯 TP1: 1.4790 (First rejection point).
🎯 TP2: 1.4750 (Liquidity Grab Retest).
🎯 TP3: 1.4700 (Deeper Discount Zone).
✅ Confidence Level: HIGH (Multiple Smart Money Confluences).
📌 Execution Strategy:
✔ Wait for price to retrace into 1.4825-1.4850 zone.
✔ Look for rejection (bearish engulfing / wick rejections).
✔ Enter aggressively OR use a pending limit order.
AUDJPY sell limit AUDJPY making lower lows and lower highs. It is in down trend. There is no any divergence in RSI. So, We can place sell limit at Fib level 0.618

bnb buy midterm"🌟 Welcome to Golden Candle! 🌟
We're a team of 📈 passionate traders 📉 who love sharing our 🔍 technical analysis insights 🔎 with the TradingView community. 🌎
Our goal is to provide 💡 valuable perspectives 💡 on market trends and patterns, but 🚫 please note that our analyses are not intended as buy or sell recommendations. 🚫
Instead, they reflect our own 💭 personal attitudes and thoughts. 💭
Follow along and 📚 learn 📚 from our analyses! 📊💡"

XAUUSD.market target 2900 entry point 2884stop loss 2876Here is a concise update:
XAU/USD Gold Rate Update
Entry Point: $2,884
Target Price: $2,900
Stop Loss: $2,876
Gold price moving towards target. Monitor and adjust strategy as needed.

EUR/USD - Bearish Bias🔹 4H Timeframe:
• Still in a bearish structure → Major sell confirmations.
• Took out buy-side liquidity (BSL) and inducement (IDM) before mitigating a supply zone → Bearish intent remains.
🔹 30M Timeframe:
• Bearish structure confirmed, but price is forming a range inside the bearish structure.
• This range has built a bullish structure, likely a manipulation move to strike supply before continuing down.
• Took out SSL & IDM within the bullish structure → Tapped a bullish order block inside the range.
🔹 5M Timeframe:
• Waiting for a flip entry → CHoCH break of major LH + liquidity sweep before entry.
• Plan: If 5M confirms CHoCH + sweep + order block retest, I’ll enter for a continuation downward.
🎯 Target: Next major low inside the 4H bearish structure.
🛑 Invalidation: If price flips structure fully bullish and holds above supply zones.
Bless Trading!

PERPUSDT Trend AnalysisIf you want to add an stoploss simply buy above 0.3 and Sell below 0.3
Perpetual Protocol is a decentralized exchange (DEX) for futures on Ethereum and xDai. Traders can go long or short with up to 10X leverage on a growing number of assets like BTC, ETH, DOT, SNX, YFI and others. Trading is non-custodial, meaning traders always retain possession of their assets, and on-chain. Perpetual Protocol utilizes a virtual automated market maker (vAMM), which provides on-chain liquidity with predictable pricing set by constant product curves. Furthermore, Perpetual Protocol designed its vAMMs to be market-neutral and fully collateralized.

EUR/GBP - Bullish Bias🔹 4H Timeframe:
• Broke a major Higher High (HH) → Confirmed bullish structure.
• Engineered liquidity at an order block → Expecting a move higher.
🔹 30M Timeframe:
• CHoCH confirmed → Bullish intent established.
• Took out sell-side liquidity (SSL) and inducement (IDM) to mitigate a 30M order block.
• Plan: Looking for a bullish reaction from the 30M order block → Entry on confirmation for further upside continuation.
🎯 Target: Next major high.
🛑 Invalidation: If price breaks below internal structure lows.

Contracting triangle on XAUHi everyone
what are you doing this days?
After a strong bullish trend from 2780 to 2880 and completing two upward legs, we are now trapped in a contracting triangle.
The scenario I anticipate for the market's next move is marked in red: an upward push toward the identified resistance zone, followed by a drop to the lower trendline.
What do you think ? comment below
I hope you capture the best profits from the market!

EUR/AUD: Weekly Engulfing Bar Pullback!The recent performance of the EUR/AUD exchange rate shows a fluctuating trend, with a slight recovery, closing at approximately 1.6450 in the first week of February. In the preceding days, the rate experienced several declines, with a significant drop. These fluctuations reflect the economic dynamics of both the Eurozone and Australia. In the Eurozone, inflation unexpectedly rose to 2.5% in January, exceeding the European Central Bank’s 2% target for the third consecutive month. Despite this, the ECB plans to continue cutting interest rates, expecting inflation to reach its 2% target over the year. Meanwhile, the Eurozone economy showed no growth in the last quarter of 2024, with contractions in Germany and France and stagnation in Italy. In Australia, the leading economic indicators index increased by 0.2% in October 2024, suggesting a slight economic recovery. However, Australian Treasurer Jim Chalmers confirmed a worsening fiscal deficit, projected to rise by AUD 21.8 billion over the next four years, mainly due to unavoidable expenditures. These economic developments impact the EUR/AUD exchange rate, with the Euro benefiting from a more accommodative monetary policy while Australia faces fiscal challenges. Despite the recent upward movement, the negative trends from previous sessions and technical analysis suggest caution is warranted when assessing the short-term trajectory of the EUR/AUD exchange rate.

EURUSD WILL BE GOING MORE DOWN BE READY.Based on some ML in the works EUR/USD is moving directly to target 1.02091.

