EURUSD London MacroEURUSD
Feb 4
First presented FVG at 2 macro in the MOG in a discount knowing intra day. Equal highs in two places to take profits.
the equal lows were taken, you cant more clear than this. Such clean price action and the model builds its self.
Community ideas

Downtrend #BUZZUSDT📉 SHORT BYBIT:BUZZUSDT.P from $0.02640
🛡 Stop Loss: $0.03010
⏱ 1H Timeframe
✅ Overview:
➡️ BYBIT:BUZZUSDT.P is in a strong downtrend, consistently forming new lower lows. The price continues to decline after rejecting $0.03584 (POC), confirming seller dominance.
➡️ The price is currently testing the $0.02700 support level, but given the overall trend, a further breakdown is likely.
➡️ If the $0.02640 level is broken and the price holds below it, a continuation toward $0.01999 is expected.
➡️ Volume is decreasing, indicating weak buyer support and a high probability of further downside.
⚡ Plan:
📉 Bearish Scenario:
➡️ Enter SHORT from $0.02640 if price confirms a breakdown.
➡️ Risk management with Stop-Loss at $0.03010, above the nearest resistance zone.
🎯 TP Target:
💎 TP1: $0.01999 — strong support and profit-taking zone.
🚀 BYBIT:BUZZUSDT.P Expecting a continuation of the downtrend!
📢 BYBIT:BUZZUSDT.P remains under selling pressure, and if the price breaks below $0.02640, further downside movement is likely.
📢 However, if the price reclaims $0.03010, the bearish scenario could be invalidated, leading to a potential bullish correction.

GBPUSDIn today’s trading session, GBP/USD appears to have limited volatility and is trading around the 1.242 region, supported by an upward trendline on the 4H chart. The US Dollar (USD) remains resilient against its peers as investors stay cautious ahead of the key Non-Farm Payrolls (NFP) data from the United States. This has limited GBP/USD’s upward momentum. However, despite the reaction to this information, GBP/USD has managed to avoid a deep decline and has found some opportunities to move higher.
On Wednesday, disappointing ISM Services PMI data weighed on the US Dollar (USD), making it harder for the currency to attract demand. Additionally, bullish movements in the US equity markets added further pressure on the USD, allowing GBP/USD to maintain its upward stance.

FTTUSDT 1D#FTT is moving within a falling wedge pattern on the daily chart. Wait for a breakout to confirm a bullish signal. In case of a breakout, the targets are:
🎯 $2.1113
🎯 $2.4743
🎯 $2.8963
🎯 $3.2373
🎯 $3.5783
🎯 $4.0638
🎯 $4.6823

GOLD - $3,000 is a Magnet!Hello TradingView Family / Fellow Traders. This is Richard, also known as theSignalyst.
📈 After recording a new all-time high this week, GOLD has been surging in a parabolic manner.
🎯 Next target? The $3,000 round number is lining up perfectly with the upper bound of the rising channel marked in red.
🏹Meanwhile , every bearish correction would be an opportunity to look for trend-following longs, targeting the $3,000 mark.
📚 Always follow your trading plan regarding entry, risk management, and trade management.
Good luck!
All Strategies Are Good; If Managed Properly!
~Rich
Disclosure: I am part of Trade Nation's Influencer program and receive a monthly fee for using their TradingView charts in my analysis.

NATGAS Massive Long! BUY!
My dear friends,
My technical analysis for NATGAS is below:
The market is trading on 3.072 pivot level.
Bias - Bullish
Technical Indicators: Both Super Trend & Pivot HL indicate a highly probable Bullish continuation.
Target - 3.428
Recommended Stop Loss - 2.914
About Used Indicators:
A pivot point is a technical analysis indicator, or calculations, used to determine the overall trend of the market over different time frames.
———————————
WISH YOU ALL LUCK

BTC history classso i am not so good in teaching yk but will do my best!
if we take our 1week tf, we can see that BTC has broken its resistance fro m 2021/2024
now what can we expect from it?
well litteraly the same as it always does> it will most likely bounce back to this res using it as strong support, not to forget the weekly fvg laying exactly at that support.
but what should our targets be?
that is a great question, BTC will either repeat the same percentage as the previous weekly fvg made that would be 120% or it will create a new channel of 4 years making new (small) ATH
short:
entry: now
target: 73k
profit:24%
Long:
entry:75k
Target: 112k
Possible target: 160k
profit: 49% - 115%


Gold Spot Opening Bell On 14th Feb🥇 XAUUSD (Gold) remains bullish above 2790, with potential pullbacks to watch for buying opportunities.

Ichimoku Theories - Complicated? Keep it SimpleNYMEX:CL1!
The Ichimoku Strategy is a technical analysis method using the Ichimoku Kinko Hyo indicator, which helps traders identify trends, support/resistance levels, and potential trade signals. It consists of five key components:
Ichimoku Indicator Components:
1. Tenkan-sen (Conversion Line): (9-period moving average)
• Short-term trend indicator.
• A sharp slope suggests strong momentum.
2. Kijun-sen (Base Line): (26-period moving average)
• Medium-term trend indicator.
• Acts as a support/resistance level.
3. Senkou Span A (Leading Span A): ((Tenkan-sen + Kijun-sen) / 2, plotted 26 periods ahead)
• Forms one edge of the Kumo (Cloud).
• A rising Span A suggests an uptrend.
4. Senkou Span B (Leading Span B): (52-period moving average, plotted 26 periods ahead)
• The second edge of the Kumo (Cloud).
• When Span A is above Span B, the cloud is bullish (green); when Span A is below Span B, it’s bearish (red).
5. Chikou Span (Lagging Span): (Closing price plotted 26 periods behind)
• Confirms trend direction.
• If Chikou Span is above past prices, it signals bullish momentum.
Trading Strategies Using Ichimoku
1. Kumo Breakout Strategy
• Buy when the price breaks above the Kumo (Cloud).
• Sell when the price breaks below the Kumo.
2. Tenkan-Kijun Cross Strategy
• Bullish signal: Tenkan-sen crosses above Kijun-sen.
• Bearish signal: Tenkan-sen crosses below Kijun-sen.
3. Chikou Span Confirmation
• Buy when Chikou Span is above past price action.
• Sell when Chikou Span is below past price action.
4. Kumo Twist
• When Senkou Span A crosses above Senkou Span B, it signals a potential bullish reversal.
• When Senkou Span A crosses below Senkou Span B, it suggests a bearish reversal.
5. Trend Confirmation
• Price above the cloud = bullish trend.
• Price inside the cloud = consolidation.
• Price below the cloud = bearish trend.
Advantages of Ichimoku Strategy
✅ Provides a comprehensive market view (trend, momentum, support/resistance).
✅ Works well in trending markets.
✅ Offers clear entry and exit signals.
Limitations
❌ Less effective in ranging or choppy markets.
❌ Can be complex for beginners.
❌ Requires confirmation with other indicators (e.g., RSI, MACD).
Trade Smart - Trade Safe 🚀

GBPJPY Bearish Continuation Expected
🔹 Current Price: 188.362
🔹 Key Resistance Levels:
188.998 - 189.141 (Short-term resistance)
190.068 - 190.599 (Major resistance)
🔹 Key Support Levels:
187.694 (Break & retest zone)
186.922 (Next target)
186.488 (Major support)
🔹 Market Outlook:
Price is rejecting from resistance and forming a bearish structure.
A break below 187.694 could confirm further downside.
If price retraces towards 188.998 - 189.141, look for rejections to enter shorts.
🔹 Trade Setup:
✅ Sell Zone: 188.998 - 189.141
✅ Target: 186.922 - 186.488
✅ Invalidation: Above 190.068

ETHUSDRemember my ETH short bias from 5 months ago? Despite it pushing up a little, price has remained within the trendlines & bearish channel, keeping its main trend in a 'downtrend'.
We are still within a 3 Sub-Wave (A,B,C) corrective channel, with the current bearish move down being Wave C. Wave C target still remains around $786

GOLD MONTHLY LONG TERM RANGE ROUTE MAP ANALYSISMonthly Chart Gold (9th Feb 2024)
Dear Traders,
Attached is the updated Monthly Chart Roadmap for GOLD, showcasing our meticulous analysis and 100% target accuracy since October 2023. The Golden Circle areas on the chart emphasize our precise predictions and successful target achievements over the months.
Previous Chart Highlights:
* GOLD successfully hit TP1 (2286.35) and TP2 (2603.46), with the monthly candle closing above TP2.
* EMA5 crossed and locked above the TP2 level at 2603.46, confirming strong upward momentum.
* The EMA5 detachment process was successfully completed.
* The Fair Value Gap (FVG) at 2790 provided robust support, facilitating a push toward higher levels.
What’s Next for GOLD?
This chart update includes revised entry levels, weighted target levels, and two critical GOLDTURN levels: 2742 and 2595. These levels act as strong support zones, where potential reversals may occur. If a reversal happens, prices are likely to retest any of these levels (marked in red) before bouncing back.
Pay close attention to EMA5 near the Entry Level of 2742.55. If EMA5 crosses and locks above 2742.55, it will confirm bullish momentum and make the target of TP1 (2961) achievable with ease. Although short-term bearish movements may occur, the broader picture on the monthly chart suggests a long-term bullish trend. Temporary pullbacks strengthen the trend and provide excellent dip-buying opportunities near support levels, minimizing risk.
Recommendations:
For a detailed understanding of support structures and to identify ideal buying opportunities, refer to our smaller time frame analyses, including weekly, daily, 12H, 4H, and 1H charts. These provide actionable insights while aligning with the bigger picture of long-term bullish momentum.
As always, we’re committed to keeping you informed with daily updates and insights. Don’t forget to show your support by liking, commenting, and sharing this post. Stay tuned for more updates on our Trading View channel.
Trade Safe with Confidence!
The Quantum Trading Mastery

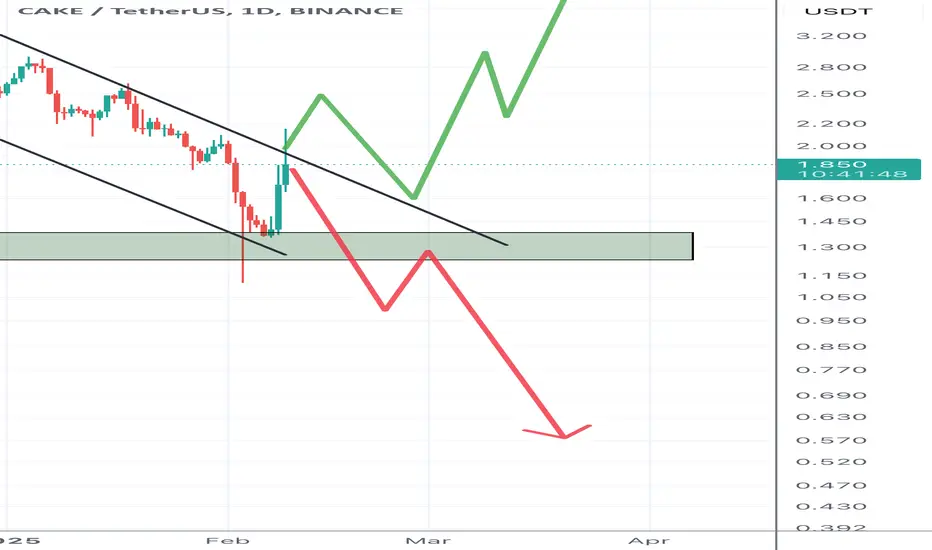
Cakeusdt prisoned in trading rangeEither of this path is possible depending on which line meet a breakout with pullback but 60% scenario is for long
BTC DTFCurrently, Bitcoin is in an uptrend, but a correction may occur soon. There is a possibility that the price will drop to $86,000 as a correction before resuming the upward movement. If selling pressure continues, we might see further declines, but as long as the price holds this level, it could bounce back up. It is advisable to monitor price action and manage risks carefully.

I am Amazed how XAU/USD Gold moving in a channel of 18 degrees. FX:XAUUSD COMEX:GC1! I am amazed by how XAU/USD Gold is moving in a channel of 18 degrees on hourly chart. I am a student of market geometry and how often we see such a clear trend, really fascinating! The scenario here is clear just trade the bounce off of the lower channels and we will only be short if market breaks below lowest band on this chart until then we are bullish. Keep your first targets @ upper band. Keep following for more ideas.


US30 Bearish Bias!
HI,Traders !
US30 made a bearish
Breakout of the key
Horizontal level of 44620.76
Which is now a resistance
And we will be expecting
A further move down After
retesting broken level !
Comment and subscribe to help us grow !

Sell usdcadStrong selling pressure weekly and daily bearish confirmation
Monthly sell setup
Monthly overbought zone


**ICT Analysis for Gold Spot / U.S. Dollar (4-hour Chart)**Certainly! Here is the analysis of the chart in English, focusing on the ICT (Intraday Cycle Theory) perspective and addressing the potential for a drop below 2850:
---
**ICT Analysis for Gold Spot / U.S. Dollar (4-hour Chart)**
From an ICT standpoint, the current price action suggests a critical juncture. The recent rally has brought the price to a significant resistance level around 2861.25 USD. This level coincides with a key Fibonacci retracement and a previous swing high, making it a crucial point to watch.
### Key Observations:
1. **Cycle Highs and Lows**: The price has been oscillating within a defined cycle, with recent highs and lows forming a pattern that could be indicative of a potential reversal. The current price is near the upper boundary of this cycle.
2. **Fibonacci Levels**: The price has reached a major Fibonacci resistance level, which often acts as a strong barrier. A failure to break above this level could lead to a pullback.
3. **Momentum Indicators**: While not explicitly shown, momentum indicators like RSI or MACD would be useful here. If these indicators show divergence (i.e., price making higher highs while the indicator makes lower highs), it could signal a loss of upward momentum.
### Potential Scenarios:
- **Scenario 1: Breakout Above 2861.25**: If the price manages to sustainably close above this level, it could indicate a continuation of the uptrend. However, this scenario seems less likely given the strong resistance at this level.
- **Scenario 2: Rejection at 2861.25**: If the price fails to break above 2861.25 and starts to decline, it could signal the start of a correction. In this case, the next key support levels to watch are around 2850 and then lower levels such as 2780 and 2720.
### Conclusion:
Given the current setup, there is a significant risk of a pullback if the price fails to break above 2861.25. If the price drops below 2850, it could trigger a more substantial correction, potentially leading to further declines towards the lower support levels mentioned.
Traders should remain cautious and consider placing protective stops below 2850 to manage risk effectively. Additionally, monitoring volume and other technical indicators can provide further confirmation of the direction of the trend.
---
This analysis should help you understand the potential risks and opportunities in the current market situation.

Road Map GPBUSD, USD still strong...Will GBPUSD test the 1.94?Here I do an analysis based on price action, based on yesterday's data regarding the NFP news, it seems that the USD will still strengthen not only next week, but for this month and next month, seen from the price response to the existing price limits. I see that there is a chance that the price will return to the 1.94 area for the GPBUSD pair.

EURUSD BULLISH CONTINUE FROM 1.0200HEY there on 1HTF EURUSD looking for sell pressure from 1.03700 and continue go downside will touch 1.02500 and 1.02000 and then we could possibly seems bullish candle continue will touch higher high level 1.06000 and 1.07000
So good luck guys follow like and comment for more updates and analysis
