Community ideas

ICP Bounces from Strong Support: Bullish Reversal Ahead?FWB:ICP has bounced from a strong support zone around $6.5–$7.0, signalling a potential bullish reversal. This key demand area has historically supported price recoveries.
> $6.5–$7.0 range holding firm with strong buyer interest.
> Next hurdle is $9.4–$10.0; a breakout could target $12+.
> RSI is recovering from oversold levels, hinting at bullish momentum.
If ICP holds above support, an upward move is likely. A daily close below $6.5 may invalidate this outlook.
DYOR, NFA
#ICP #Crypto #Altcoins

Gold: heading toward the $3K?The sixth straight week of gains is behind the price of gold. Tariffs, uncertainty, geopolitics all bring uncertainty to investors, pushing the price of gold to higher grounds. The current uncertainty regarding trade tariffs which are or will be imposed on the US trading counterparts, especially China, is one big concern for market participants. As per currently available news on this topic, for the moment, tariffs on goods from Canada and Mexico will be delayed for one month. What will happen after, markets do not have a clue. As long as this topic is relevant, the price of gold might head further to the upside. Some analysts are currently predicting that the price of gold might reach the level of $3K in coming months. At the same time, news is coming from China, that the country will allow its insurance companies to hold gold as a long-term asset allocation. This implies further demand for the gold, supporting the potential for a $3K target.
During the week, the RSI reached the level of 74, implying a strongly overbought market side. Under normal market conditions, this would be an indication of a potential for a short term price reversal, however, as long as uncertainty holds, the indicator might continue to move within this territory. The moving average of 50 days is still strongly diverging from MA200, without any kind of indication of a potential cross in the near term period.
Technical analysis is suggesting also that the price of gold is headed toward the higher grounds. However, on this road, there might be some short reversal. The major historical support currently stands at $2.780. In case of a short reversal, this would be a point to watch. On the upside, the next target of gold could easily be $3K, if the line of price tops is followed from April 2024 and October 2024. This is all a longer-term picture of gold charts. For the week ahead, there is a possibility of a short reversal, however, the much higher probability lies with an uptrend.

Lingrid | EURUSD forming a Triangle Pattern. ShortFX:EURUSD continues to consolidate around 1.0300 level. Recently, the market gapped down again, but that gap has already been filled. Last week, the price declined following a news release, respecting the downward trendline and breaking below the 1.03500 level. Overall, the price is forming a triangle pattern, forming lower highs and higher lows. Given that the market has bounced off the upper boundary of the pattern, I anticipate it may retest the lower boundary. I expect the market to reject the resistance and subsequently retest last week's low. My goal is support zone around 1.02270
Traders, if you liked this idea or if you have your own opinion about it, write in the comments. I will be glad 👩💻

CAKE token of Puncakeswap is going to distribute higher 3XAfter making panic sell move and accumulating at least 1 week, asset probably will take an advantage and distribute at least in 5-7$ range which is minimum 3x

Gold Operation AnalysisToday, Monday, gold has once again hit a record high. As of now, gold has reached above the 2900 mark. Gold is currently maintaining a strong oscillating trend in the daily trend. The daily K-line continues to run along the short-term moving average. The price shows signs of gradually moving out of the high-level oscillation range. There is no sign of peaking in the daily trend. Today, it is extremely strong in a cyclical rise. In this kind of time-based transaction, price is not the key, but time is the key. At the same time, this rise is completely a forced short position, which is easy to rise but difficult to fall. Don't think about the short position. In addition, at this rhythm, even if the long position opens low in the morning, there is not much risk of retracement. Continue to look at the second rise.

BNB’s Correction Could Trigger a Major Move—Are You Ready ?Yello Paradisers! Have you been keeping an eye on #BNBUSDT? If not, now’s the time to focus. BNB is currently in a corrective phase after its recent surge, and this pullback could be setting up a major opportunity for those who know when to strike. But timing is everything, and jumping in too early could be a costly mistake.
💎Right now, we expect BNB to follow a flat zigzag correction pattern of Elliott Wave. The price action shows signs of an imbalance (IMB) and a change of character (CHOCH), suggesting that we might see a further dip before the bulls take over again. You can switch to lower timeframes, like the 15-minute chart, to get a clearer validation of the wave structure. The key here is to wait for a bullish divergence on the RSI and MACD, which will signal that the correction is nearing its end and a rebound is likely.
💎The bullish order block (OB) between $582 -$577 is the crucial demand zone to watch. We anticipate BNB dipping into this zone before finding strong support for a potential upward impulsive wave. However, if BNB closes below this order block, the setup becomes invalid, and we could see further downside toward $560. It’s essential to remain patient and disciplined rushing in without confirmation could lead to unnecessary losses.
💎Once we get the bullish divergence, we expect BNB to target the $643-$646 supply zone in the next move. This could be a sharp and profitable rally for those who wait for the right signals. But remember, if the price closes below the bullish OB, it’s time to step back and reassess. Protecting your capital is just as important as making profits.
Be patient, stay focused, and let the market come to you. That’s how you secure long-term success in this game.
MyCryptoParadise
iFeel the success🌴

GBP_JPY WILL FALL|SHORT|
✅GBP_JPY keps falling
In a downtrend and the
Pair made a bearish breakout
Of the 188.500 key level
So we are bearish biased
And we will be expecting
A further bearish continuation
SHORT🔥
✅Like and subscribe to never miss a new idea!✅

US CPI week for the DXY It has been a topsy turvy week for the dollar after the week opened with news of 25% tariffs on Mexico and Canada from the US as well as a 10% import duty on Chinese goods. The DXY spiked to a high of 109.9 before closing the week marginally lower at 108.1. The weaker than expected US NFP print however and surprisingly provided support for the DXY. This week’s price action is indicative that the ABC corrective wave has run its course and that another leg higher towards 112 is on the cards for the DXY.
The critical support range is the blue range between 107.2 and 107.5. As long as the DXY remains above this range and maintain levels above the 50-day MA at 107.8 there is nothing stopping the DXY from moving higher as the dollar milkshake theory continues to suck the DXY higher.
A break below 107.2 will however invalidate the idea and allow the DXY to drop onto the 200-day MA level of 104.8.
It is CPI week for the DXY and a stronger than expected CPI print will allow the DXY to regain its momentum and commence the start of another leg higher for the index. The US CPI print for January, which is expected to remain unchanged at 2.9%, just like it did back for the December print. Inflation has been ticking higher since October last year, almost right after the Fed started their cutting cycle and anything other than an inline or lower than expected CPI print will have the DXY packing and making its way to 110 and 112 thereafter since it will indicate that the Fed will stay higher for longer.

SILVER Risky Long! Buy!
Hello,Traders!
SILVER is making a local
Bearish correction but
Silver Is trading in an uptrend
So after the retest of the
Horizontal support below
At 31.58$ a local bullish
Rebound is to be expected
Buy!
Comment and subscribe to help us grow!
Check out other forecasts below too!

USDJPT after more range soon the fall can continue -750 pips fall happened as we mentioned before:
now we are looking for some range maybe and soon after that more -250pips fall to the next targets like red arrows on chart.
DISCLAIMER: ((trade based on your own decision))
<<press like👍 if you enjoy💚

DOLLAR INDEX (DXY): Bullish Rebound from Trend LineThe Dollar Index has approached a key upward trend line.
After a sharp decline, the market seems overbought, and the formation of a cup and handle pattern suggests weakening selling pressure.
A retracement to 108.80 is expected.

Dogusdt Double top: Will this breakdown or Hold? DOGUSDT is forming a potential double-top pattern, with price approaching the neckline zone, a critical level that will determine whether the pattern confirms or invalidates. The reaction at this level is key, as a strong hold could lead to a range-bound move, while a breakdown would signal further downside continuation.
The $0.001756 level remains the key invalidation point, with price action around this zone dictating the next major move. Targets for both bullish and bearish scenarios are outlined on the chart, providing key reference points for trade execution. Monitor closely for confirmation.

DeGRAM | GOLD formed a declining topGOLD is in a local descending channel between trend lines.
The price is moving from resistance at $2870 and the upper boundary of the channel.
The chart is holding in the channel and trying to form a descending top.
On large Timeframes the indicators indicate overbought.
We still expect a correction.
-------------------
Share your opinion in the comments and support the idea with a like. Thanks for your support!

GBPUSDI've outlined two scenarios for Monday—just basic ideas. Both are based on a continuation of the sell-off. I'll determine entry points in real-time tomorrow (if any opportunities arise, of course). I usually don’t try to predict the market, but on Sundays, it’s nice to reflect on potential next steps to be better prepared.
Tomorrow doesn’t bring any major news, so the market should provide a stable environment for trading.

SPX WEEKLY PRICE ACTION 10TH FEB 2025This is the price action of SPX at its very best & exclusively for viewers on trading view.
I have discussed in depth price action of SPX and if you have any doubts feel free to leave a message or your comments below.

EUR/AUD SETUP IS DOING GOOD LOOK HEREEur/Aud in one day managed to break the support zone and change the direction of the market to a downtrend. In the time frame of one hour we see a clear market structure to the downside as we see lower low and lower high bein formed. we trade with the trend so we'll be looking for sell opportunity after a pullback complete. trade safe hold this one


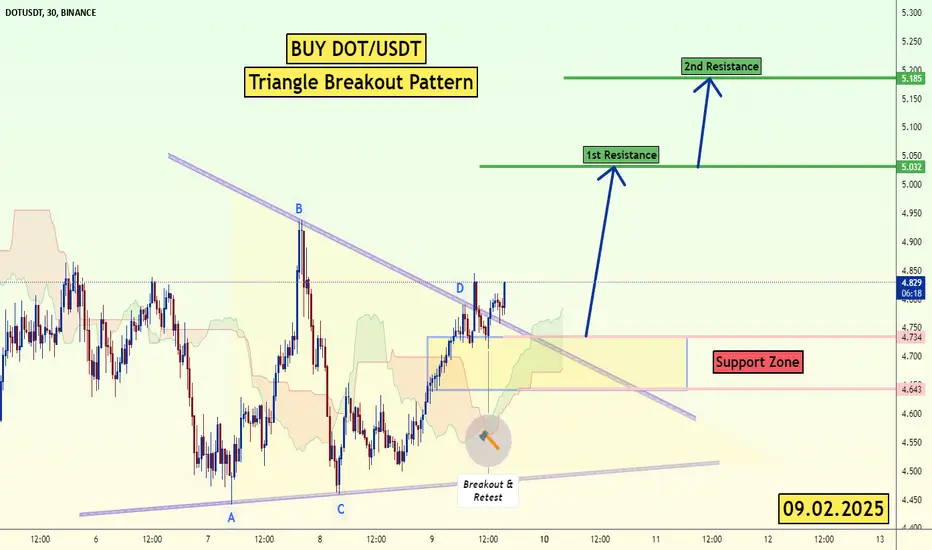
DOT/USDT Triangle Breakout (9.02.25)The DOT/USDT pair on the M30 timeframe presents a Potential Buying Opportunity due to a recent Formation of a Triangle Breakout Pattern. This suggests a shift in momentum towards the upside and a higher likelihood of further advances in the coming hours.
Possible Long Trade:
Entry: Consider Entering A Long Position around Trendline Of The Pattern.
Target Levels:
1st Resistance – 5.03
2nd Resistance – 5.18
🎁 Please hit the like button and
🎁 Leave a comment to support for My Post !
Your likes and comments are incredibly motivating and will encourage me to share more analysis with you.
Best Regards, KABHI_TA_TRADING
Thank you.
TON (telegram coin): is ready for an upward hello guys!
let's analyze TON!
Ton formed a head and shoulders pattern and broke the neckline!
The target of this pattern has already been achieved!
and the last candle touched the flip area too!
so there is no debt to a lower level for this coin! it is ready for an upward movement!

Fridays CLS, Key Level OB mid, Model 1Hey Traders !!
Feel free to share your thoughts, charts, and questions in the comments below—I'm about fostering constructive, positive discussions!
What is CLS?
CLS represents the "smart money" across all markets. It brings together the capital from the largest investment and central banks, boasting a daily volume of over 6.5 trillion.
By understanding how CLS operates—its specific modes and timings—you gain a powerful edge with more precise entries and well-defined targets.
Follow me and take a closer look at Models 1 and 2.
These models are key to unlocking the market's potential and can guide you toward smarter trading decisions.
Remember, no strategy offers a 100%-win rate—trading is a journey of constant learning and improvement. While our approaches often yield strong profits, occasional setbacks are part of the process. Embrace every experience as an opportunity to refine your skills and grow.
Wishing you continued success on your trading journey. May this educational post inspire you to become an even better trader!
“Adapt what is useful, reject what is useless, and add what is specifically your own.”
Dave Hunter ⚔

USD/JPY Approaches Demand Zone: A Contrarian Trading OpportunityThe USD/JPY currency pair is currently approaching a demand zone, prompting us to set a buy limit order in anticipation of a potential upward movement. This area is significant as it often indicates a point where buyers are likely to step in, which could lead to a reversal in price direction.
At the same time, the 6J1! futures contract has already made contact with the Supply zone. This zone is crucial for our analysis, as it represents levels where selling pressure typically emerges, potentially leading to a decrease in price. We are closely monitoring this situation and are looking for a possible retest of the Supply area. A successful retest could trigger a subsequent drop in prices, aligning with our trading strategy.
Interestingly, it’s worth noting that retail traders currently appear to be on the bullish side of the market, favoring an uptrend. This sentiment could create opportunities for us, as our strategy is to look for short positions despite the prevailing optimism in the retail sector. By carefully analyzing market dynamics and positioning ourselves accordingly, we aim to capitalize on potential price corrections when the market reaches key resistance levels.
In summary, we are preparing to take action in both the USD/JPY and 6J1! futures markets. We're setting up for a buy in the approaching Demand area while simultaneously positioning ourselves for a short trade should the 6J1! futures retest the Supply zone and exhibit signs of a downturn. This balanced approach takes into account the conflicting trader sentiments and aims to maximize potential profit opportunities.
✅ Please share your thoughts about USD/JPY in the comments section below and HIT LIKE if you appreciate my analysis. Don't forget to FOLLOW ME; you will help us a lot with this small contribution.

GBP_USD LONG RESULT Price moved, Consolidated, retraced and eventually moved exactly in our Direction and hit out TP exactly B4 major rejection just as predicted.
