USD/JPY Approaches Demand Zone: A Contrarian Trading OpportunityThe USD/JPY currency pair is currently approaching a demand zone, prompting us to set a buy limit order in anticipation of a potential upward movement. This area is significant as it often indicates a point where buyers are likely to step in, which could lead to a reversal in price direction.
At the same time, the 6J1! futures contract has already made contact with the Supply zone. This zone is crucial for our analysis, as it represents levels where selling pressure typically emerges, potentially leading to a decrease in price. We are closely monitoring this situation and are looking for a possible retest of the Supply area. A successful retest could trigger a subsequent drop in prices, aligning with our trading strategy.
Interestingly, it’s worth noting that retail traders currently appear to be on the bullish side of the market, favoring an uptrend. This sentiment could create opportunities for us, as our strategy is to look for short positions despite the prevailing optimism in the retail sector. By carefully analyzing market dynamics and positioning ourselves accordingly, we aim to capitalize on potential price corrections when the market reaches key resistance levels.
In summary, we are preparing to take action in both the USD/JPY and 6J1! futures markets. We're setting up for a buy in the approaching Demand area while simultaneously positioning ourselves for a short trade should the 6J1! futures retest the Supply zone and exhibit signs of a downturn. This balanced approach takes into account the conflicting trader sentiments and aims to maximize potential profit opportunities.
✅ Please share your thoughts about USD/JPY in the comments section below and HIT LIKE if you appreciate my analysis. Don't forget to FOLLOW ME; you will help us a lot with this small contribution.
Community ideas

Fridays CLS, Key Level OB mid, Model 1Hey Traders !!
Feel free to share your thoughts, charts, and questions in the comments below—I'm about fostering constructive, positive discussions!
What is CLS?
CLS represents the "smart money" across all markets. It brings together the capital from the largest investment and central banks, boasting a daily volume of over 6.5 trillion.
By understanding how CLS operates—its specific modes and timings—you gain a powerful edge with more precise entries and well-defined targets.
Follow me and take a closer look at Models 1 and 2.
These models are key to unlocking the market's potential and can guide you toward smarter trading decisions.
Remember, no strategy offers a 100%-win rate—trading is a journey of constant learning and improvement. While our approaches often yield strong profits, occasional setbacks are part of the process. Embrace every experience as an opportunity to refine your skills and grow.
Wishing you continued success on your trading journey. May this educational post inspire you to become an even better trader!
“Adapt what is useful, reject what is useless, and add what is specifically your own.”
Dave Hunter ⚔

GOLD (XAUUSD): Bullish Trend Continuation PatternI have seen a promising bullish pattern on hourly time frame on 📈Gold.
Following a new higher high, the market started a correctional movement within the expanding channel, known as a bullish flag pattern.
Bullish breakout of the resistance of the flag is a strong bullish trend-following signal that indicates the strength of the buyers.
It is highly likely that the market will continue to rise and potentially reach a new all-time high. Targets are set at 2880 / 2890

GBP_USD LONG RESULT Price moved, Consolidated, retraced and eventually moved exactly in our Direction and hit out TP exactly B4 major rejection just as predicted.

Sell and wait until it searches daily resistantGold will have potential sell and buy opportunities between daily support and resistant. Now let's wait until the revise pattern is formed at resistant level then start short. Turnaround, buy pattern will start at daily support.

BTC.D - Doomsday or Expected?Evening fellas,
Remember back then when we would say "only the top 1% will actually make it"
Yeah, what about that? People seem to forget this market is extremely fake, full of shitcoins that will not go anywhere.
Trust me, the bottom for alts is not in. Minimum we go here is 75%.
Once the bitcoin maximalists have acquired enough btc by trading alt/btc pair they will dump everything they got back into only BTC.
Gonna leave this here.
Trade thirsty, my friends.

TradeCityPro | Bitcoin Daily Analysis #1👋 Welcome to TradeCityPro!
This is the first analysis in the Bitcoin series on the channel, which will be uploaded daily. In this series, we will analyze futures triggers that can provide us with positions on the same day. Therefore, most of the analyses will be conducted in lower timeframes.
✨ However, in today’s analysis, I will also cover Bitcoin in higher timeframes since this is the first analysis and needs to be comprehensive.
📅 Weekly Timeframe
In the weekly timeframe, we see a strong uptrend where the last leg started from the 54,900 bottom and moved up to the 104,700 resistance. The candle volume has been mostly bullish, aligning with the uptrend.
🔍 Currently, the price is resting below the 104,700 resistance, and the last weekly candle, which closed just yesterday, resembles a rolling pin, indicating indecision among buyers and sellers as the price moved both up and down but ultimately closed in a range.
💥 In RSI, there are two crucial support levels. The first is at 61.85, which RSI is currently near, and if it reacts positively to this level, a new bullish momentum could enter the market. The next support is at 43.90, a critical level for market momentum. As long as RSI stays above this level, bullish momentum remains in the market.
🔼 For the next bullish leg to start, RSI likely needs to enter the overbought zone, attracting more buyers and initiating the next wave. In terms of price action, breaking the 104,700 resistance would be the best trigger for the next move.
⚡️ On the other hand, the price has so far corrected to the 0.236 Fibonacci level near 90,000 and still has the potential for further corrections. If it continues, the next support levels are at the 0.382 and 0.618 Fibonacci zones, which overlap with 81,800 and 70,000, respectively.
📣 Since this series will have daily updates and we will analyze the weekly timeframe after each weekly candle closes, I won’t discuss lower supports or higher resistances until the time is right.
📅 Daily Timeframe
In the daily timeframe, the price is ranging between 91,925 and 106,612. As seen, the price has been rejected from the range high for the second time and has dropped to 96,312.
🧩 Bearish momentum has been decreasing since reaching the 96,312 support, and a rounding formation is gradually forming. A positive aspect is that if Bitcoin establishes a bottom in this zone and moves toward the range high again, it will create a higher low compared to the 91,925 support, increasing the chances of a breakout to the upside.
📊 The volume of the last red candles in the bearish leg has been quite low. In the two recent green candles from yesterday and today, the volume is also very low, meaning the price might soon start its movement. So, it’s best to move to lower timeframes to find a suitable futures trigger.
⌛️ 4-Hour Timeframe
In this timeframe, I won’t analyze much but will instead focus on identifying futures triggers.
🔽 For a short position, the setup is quite clear. There is a solid trigger at 95,798, which the price has tested multiple times, making it a reliable trigger. Since this short position is being opened within the range and near the range low, it should be taken quickly and secured at low risk-to-reward ratios like 2 or 3. It is not an ideal trigger for a long-term trade.
📈 For a long position, the first trigger was the breakout of 97,304, which has already happened, and the price has confirmed above this level. If you haven’t taken a position on this breakout, you can enter on a pullback if a suitable candle forms or if there’s a trigger in lower timeframes. Keep in mind that this trigger is the riskiest, so enter with minimal risk.
✔️ The next long trigger is at 98,937, which is more reliable. If the price stabilizes above this level, we can expect a bullish leg toward the range high.
⌛️ 1-Hour Timeframe
In this timeframe, as seen, the price is pulling back to the 97,304 level while engulfing the previous red candles. RSI is also stabilizing above 64.12. If the candle closes as it is, a long position will be suitable. The key resistance level is at 99,730.
📉 For a short position, the trigger remains similar to the 4-hour timeframe. However, since the price has faked this level in this timeframe, we should wait for another reaction at this area to confirm the actual trigger point.
⭐️ Now, let's analyze the dominance charts. A full dominance analysis will be provided separately. The Total2 analysis will be posted tonight, and the USDT.D and BTC.D analyses will be done tomorrow, but for now, they will be reviewed in the 1-hour timeframe.
⌛️ BTC.D Analysis
In the 1-hour timeframe, we see Bitcoin dominance increasing after reaching the 61.34 bottom, which has contributed to Bitcoin’s recovery following the fake breakdown at 95,798.
👑 If dominance stabilizes above 62%, more money will flow into Bitcoin. In this scenario, if the market moves upward, Bitcoin will rise more than most altcoins, and if the market drops, Bitcoin will decline less than others. The main resistance is at 62.66.
💫 On the other hand, if dominance falls below 61.34, less money will enter Bitcoin. In a bullish market, Bitcoin will underperform altcoins, and in a bearish market, Bitcoin will drop more significantly.
⌛️ Total2 Analysis
In the 1-hour timeframe, the 1.22 level in Total2 overlaps with 97,304 in Bitcoin. However, as seen, Total2 is still below this support and hasn’t confirmed above it yet. The reason is the increasing Bitcoin dominance, causing altcoins to move less than Bitcoin.
☀️ The main resistance in Total2 at this timeframe is 1.28, which is also the key long trigger.
🔽 For a short position, Total2 offers a better trigger than Bitcoin. If Total2 breaks below 1.16 while Bitcoin dominance increases, shorting altcoins will be a better option than Bitcoin.
⌛️ USDT.D Analysis
As seen, the candle has closed below the 4.51 support in this index, and it has more overlap with Bitcoin than Total2.
✔️ The trigger for an increase in USDT dominance is 4.64, which would lead to a market decline. The alignment of this trigger with the short triggers in Total2 and Bitcoin could provide strong confirmation for those trades.
🔑 For a long position, breaking below the 4.40 support in this index would be a good signal. The main support is currently at 4.22, and if this level is broken, the market could begin its next bullish leg.
📝 Final Thoughts
This analysis reflects our opinions and is not financial advice.
Share your thoughts in the comments, and don’t forget to share this analysis with your friends! ❤️

Daily CLS, Key level FVG/ OB Mid, Model 1Hey Traders !!
Feel free to share your thoughts, charts, and questions in the comments below—I'm about fostering constructive, positive discussions!
🧩 What is CLS?
CLS represents the "smart money" across all markets. It brings together the capital from the largest investment and central banks, boasting a daily volume of over 6.5 trillion.
✅By understanding how CLS operates—its specific modes and timings—you gain a powerful edge with more precise entries and well-defined targets.
🛡️Follow me and take a closer look at Models 1 and 2.
These models are key to unlocking the market's potential and can guide you toward smarter trading decisions.
📍Remember, no strategy offers a 100%-win rate—trading is a journey of constant learning and improvement. While our approaches often yield strong profits, occasional setbacks are part of the process. Embrace every experience as an opportunity to refine your skills and grow.
Wishing you continued success on your trading journey. May this educational post inspire you to become an even better trader!
“Adapt what is useful, reject what is useless, and add what is specifically your own.”
Dave Hunter ⚔

TON (telegram coin): is ready for an upward hello guys!
let's analyze TON!
Ton formed a head and shoulders pattern and broke the neckline!
The target of this pattern has already been achieved!
and the last candle touched the flip area too!
so there is no debt to a lower level for this coin! it is ready for an upward movement!

USDJPY "W" PETTERN (READ CAPTION)hello tradrs
current price : 151.800
USDJPY rest support area and created "W" pettren and USDJPY breakout 152.666 then USDJPY PUMP upside because this is stronge resistant and kye for bullish trade
support zone: 151.00
resistance zone : 152.666
demand zone 154.200
please dont forget to like comment and follow

Gold prices are about to drop by about $20 per ounce
XAUUSD: In the short term, it is in the range of high pressure and strong support, forming a dense trading area. High pressure is above 2870. Strong support is below 2860. The profit margin is about 10-15 US dollars per ounce.
Follow the high pressure to short. Strong support to buy opportunities. You can get profits.
xauusd: Sell above 2873. tp2860-2850.sl2680
xauusd: Buy below 2860. tp2870-2880.sl2650

Litecoin - price compressing into HTF resistance Litecoin
- Still has some tail wind from potential SEC ETF approvals incoming.
- Hourly price action compressing into HTF resistance
- Untested weekly open/close levels above calling...

Tradeshrine Academy I used top down analysis on the cahrt to identify important structural leveles, change of character and break of structures before drawing my fair value gap and patiently waited for it to partially fill my order before execution.
If price go below 91,000 my long trade would become invalid as my stop loss would be hit.

XAU Gold Support and Resistance Levels:
- *Support Level*: Approximately 2,840. This level has acted as a bounce point multiple times, indicating buyer interest.
- *Resistance Level*: Sitting closer to the 2,886 level, which has been tested recently. This level appears significant as it has capped advances in the past.
These levels are crucial as they help determine where price action may stall or reverse.
Gradual Buying and Selling Points:
For long-term investors:
- *Buying Strategy*: Consider buying on dips around the 2,840 support level. A staggered buying approach can be implemented if prices approach this level to better average down.
- *Selling Strategy*: Look for selling opportunities when prices approach the resistance level near 2,886.
Indicator Analysis:
The indicators present, which include moving averages and Bollinger Bands, suggest a bullish outlook:
- The price is above the moving averages, indicating momentum in the upward direction.
- The Bollinger Bands are expanding, suggesting increased volatility, which aligns with the current upward movement.
- Potential buy signals could occur if the price stays above the moving average and approaches the lower band, indicating a correction within the overall trend.
Summary:
The current gold spot chart reflects a solid upward trend with identified support and resistance levels providing key points for trading strategies. The indicators support a bullish sentiment, indicating potential opportunities for long positions, especially if the price tests the support level. Keep an eye on market dynamics and volume, as they can further influence price actions.

USDJPT after more range soon the fall can continue -750 pips fall happened as we mentioned before:
now we are looking for some range maybe and soon after that more -250pips fall to the next targets like red arrows on chart.
DISCLAIMER: ((trade based on your own decision))
<<press like👍 if you enjoy💚

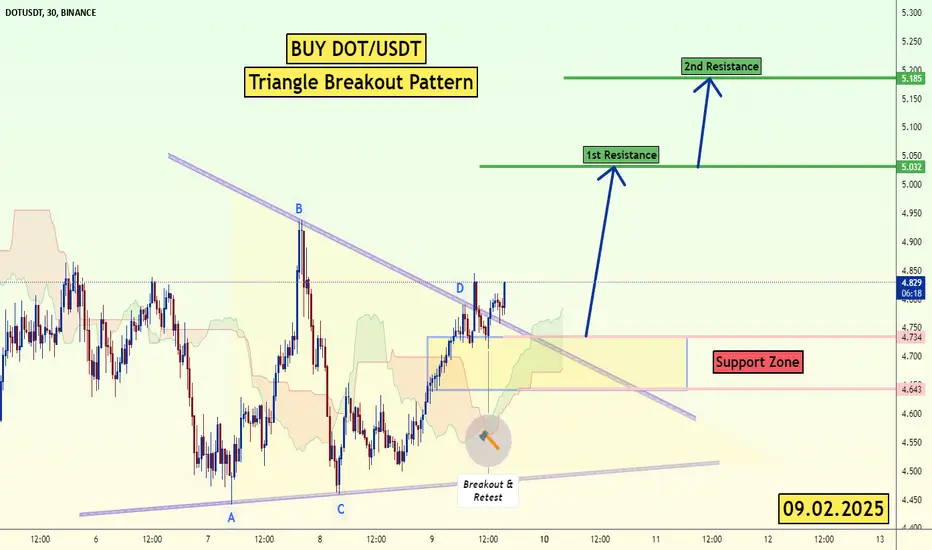
DOT/USDT Triangle Breakout (9.02.25)The DOT/USDT pair on the M30 timeframe presents a Potential Buying Opportunity due to a recent Formation of a Triangle Breakout Pattern. This suggests a shift in momentum towards the upside and a higher likelihood of further advances in the coming hours.
Possible Long Trade:
Entry: Consider Entering A Long Position around Trendline Of The Pattern.
Target Levels:
1st Resistance – 5.03
2nd Resistance – 5.18
🎁 Please hit the like button and
🎁 Leave a comment to support for My Post !
Your likes and comments are incredibly motivating and will encourage me to share more analysis with you.
Best Regards, KABHI_TA_TRADING
Thank you.
the best point todayCertainly! Here's a description of a trading recommendation for gold, written in English:
---
*Trading Recommendation: Potential Opportunity in Gold*
Hello everyone,
I’d like to share a trading recommendation I recently analyzed. This is purely a suggestion for consideration and is not mandatory in any way. I’m sharing this idea based on my personal analysis, but the final decision is always yours.
*Asset Suggested:* Gold (XAU/USD).
*Suggested Direction:* .
*Suggested Entry Point:* .
*Profit Targets:* .
*Stop Loss:* .
*Important Note:*
This recommendation is solely my personal opinion and does not guarantee any success. Always conduct your own research and manage your risks carefully. Trading involves risks, and you may lose part or all of your invested capital.
---
This format provides a clear and transparent way to present your recommendation while emphasizing that the decision is ultimately up to the individual. Let me know if you'd like help refining the details further!

BTC - Third Touch Possible Move BTC has well consolidation done now if third touch happen it would break the support and next move would be near 91000-92000, alternative scenario if breakout happen that means market did not respect to 3rd touch then we can see market near 99000-100000

NZD/CHF "Kiwi vs Swiss" Forex Market Bullish Heist Plan🌟Hi! Hola! Ola! Bonjour! Hallo!🌟
Dear Money Makers & Thieves, 🤑 💰🐱👤
Based on 🔥Thief Trading style technical and fundamental analysis🔥, here is our master plan to heist the NZD/CHF "Kiwi vs Swiss" Forex market. Please adhere to the strategy I've outlined in the chart, which emphasizes long entry. Our aim is the high-risk Red Zone. Risky level, overbought market, consolidation, trend reversal, trap at the level where traders and bearish robbers are stronger. 🏆💸Be wealthy and safe trade.💪🏆🎉
Entry 📈 : "The vault is wide open! Swipe the Bullish loot at any price - the heist is on!
however I advise Place Buy limit orders within a 15 or 30 minute timeframe. Entry from the most recent or closest low or high level should be in retest.
Stop Loss 🛑: Thief SL placed at 0.51100 (swing Trade Basis) Using the 4H period, the recent / nearest low level.
SL is based on your risk of the trade, lot size and how many multiple orders you have to take.
Target 🎯: 0.52360 (or) Escape Before the Target
Scalpers, take note 👀 : only scalp on the Long side. If you have a lot of money, you can go straight away; if not, you can join swing traders and carry out the robbery plan. Use trailing SL to safeguard your money 💰.
📰🗞️Fundamental, Macro, COT, Sentimental Outlook:
NZD/CHF "Kiwi vs Swiss" Forex Market market is currently experiencing a bullish trend,., driven by several key factors.
🟤Fundamental Analysis
1. Economic Growth: New Zealand's economy is expected to grow at a rate of 2.5% in 2023, while Switzerland's economy is expected to grow at a rate of 1.5%.
2. Inflation: New Zealand's inflation rate is currently at 2.2%, while Switzerland's inflation rate is currently at 0.5%.
3. Interest Rates: The Reserve Bank of New Zealand (RBNZ) has kept interest rates at 3.5%, while the Swiss National Bank (SNB) has kept interest rates at -0.75%.
4. Trade Balance: New Zealand's trade balance is currently in deficit, while Switzerland's trade balance is currently in surplus.
🟣Macroeconomic Factors
1. Global Economic Trends: The global economy is expected to grow at a rate of 3.2% in 2023, with a potential slowdown in the second half of the year.
2. Commodity Prices: Commodity prices, such as gold and oil, are expected to remain volatile due to geopolitical tensions and supply chain disruptions.
3. Central Bank Policies: Central banks, such as the Federal Reserve and the European Central Bank, are expected to maintain a dovish monetary policy stance to support economic growth.
4. Fiscal Policies: Fiscal policies, such as government spending and taxation, are expected to remain expansionary in many countries to support economic growth.
🟡Technical Analysis
1. Trend: The current trend is bearish, with the NZD/CHF pair having declined by 5% over the past quarter.
2. Moving Averages: The 50-day moving average is below the 200-day moving average, indicating a bearish trend.
🔵Market Sentiment
1. Investor Sentiment: Institutional investors are 30% bullish, 40% bearish, and 30% neutral on the NZD/CHF pair.
2. Retail Sentiment: Retail investors are 40% bullish, 30% bearish, and 30% neutral on the NZD/CHF pair.
3. Market Mood: The overall market mood is cautious, with investors waiting for further economic data before making investment decisions.
🟠COT Report
1. Non-Commercial Traders: 25% long, 75% short
2. Commercial Traders: 30% long, 70% short
3. Non-Reportable Traders: 20% long, 80% short
🟢Positioning
1. Institutional Traders: 30% bullish, 40% bearish, 30% neutral
2. Banks: 25% bullish, 45% bearish, 30% neutral
3. Hedge Funds: 35% bullish, 35% bearish, 30% neutral
4. Corporate Traders: 20% bullish, 50% bearish, 30% neutral
5. Retail Traders: 40% bullish, 30% bearish, 30% neutral
🔴Overall Outlook
1. Bearish: The NZD/CHF pair is expected to decline due to the stronger Swiss franc and weaker New Zealand dollar.
2. Volatility: The NZD/CHF pair is expected to be volatile, with potential price swings of 5-10% in the short-term.
⚠️Trading Alert : News Releases and Position Management 📰 🗞️ 🚫🚏
As a reminder, news releases can have a significant impact on market prices and volatility. To minimize potential losses and protect your running positions,
we recommend the following:
Avoid taking new trades during news releases
Use trailing stop-loss orders to protect your running positions and lock in profits
📌Please note that this is a general analysis and not personalized investment advice. It's essential to consider your own risk tolerance and market analysis before making any investment decisions.
📌Keep in mind that these factors can change rapidly, and it's essential to stay up-to-date with market developments and adjust your analysis accordingly.
💖Supporting our robbery plan will enable us to effortlessly make and steal money 💰💵 Tell your friends, Colleagues and family to follow, like, and share. Boost the strength of our robbery team. Every day in this market make money with ease by using the Thief Trading Style.🏆💪🤝❤️🎉🚀
I'll see you soon with another heist plan, so stay tuned 🤑🐱👤🤗🤩

gbpusdto me it looks bullish on gbpusd
i want to see some kind of sweep down to the orderblock and await entry untill i have a mms+fvg

POL buying opportunity PSX:POL shows signs of potential support at $0.25-0.3, aiming for a triple bottom. If it holds, expect a move to $0.55. Always do your own research before investing. #crypto #investing

Pivot Points Part 2: Support and Resistance LevelsWelcome back to our series on pivot points, an objective a simple tool used by many day traders.
In Part 1, we explored the central pivot point, its calculation, and its role as a key reference for market sentiment. In Part 2, we’ll expand on this foundation by diving into the support and resistance levels derived from the pivot point formula. These levels are designed to add depth to your day trading analysis, offering a more comprehensive view of intraday price action.
The Mechanics: Support and Resistance Levels
In addition to the central pivot point (PP), pivot analysis includes three levels of support (S1, S2, S3) and three levels of resistance (R1, R2, R3). These levels are calculated using the previous session’s high, low, and close. The formulas for the primary levels are as follows:
PP = (previous high + previous low + previous close) / 3
S1 = (pivot point x 2) - previous high
S2 = pivot point - (previous high — previous low)
R1 = (pivot point x 2) — previous low
R2 = pivot point + (previous high — previous low)
The third levels (R3 and S3) extend even further but are less frequently reached in typical intraday trading. These levels create a structured framework for identifying potential reversal points, breakout zones, and profit targets.
S&P 500 5min Candle Chart
Past performance is not a reliable indicator of future results
Using Pivot Levels in Your Trading
1. Trading the Reversal: Support and Resistance in Action
One of the most common ways to use pivot levels is to identify potential reversal points. For example, if the price reaches S1 or R1 and shows signs of hesitation, it may indicate a reversal is likely. This is particularly true when combined with candlestick patterns, momentum indicators, or divergence on oscillators like RSI.
Example:
In this EUR/USD 5-minute chart, we see a textbook reversal at R1. The market initially uses the pivot point (PP) as support and then forms a double top reversal pattern when retesting R1 resistance, signalling a potential upward move. This setup allows traders to enter with a clear stop above R1 and a target near the pivot point or dynamic moving average.
EUR/USD 5min Candle Chart
Past performance is not a reliable indicator of future results
2. Riding the Breakout
When momentum is strong, the market can break through pivot levels, turning resistance into support (or vice versa). Watching for breakouts at R1 or S1 can provide excellent entry points for trend-following strategies.
Example:
In this example, the FTSE 100 having earlier reversed at R1 and broken through PP, briefly consolidates near S1. This is followed by a break lower – triggering a swift move down to S2.
FTSE 100 5min Candle Chart
Past performance is not a reliable indicator of future results
3. Target Setting and Risk Management
Pivot levels are also useful for setting realistic profit targets and stop losses. For example, a trader entering a long position near S1 might use the pivot point as an initial target, depending on the strength of the move.
Similarly, a short position initiated near R1 could aim for the pivot point as an initial target and S1 as a secondary target, with stops placed just above the breakout level to manage risk.
Combining Pivot Levels with Other Tools
While pivot levels are powerful on their own, combining them with other tools can significantly enhance their effectiveness:
VWAP: If a pivot level aligns with VWAP, it reinforces the level’s importance as a potential support or resistance zone.
Prior Days High/Low: Pivot levels that coincide with the previous session’s high or low can serve as stronger reversal or breakout points.
RSI: Use RSI to gauge momentum—if price approaches a pivot level while RSI is negative or positive divergence at an overbought or oversold, it can signal a potential reversal.
Example:
In the below example we see the FTSE hold above VWAP and the pivot level – forming a solid base of support before breaking higher. The market breaks through R1 and the prior days high leading to a charge past R2 to and towards R3. At R3 we see the market start to stall as the RSI shows signs of negative divergence.
FTSE 100 5min Candle Chart
Past performance is not a reliable indicator of future results
Summary
Pivot points, along with their associated support and resistance levels, offer traders a structured framework for navigating intraday price action. By understanding how these levels interact with market sentiment and momentum, traders can develop more confident strategies for reversals, breakouts, and risk management.
Disclaimer: This is for information and learning purposes only. The information provided does not constitute investment advice nor take into account the individual financial circumstances or objectives of any investor. Any information that may be provided relating to past performance is not a reliable indicator of future results or performance. Social media channels are not relevant for UK residents.
Spread bets and CFDs are complex instruments and come with a high risk of losing money rapidly due to leverage. 83% of retail investor accounts lose money when trading spread bets and CFDs with this provider. You should consider whether you understand how spread bets and CFDs work and whether you can afford to take the high risk of losing

NZDUSDhello trader, here is another swing trade opportunity, price reached the main liquidity area.. price has rejected couple of times in day tf support.. try to get in as low as possible and use stop loss as suggested below... target is the main resistance zone..
News to watchout, upcoming RBNZ cash rate 02/19
good luck
