NZDUSDhello trader, here is another swing trade opportunity, price reached the main liquidity area.. price has rejected couple of times in day tf support.. try to get in as low as possible and use stop loss as suggested below... target is the main resistance zone..
News to watchout, upcoming RBNZ cash rate 02/19
good luck
Community ideas

DOT USDT💰 #DOT
CRYPTOCAP:DOT Polkadot is approaching a major support zone within a falling wedge pattern 🔍
If support holds, expecting a bounce towards $7.988, $10.060, and $12.327 🎯

ETH/USDBullish for Now !!
Bearish Later Stage ...
I will be looking for LONGS To Hold until restistance Area .. Then Sell AfterWards .
Happy Trading

Potential short on GBPUSDHi Probability to complete the pattern along with bearish moving and economy news, and GBP has been struggling to reach the previous high level.

GOLD - Now We have A scalping Entry From now Point 2903 ⚡️ Hey Traders! Let’s Talk GOLD Moves!
What’s up, trading fam? 🤑 Just wanted to drop a quick note about GOLD and some key moves we're spotting on the 15-minute time frame. If you're trading today, keep your eyes glued to these levels!
First off, we've got that bearish reversal hanging around the 2903 mark. If you’re looking for a shift in momentum, this could be your spot!
But wait, it gets juicier! If we break through that 2848 area with some serious volume, things could get interesting! 💥 We're talking real potential for more bearish action. So, stay alert and be ready to pounce if it happens!
Remember, we’re all about those accurate opportunities and sharp analysis. We’ve got your back! If you’re in the game, make sure to keep these levels in check. Happy trading, and may the charts be ever in your favor! 🦸♂️🤡
Catch you on the next move! 🌟
⚡️ Hey traders! Just a heads up on the GOLD moves!
We’re eyeing some key levels on the 15m TF:
🦸♂️ Bearish Reversal From now Price 2903
🦸♂️ Bearish after breaking that 2848 area with high volume!
🤡 Remember, we only send the most accurate opportunities and analysis

Bearish drop?EUR/USD is rising towards the resistance level which is a pullback resistance that aligns with the 38.2% Fibonacci retracement an could drop from this level to our tke profit.
Entry: 1.0354
Why we like it:
There is a pullback resistance level that line sup with the 38.2% Fibonacci retracement.
Stop loss: 1.0420
Why we like it:
There is a pullback resistance level that aligns with the 78.6% Fibonacci retracement.
Take profit: 1.0263
Why we like it:
There is a pullback support level that line sup with the 78.6% Fibonacci retracement.
Enjoying your TradingView experience? Review us!
Please be advised that the information presented on TradingView is provided to Vantage (‘Vantage Global Limited’, ‘we’) by a third-party provider (‘Everest Fortune Group’). Please be reminded that you are solely responsible for the trading decisions on your account. There is a very high degree of risk involved in trading. Any information and/or content is intended entirely for research, educational and informational purposes only and does not constitute investment or consultation advice or investment strategy. The information is not tailored to the investment needs of any specific person and therefore does not involve a consideration of any of the investment objectives, financial situation or needs of any viewer that may receive it. Kindly also note that past performance is not a reliable indicator of future results. Actual results may differ materially from those anticipated in forward-looking or past performance statements. We assume no liability as to the accuracy or completeness of any of the information and/or content provided herein and the Company cannot be held responsible for any omission, mistake nor for any loss or damage including without limitation to any loss of profit which may arise from reliance on any information supplied by Everest Fortune Group.


Gold finds ATH price zone above 2880, sideways above 2835⭐️ Smart investment, Strong finance
⭐️ GOLDEN INFORMATION:
The People's Bank of China (PBOC) increased its gold reserves for the third consecutive month in January, supporting gold prices as China remains the world’s largest gold consumer. Reserves rose to 73.45 million fine troy ounces, up from 73.29 million in December. Economist David Qu from Bloomberg Economics noted that the PBOC is likely to continue diversifying its reserves amid growing geopolitical uncertainty.
Meanwhile, US labor market data released on Friday indicated continued strength, which could delay Federal Reserve (Fed) rate cuts. The US added 143,000 jobs in January, below the expected 170,000, while the unemployment rate edged down to 4.0% from 4.1%. As a result, traders now anticipate only one Fed rate cut this year, potentially boosting the US Dollar and pressuring gold prices.
⭐️ Personal comments NOVA:
Gold accumulates in a good growth price zone, around 2880 and adjusts sideways at the beginning of the week.
⭐️ SET UP GOLD PRICE:
🔥 SELL GOLD zone: $2884 - $2886 SL $2891
TP1: $2878
TP2: $2870
TP3: $2860
🔥 BUY GOLD zone: $2852 - $2854 SL $2849 Scalping
TP1: $2858
TP2: $2863
TP3: $2870
🔥 BUY GOLD zone: $2831 - $2833 SL $2826
TP1: $2840
TP2: $2850
TP3: $2860
⭐️ Technical analysis:
Based on technical indicators EMA 34, EMA89 and support resistance areas to set up a reasonable SELL order.
⭐️ NOTE:
Note: Nova wishes traders to manage their capital well
- take the number of lots that match your capital
- Takeprofit equal to 4-6% of capital account
- Stoplose equal to 2-3% of capital account

XRP Breaks Out of Downtrend Is a Big Rally About to Begin ?XRP is currently trading around 2.42 and has recently broken out of a descending channel formation. This breakout suggests a potential shift in momentum from bearish to bullish. The price is now consolidating just above the trendline, indicating that buyers are stepping in to support this level.
The descending channel was characterized by consistent lower highs and lower lows. However, the breakout above the upper boundary of the channel signals that the selling pressure may be weakening. If the price holds above this level, further upside movement is expected.
A key support level is now established around 2.40 to 2.42, which was previously resistance. If the price stays above this zone, the bullish case strengthens. Immediate resistance is found around 2.50 to 2.55, where price has faced rejection before. A decisive break above this area would confirm further upside movement.
Volume analysis shows that trading activity is still relatively low, which is common during consolidation phases. A strong increase in volume above 2.45 would provide additional confirmation of bullish strength. Monitoring this volume breakout is essential for validating the move.
Momentum indicators such as the RSI should also be observed. If RSI moves above 55 to 60, it would indicate growing buying pressure. A hidden bullish divergence, if present, would add further confidence to the breakout.
The first target for this breakout is 2.50 to 2.55, where resistance is expected. If price gains strength beyond this zone, the second target would be 2.65 to 2.70. These levels mark potential areas where price could face selling pressure or profit-taking.
To manage risk, a stop-loss should be placed below 2.38 to 2.40 to avoid potential fakeouts. If price falls back below this support, the breakout could be invalidated, leading to a potential retest of lower levels.
XRP is at a crucial turning point, with signs of bullish momentum building. If the price sustains above the breakout zone and breaks through 2.45 to 2.48 with strong volume, a larger upward move could follow. Traders should remain cautious but keep an eye on price action for confirmation of the next trend direction.

Buy nzdcadStrong buy expected
Daily strong buy level
Daily downtrend broken and retested
Weekly oversold pair

XAU Long Term Analysis (Everyone Should Be Careful)Now that we have so much data available, it looks like we have a large diametric on the chart.
We are now at the end of wave E. You should be careful of emotional buys.
It is expected that by hitting the supply, the price will enter the correction phase for more than 1 year.
For risk management, please don't forget stop loss and capital management
Comment if you have any questions
Thank You

S&P 500’s Next Big Move: 6,200 or Bust?Hey Realistic Traders, Will CAPITALCOM:US500 Move beyond 6,200? Let’s dive into the analysis...
On the daily chart, the S&P 500 is trading above both the EMA-100 and EMA-200, confirming a robust bullish trend. This momentum was reinforced by a falling wedge breakout, a pattern that typically signals the continuation of bullish pressure. Additionally, the price tested the upper trendline twice and bounced off each time, further underlining the strength of the upward move.
Considering these strong technical signals, the price is likely to move downward toward the first target at 6.240 or potentially the second target at 6.391.
However, this bullish scenario depends on the price staying below the critical stop-loss level at 5844
Support the channel by engaging with the content, using the rocket button, and sharing your opinions in the comments below.
Disclaimer: “Please note that this analysis is solely for educational purposes and should not be considered a recommendation to take a long or short position on S&P500”.

Gold 4hour say 2 scenario will come as i was predict 1 week ago ,gold reach 3000$ area (i am world best technical analyse hahaha😂)
let see gold futures candels and AC indicator(on gold only AC important on daily chart,understand?)
AC daily is red=if if if high not break signal is sell, if last high break signal will switch to buy
2 scenario can come=
60% traders see pinbar pick sell, go down to fibo 50%(i will sell on monday with SL on pinbar high)
40% break high (i put buystop there)and go to fibo 161% touch 2950 (if pinbar come there i will sell there too)
my win secret in my trade after 17 year = always put SL on H4 last high,low ,,,i and pro traders do this,,,no sl=non pro trader=margincall soon or late
wish you win ,if you have question,dont fear contact me

CKBUSDT trading ideaCKBUSDT initially formed a rounding bottom pattern, but price faced strong resistance at the neckline, leading to a significant rejection and the development of a falling wedge structure. Price is now approaching the lower boundary of the wedge, making this a key level to watch for potential reversal.
The reaction at this zone will determine the next major move, with a confirmed breakout of the wedge likely to trigger a retest of the neckline zone around $0.033, potentially reigniting bullish momentum.
Mid and long-term targets are outlined on the chart, with price action within these levels guiding the broader trend outlook. Monitor closely for confirmation.

GOLD SELL: One more round Gold is over-extended retracement is very likely
Do not over-trade
Follow risk management
Follow for more setups
Once the trade is in 150 pips in profit, set breakeven
Swing trade. Patience is must

EURUSDHello Traders! 👋
What are your thoughts on EURUSD?
The EURUSD pair reacted bullishly after touching the support zone, leading to an upward movement. This support level aligns with an ascending trendline, adding to its significance.
Currently, the price is struggling with a key resistance zone. A confirmed breakout above this level would generate a bullish signal, potentially driving the price toward the next target level.
However, if the support zone is broken, the bullish scenario would be invalidated.
Don’t forget to like and share your thoughts in the comments! ❤️

Ethereum i think we face bottom. Soon UP only Ethereum i think we face bottom. Soon UP only
after such liquidation chances for drop are small

Short term bearish gold!gold has rallied from 2020 to nov'24 . price pause at 2800 us dollars. as per harmonic pattern my view on gold for short term is bearish.

Gold is bearish! A chance to make a fortune!Gold remains in a strong bullish trend, driven by escalating geopolitical tensions. We've seen multiple all-time highs forming as bullish momentum continues. Despite this, the stock market remains resilient at its highs, indicating that investors are not yet aggressively seeking safe-haven assets.
Currently, I’m focusing on the symmetrical triangle and the bullish channel that has formed. Given the price action, a pullback or retracement is likely, especially as the price tests the upper boundary of the channel. A strong rally followed the bullish breakout from the triangle, suggesting that this short-term surge may be reaching its conclusion. I anticipate a pullback to the 38%-50% Fibonacci retracement levels, as indicated on my chart. These levels align with the lower boundary of the channel, which has served as a key support line throughout the recent bullish trend.

NZDCHF - Trend-Following TA signals short!NZDCHF overall bearish, looking for trend-following shorts on lower timeframes.
📚 Always follow your trading plan regarding entry, risk management, and trade management.
Good luck!
All Strategies Are Good; If Managed Properly!
~Rich
Disclosure: I am part of Trade Nation's Influencer program and receive a monthly fee for using their TradingView charts in my analysis.

Daily live trade with XAUUSD in 15m/30m/1h 20250210Daily live trade with XAUUSD in 15m/30m/1h 20250210

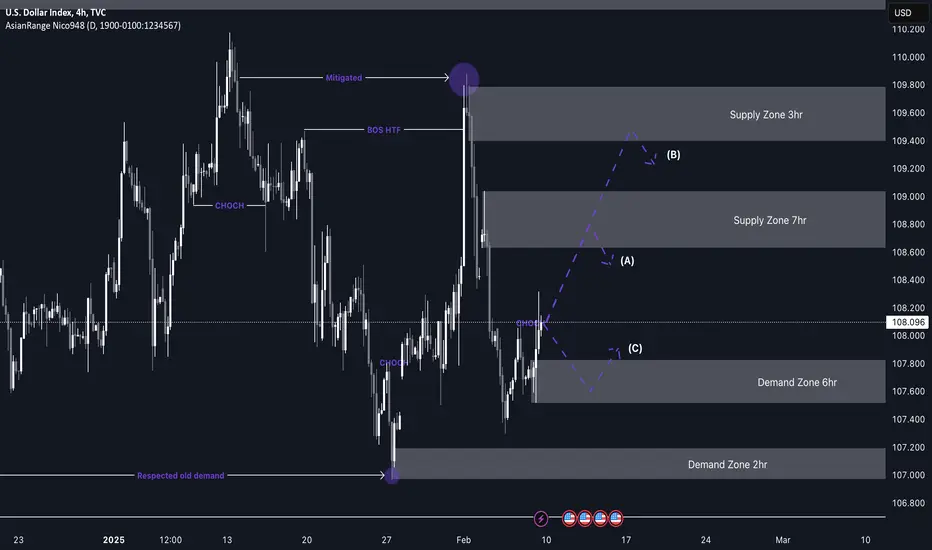
DXY (Dollar index) short from 108.800My DXY analysis aligns with the expectation of a bearish move, which suggests that my pairs—EU and GU—could push higher. However, before that, we may see a minor pullback as price moves toward a demand zone.
Price has recently broken structure to the upside, leaving behind a fresh demand level. Once price reaches this area, I anticipate accumulation before a potential move upward. I will look for opportunities to capitalize on this movement across the pairs I trade, such as Gold, EU, and GU.
The price action has been very clean so far, which is promising, and we can expect more of the same as we move further into Q1.
Have a great week ahead and remain vigilant!