PeopleBtc Buy opportunityPEOPLEBTC is currently trading within a well-defined descending channel, with price testing the bottom range of the pattern. A potential reversal from this level could initiate a move toward the upper boundary of the channel, aligning with the broader market structure.
The critical zone remains a key area to watch, as it will dictate the next major market decision. A confirmed breakout above this zone would trigger strong bullish momentum, potentially leading to a retest of the major supply zone outlined on the chart.
Price action within these key levels will determine whether the structure remains intact or shifts into a broader trend reversal.
Let us know your thoughts on this setup.
Community ideas

Amazon (AMZN) Shares Retreat from All-Time HighAmazon (AMZN) Shares Retreat from All-Time High After Earnings Report
As shown in the Amazon (AMZN) stock chart, the price reached an all-time high of around $242 per share on 4 February. However, following the earnings report on 6 December, AMZN shares declined despite the company exceeding analysts' expectations:
→ Earnings per share: Actual = $1.86, Forecast = $1.48
→ Revenue: Actual = $187.8bn, Forecast = $187.3bn
Investor disappointment may have stemmed from:
→ Signs of slowing cloud business growth. Amazon, a pioneer in public cloud services with Amazon Web Services (AWS), now reports annual cloud revenue growth of around 20%, down from over 50% five years ago.
→ Soaring capital expenditure on AI data centres with uncertain profitability prospects. Amazon has projected approximately $105bn in capital spending for 2025, up 27% from 2024 and 57% from 2023.
Technical Analysis of Amazon (AMZN) Stock
AMZN remains within an upward trend, indicated by the blue channel on the chart. However, bullish momentum appears vulnerable as:
→ The price struggles to reach the upper boundary of the channel.
→ A bearish "head and shoulders" (SHS) pattern is visible on the chart.
→ A bearish gap (marked with an arrow) has formed post-earnings, suggesting a potential resistance area ahead.
This points to a possible pullback. If it occurs, AMZN stock could correct, potentially towards the parallel orange line, drawn based on the blue channel’s width. A test of the $217 support level is also possible.
Should You Buy AMZN Shares Now?
Following the earnings report, AMZN has underperformed the S&P 500 (US SPX 500 mini on FXOpen). However, analysts remain optimistic. According to TipRanks:
→ 45 out of 46 analysts recommend buying AMZN stock.
→ The average 12-month price target for AMZN is $267.
Trade on TradingView with FXOpen. Consider opening an account and access over 700 markets with tight spreads from 0.0 pips and low commissions from $1.50 per lot.
This article represents the opinion of the Companies operating under the FXOpen brand only. It is not to be construed as an offer, solicitation, or recommendation with respect to products and services provided by the Companies operating under the FXOpen brand, nor is it to be considered financial advice.

Nat Gas Weekly Update: 2/9/25Models have been having a hard time with the long range physics of the global atmospheric patterns. Which is great for those of us that can see past a computer! The models began to see this last weekend, and the price gapped higher 16 cent. This weekend they confirmed once again, and we opened 10 cents higher. There has been continued support around the 20D SMA and we are now looking at the 61.8% fib ($3.50) to become the new resistance level. But all these chart technical cannot stop the cold and the withdrawal of NG form storage. This weeks video touches upon storage and the importance of the storage/price relationship.
Natural Gas pricing is a function of fundamentals and sentiment. I use technical levels to verify if pricing is in equilibrium with fundamentals. To make sure that sentiment does not throw the supply/demand cost structure out of balance. Too high of a price and there becomes constraints on the usage, and a replacement with cheaper, dirtier coal. If the price becomes too low, then there is a cutback in exploration, production, TIL wells (which we will talk about in the future), and a decrease in well head volume. Just like this past summer when NG reached historic lows, the cure for low price is less supply. Which is why producer restraint, low rig count and a historic number of TIL and uncompleted wells helped with over storage.
The weekend models both trended 15 HDD colder, with the European still 25 HDD colder than the US model. Using the conversion of 1.6 BCF/d per 1 HDD, the US and the Euro are predicted to use more than 92.8 BCF and 128 BCF than average in the next two weeks, respectively. This would put NG storage at over 8% of the 5-year average. This is quite bullish and I expect the March contract to settle at close at or above $3.75/MMCF. It is possible for $4.00/MMCF if withdrawals hit the predicted 900 BCF for the month of February.
Keep it burning!

HOOD. Drop first before the pump. I believe we will come down early next year (bottom box) before we pump to test some important daily levels (top Box). Thoughts?

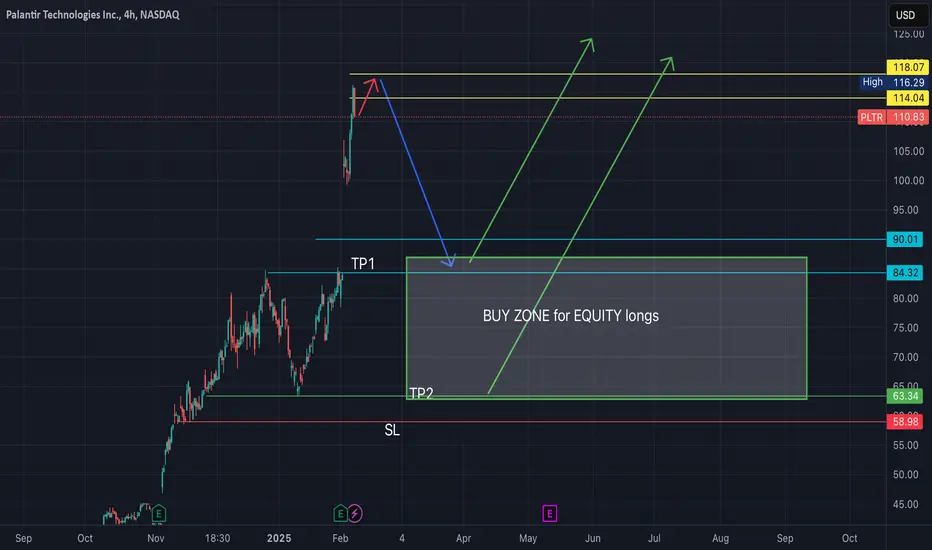
PLTR -- more volatility forecasted into MarchExpecting quick progression to 118$ level as final buy-side wave near term.
Looking for renewed significant selling action from that level to retrace price back to pre-earnings levels near 80-85$
Possibility exists (imho) that we fully retrace back to 63-64$ levels by April timeframe, depending on sentiment as we head into next FOMC meeting in mid-March.
After that, my cycles analysis indicates we will continue higher toward 120...Therefore, I will be planning on taking profits on put option contracts once underlying share price reaches below 85$, and will plan on scaling into long equity positions on discounts between 64-85$ for the projected subsequent buy wave to 120+
Crude Oil Holds Above 70 Support ZoneAmid upside risks from Trump’s tariffs and downside pressures from policies favoring price cuts and overproduction, oil remains highly volatile, trading above key support levels while maintaining its broader downward trajectory from 2022 to 2025.
Critical support zones to monitor include $69.5, $66, and $64, which have acted as key rebound areas since December 2021. A firm close below the $64 support could accelerate losses toward the psychological $60 level and $55, aligning with the 0.618 Fibonacci retracement of the 2020–2022 uptrend.
On the upside, the upper boundary of the established channel serves as strong resistance near $78. A sustained close above $80 would signal a potential shift in sentiment, eyeing $84, $89, and $95, which align with waves A, C, and E of the triangle pattern, marked by the highs of September 2023, April 2024, and July 2024.
Key events to watch:
OPEC's monthly oil report
Trump’s tariff announcements
Fed Chair Powell’s testimony
U.S. CPI report
- Razan Hilal, CMT

AUD_USD WILL FALL|SHORT|
✅AUD_USD made a retest
Of the strong horizontal resistance
Level of 0.6300 just as we expected
And the pair formed a double top
Pattern so we are locally bearish
Biased and we will be expecting
A local bearish move down
SHORT🔥
✅Like and subscribe to never miss a new idea!✅

Galausdt Buying opportunityGALAUSDT has completed a full five-wave impulsive decline, marking the potential exhaustion of the corrective phase from its all-time high. The current price structure suggests a confirmed bottom, with consolidation forming near a key liquidity zone, reinforcing the probability of an upside breakout.
A well-defined accumulation zone has been identified, aligning with key demand levels and previous structural supports, making it an ideal area for strategic positioning. If bullish momentum strengthens, price expansion towards the supply zone is expected, where profit-taking opportunities align with significant resistance levels.
A failure to sustain the current range could indicate a potential liquidity sweep before a confirmed move.

ETH Building Blocks...Hello TradingView Family / Fellow Traders. This is Richard, also known as theSignalyst.
ETH Building Blocks:
📈 Short-Term Bullish:
ETH is currently trading within a short-term bullish block.
📈 Long-Term Bullish:
If the $3,500 resistance level is broken to the upside, ETH is expected to enter a long-term bullish block, initiating a new bullish phase toward the $4,000 mark.
📉 Short-Term Bearish:
If ETH breaks below the short-term bullish block at $3,250, it will enter a short-term bearish block phase.
📉 Long-Term Bearish:
If the $3,000 level is broken to the downside, a long-term bearish movement toward the lower bound of the long-term bearish block, around the $2,500 mark, is expected.
📚 Always follow your trading plan regarding entry, risk management, and trade management.
Good luck!
All Strategies Are Good; If Managed Properly!
~Rich

GOLD: The Bullish Movement Remains Intact - GOLD is Still StrongGOLD: The Bullish Movement Remains Intact - GOLD is Still Strong
In our previous analysis, we observed that gold consistently respected the red zone marked on the charts. The low was reached at 2834, but as I explained, the bullish trend remains strong and intact. Today, the market pushed the price above the red zone, reaching a new all-time high of 2900.
The bullish movement is influenced by speculations surrounding Trump, but I believe it is more closely related to the actions of central banks, which have been increasing their gold reserves significantly. In January, these reserves saw a substantial rise. Consequently, gold may continue to rise further.
You may find more details in the chart!
Thank you and Good Luck!
❤️PS: Please support with a like or comment if you find this analysis useful for your trading day❤️

Bitcoin Analysis—Bulls vs Bears—Who Will Win This Battle!?As I expected in the previous post , Bitcoin ( BINANCE:BTCUSDT ) attacked the Support zone($96,520-$95,720) and 100_SMA(Daily) but started to rise again. The increase in the last few hours has NOT been accompanied by high volume so far.
Bitcoin is moving in the Resistance zone($100,520-$97,200) and near the Potential Reversal Zone(PRZ) , the upper lines of the Falling Wege Pattern , the Monthly Pivot Point , and 50_SMA(Daily) .
According to the theory of Elliott waves , Bitcoin seems to have succeeded in completing the Expanding Flat(ABC/3-3-5) near the upper lines of the Falling Wege Pattern . If Bitcoin goes above $99,200 , this wave count will expire .
Educational tip : If you cut the falling wedge pattern exactly in half, you will notice that most of the candles are in the lower half, and whenever Bitcoin hits the upper lines, it starts to fall immediately, which means that the power of sellers is more than buyers. Although the wedge pattern is a bullish pattern, we cannot expect an increase until the upper line is validly broken.
I expect Bitcoin to re-attack the 100_SMA(Daily) and Support zone($96,520-$95,720) in the coming hours, and if it breaks , it will also attack the lower line of the falling wedge pattern .
Note: If Bitcoin breaks the upper lines of the falling wedge pattern in huge volumes, we should most likely wait for the break of the Resistance zone($100,520-$97,200). However, the main resistance of Bitcoin is the $107,000 range.
Note: If Bitcoin manages to break the lower line of the falling wedge pattern and 100_SMA(Daily), we should wait for Bitcoin to attack the Heavy Support zone($93,300-$90,500) and Support lines.
Which scenario do you think will happen to Bitcoin?
Please respect each other's ideas and express them politely if you agree or disagree.
Bitcoin Analyze (BTCUSDT), 1-hour time frame.
Be sure to follow the updated ideas.
Do not forget to put Stop loss for your positions (For every position you want to open).
Please follow your strategy and updates; this is just my Idea, and I will gladly see your ideas in this post.
Please do not forget the ✅' like '✅ button 🙏😊 & Share it with your friends; thanks, and Trade safe.

Hbarusdt trading ideaHBAR faced strong rejection at a key resistance level, leading to a retracement toward crucial demand zones. The immediate buyback zone and the critical point of interest are the key areas to watch, as one of these levels is expected to provide support and validate a potential reversal. The projected upside targets remain unchanged, contingent on price reaction within these zones. Monitor closely for confirmation.

Bitcoin support provides upsideIf Bitcoin stays above this key level, it suggests buyers are still in control, and the upward trend is likely to continue. If it breaks below, the sentiment could turn bearish (negative).

TIA Price at Crucial ATL Support: Rebound or New Lows Ahead?TIA Price Analysis
TIA is currently testing its All-Time Low (ATL) horizontal support, a critical level that could determine the next major price movement.
Support Zone: The price is holding near the ATL support, historically acting as a strong demand area.
Potential Rebound: If this support holds, we could see a recovery targeting the $4.20–$4.60 resistance zone.
Bearish Risk: A breakdown below this support would likely trigger further downside, potentially reaching new lows.
The price action near this key level should be closely monitored to confirm the next trend direction.
#TIA #Crypto #TechnicalAnalysis

BUY EURUSDIn this coming week, we anticipate the weekly low to form on Monday, setting up a bullish move. Entry at 1.03270, targeting 1.04485 and 1.05701, with a stop loss at 1.02579. CPI and PPI data this week could drive volatility, but the current structure supports further upside.
Use proper risk management.
Best of luck to you all.

Gold trading continues to be profitableIn terms of the 4-hour trend of gold, the price has moved out of the previous high-level oscillation range. In the European and American sessions, pay attention to whether there is a secondary upward trend after a retracement confirmation. In the short-term trend, pay attention to the support around 2880 below. In terms of the hourly trend, the K-line basically maintains an upward trend along the short-term moving average, and there is basically no retracement during the day. If you want to short in the short term, you must at least wait until there are short-term signs of a peak in the small-level cycle trend, and pay attention to short-term adjustments. On the whole, the short-term operation strategy for gold today is recommended to focus on long positions on pullbacks and short positions on rebounds. The short-term focus on the upper side is the 2908-2910 resistance line, and the short-term focus on the lower side is the 2878-2880 support line.

DeGRAM | GOLD money flows into goldGOLD is in an ascending channel between the trend lines.
The chart has reached the important psychological level of $2900.
Indicators point to overbought.
We expect XAUUSD to start a correction soon, but there is a margin left before reaching the upper boundary of the channel.
-------------------
Share your opinion in the comments and support the idea with a like. Thanks for your support!

CHECK GBPJPY ANALYSIS SIGNAL UPDATE > GO AND READ THE CAPTAINBaddy dears friends 👋🏼
GBPJPY trading signals technical analysis satup👇🏼
I think now GBPJPY ready for BUY trade GBPJPY BUY zone
( TRADE SATUP) 👇🏼
enter point (189.000) to (188.900) 📊
First tp (189.200)📊
2nd to (189.400)📊
Last target (189.700) 📊
stop loss (188.400)❌
Tachincal analysis satup
Fallow risk management

Butterfly short on XAUUSDPrecious Metals Miners Lagging Behind: An Unexplained Disparity
Despite the ongoing strength in precious metals, mining stocks continue to underperform, exhibiting a divergence that lacks a clear fundamental justification. This widening disconnect is creating an increasingly stretched imbalance, suggesting that a correction may be imminent. Such persistent underperformance appears illogical and unsustainable in the long run.
From a technical perspective, I am eyeing the 2915 level for a potential short position. Notably, the Harmonic Butterfly pattern completes around 2815-2818, making it a key reaction zone.
My take-profit targets are set at 2805 and 2700.

EURUSD Bullish Bat PatternOn the 4-hour chart, EURUSD is in a short-term shock and decline, with bears taking advantage. Currently, attention can be paid to the support near 1.0236 below, which is a potential buying position for a bullish bat pattern, and this position is in the previous demand area.

The End of Bitcoin ( Alt started Great Rotation )BTC dominance is ending, marking the start of the great rotation. Targeting a 40% shift, equivalent to $800B in capital flows at the current market cap. Happy to see Alts great rotation.

Hang Seng Index Hits Four-Month High Amid DeepSeek’s SuccessHang Seng Index Hits Four-Month High Amid DeepSeek’s Success
As shown in the Hang Seng (Hong Kong 50 on FXOpen) chart today, the index has risen above the 21,500 mark for the first time since October 2024.
According to Reuters, bullish sentiment is fuelled by optimism surrounding the success of the DeepSeek startup. Leading gainers include tech stocks:
→ Chipmaker Cambricon Technologies surged 6.2%;
→ AI firm CloudWalk Technology hit the 20% upper limit;
→ Major telecom operators China Mobile, China Unicom, and China Telecom also saw gains after announcing their collaboration with DeepSeek’s open-source model to "promote the inclusive adoption of cutting-edge AI technologies."
Analysts at China Securities believe the uptrend could persist until the second half of March.
Technical Analysis of the Hang Seng Chart
Applying Fibonacci retracement levels using the August low (A) and the October 2024 high (B), we can see how these levels acted as temporary support (marked with arrows) as the price retraced to the January low (C).
In the most optimistic scenario:
→ The rally over the past three weeks may signal the resumption of the A→B uptrend;
→ Based on Fibonacci proportions, bulls may target the 1.618 extension of the initial move, implying a potential price level 61.8% higher than the previous peak.
This suggests a possible target around 25,520, though this appears somewhat ambitious for the Hang Seng (Hong Kong 50 on FXOpen) given:
→ Rising inflation in China—today’s data shows the annual CPI climbed from 0.1% (previous reading) to 0.5%;
→ The prospect of escalating tariff tensions with the US after China retaliated against Trump’s 10% tariffs on Chinese imports.
Trade on TradingView with FXOpen. Consider opening an account and access over 700 markets with tight spreads from 0.0 pips and low commissions from $1.50 per lot.
This article represents the opinion of the Companies operating under the FXOpen brand only. It is not to be construed as an offer, solicitation, or recommendation with respect to products and services provided by the Companies operating under the FXOpen brand, nor is it to be considered financial advice.

Market Analysis: AUD/USD Rebound: Signs of Trend Shift?Market Analysis: AUD/USD Rebound: Signs of Trend Shift?
AUD/USD started a decent increase above the 0.6200 and 0.6240 levels.
Important Takeaways for AUD USD Analysis Today
- The Aussie Dollar rebounded after forming a base above the 0.6100 level against the US Dollar.
- There was a break below a connecting bullish trend line with support at 0.6255 on the hourly chart of AUD/USD at FXOpen.
AUD/USD Technical Analysis
On the hourly chart of AUD/USD at FXOpen, the pair started a fresh increase from the 0.6090 support. The Aussie Dollar was able to clear the 0.6170 resistance to move into a positive zone against the US Dollar.
There was a close above the 0.6240 resistance and the 50-hour simple moving average. Finally, the pair tested the 0.6300 zone. A high was formed near 0.6301 and the pair recently saw a minor pullback.
There was a move below the 0.6300 level. The pair declined below the 23.6% Fib retracement level of the upward move from the 0.6088 swing low to the 0.6301 high. Besides, there was a break below a connecting bullish trend line with support at 0.6255.
On the downside, initial support is near the 0.6240 level. The next major support is near the 0.6195 zone or the 50% Fib retracement level of the upward move from the 0.6088 swing low to the 0.6301 high.
If there is a downside break below the 0.6195 support, the pair could extend its decline toward the 0.6170 level. Any more losses might signal a move toward 0.6090.
On the upside, the AUD/USD chart indicates that the pair is now facing resistance near 0.6270. The first major resistance might be 0.6300. An upside break above the 0.6300 resistance might send the pair further higher.
The next major resistance is near the 0.6335 level. Any more gains could clear the path for a move toward the 0.6380 resistance zone.
Trade on TradingView with FXOpen. Consider opening an account and access over 700 markets with tight spreads from 0.0 pips and low commissions from $1.50 per lot.
This article represents the opinion of the Companies operating under the FXOpen brand only. It is not to be construed as an offer, solicitation, or recommendation with respect to products and services provided by the Companies operating under the FXOpen brand, nor is it to be considered financial advice.
