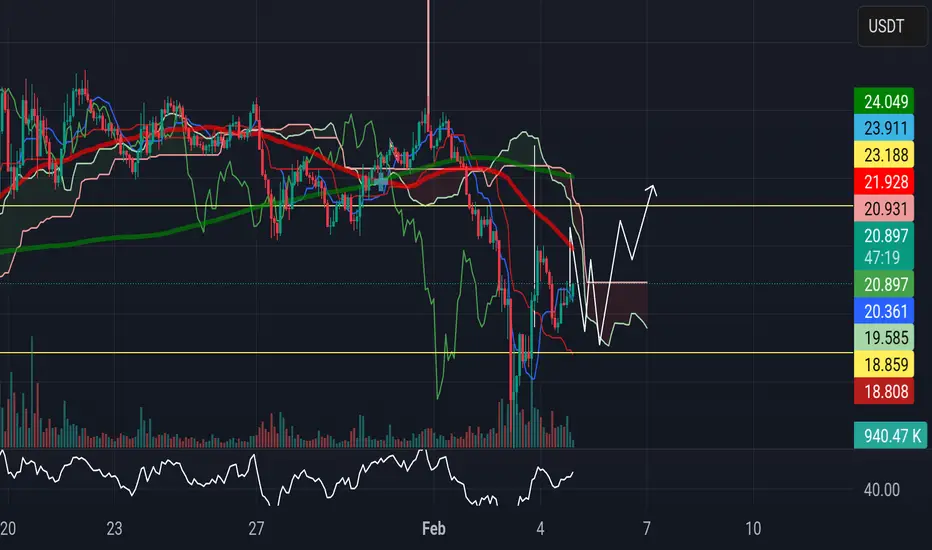
A short on datausdt low stop
*"I have a Fibonacci-based strategy that has brought me significant returns. It usually works well on the M15 timeframe. Crypto prices are somewhat unpredictable—people who simply hold onto their positions instead of trading cause the market to behave in unexpected ways. However, I will attempt a new sell in the 0.02600 / 0.02650 area."*
📈
Community ideas

EW Says: Ethereum is ready to move up soon.EW means Elliott Wave, and Elliott wave is very cool, not ewww... Or at least that has been my findings studying it for a couple months now.
The ethereum chart is very clear, with two impulse waves separated by first of running flat, and then a traditional flat corrective phase. We have just completed the traditional flat corrective phase.
EW provides a way to calculate price targets, the current likely price target is not looking that favorable, suggesting a return to merely the previous highs, not even the all-time high! However, as Wave five gets moving, we can use the subways to calculate a potentially more accurate price Target.
The recent Bitcoin dump allowed ethereum to complete its corrective phase in my opinion. Despite the sluggishness of the market currently, we should still see some fireworks in the months ahead!--and that's it folks, time to sell when you see it! Likely bear market time afterwards. Hopefully ethereum can eeek out a new all new all-time high before then

OM: Gearing Up for a Major Breakout! NASDAQ:OM is gaining momentum for a major breakout.
With increasing demand and strong fundamentals, the next all-time high is within reach.

PYTH/USDT | 1W🩸 SEED_DONKEYDAN_MARKET_CAP:PYTH ⁀➷
#PythNetwork. Macro chart Another
💯 Intermediate Target - $1.23
🚩 Macro Target 1 - $1.90
🚩 Macro Target 2 - $3.40
🚩 Macro Target 3 - $5.60
- Not financial advice, trade with caution.
#Crypto #PythNetwork #PYTH #Investment
✅ Stay updated on market news and developments that may influence the price of Pyth Network . Positive or negative news can significantly impact the cryptocurrency's value.
✅ Exercise patience and discipline when executing your trading plan. Avoid making impulsive decisions driven by emotions, and adhere to your strategy even during periods of market volatility.
✅ Remember that trading always involves risk, and there are no guarantees of profit. Conduct thorough research, analyze market conditions, and be prepared for various scenarios. Trade only with funds you can afford to lose and avoid excessive risk-taking.

ARB- LONG from hereHi,
The chart is now showing HEAVY oversold on the 1D timeframe.
While the price is perfectly at the support, I will be opening a long here with a 40% target and the SL under the local lows (not including the flash crash).
GL if you enter.


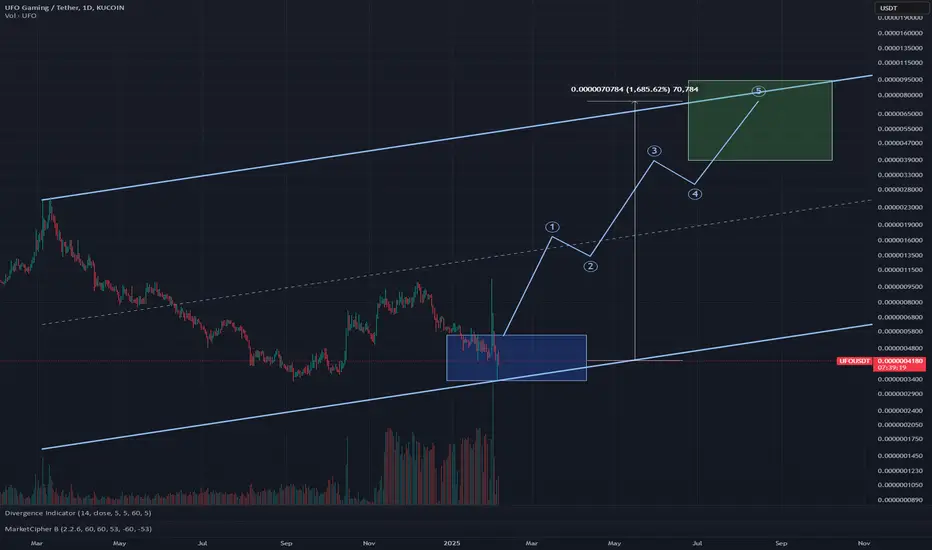
#Altcoin pick 12: UFO Gaming $UFO Time to accumulate this GameFi project merging gaming with DeFi, UFO Gaming creates a play-to-earn platform where players own in-game assets and earn rewards.
NAS100 Long After Retest Nothing advanced, just observing price as well as anticipating a test of the 21320 zone before a small bullish run. But let's see.

seems like BTC still has potentialthe chart clearly shows that the price respected the cup & handle pattern by breaking the handle quite strongly price projection has also been marked, right now the price is in range with bearish divergence moreover yellow trendline acting as resistance for some time and to break that it is good for BTC to be in range for some time

Stay patient! US Job openings just came in 5% lower than expected!
What does this mean?
It will show the FED that high interest rates are detrimental to the US economy.
On top of the pressure from China and Deepseek, the tariff news and the fear of a global trade war.
This will push the FED to review policy, and if we see a continued trend of less-than-expected jobs, we could transition from Quantitative Tightening to Quantitative Easing, which will be extremely bullish on the market!
You just need to be patient and focus on holding CRYPTOCAP:BTC and winning projects such as $SNAI!
If you are reading this, you are still early in the 2025 bull run!

XAUUSD 4h chartwill reach or retrace to the bearish trade zone around 2812-2824 before making a move

Daily / H4 CLS, Order Block Midpoints, Model 1 Daily / H4 CLS, OB Mid, Model 1. Im open to react to the H4 CLS and the Daily CLS once the setups occur at the moment. It's not 100% clear setup. So, we need to wait a bit for the manipulations.
Don't hesitate to comment with your thoughts and share your charts or questions below, I like any constructive discussion.
What is CLS?
is the smart money of all markets. This company aggregates capital from the biggest investment banks and central banks. Its daily volume is over 6.5 trillion.
CLS operates in specific modes and times. By understanding their models, we get an unfair advantage against others with fantastic precision for your entries and mechanical definition of the targets.
Follow me and pay attention to my model 1 and 2.
It's the key to the markets.
None of the strategies of the world has a 100%-win rate and I'm just a human. We make big profits, but sometimes we can miss something or make mistakes.
Good luck and I hope this educational post helps you to become a better trader
“Adapt what is useful, reject what is useless, and add what is specifically your own.”
Dave Hunter ⚔

Final Shakeout? BTC Dominance Rejection Signals Market Shift!The Bitcoin Dominance Chart suggests a major shakeout, potentially signaling the beginning of a significant market shift.
After reaching the upper boundary of an ascending wedge, dominance has sharply rejected from key resistance, leading to a breakdown.

Shiba Faces Potential 30% Drop: Set Stop-Loss for SafetyHello and greetings to all the crypto enthusiasts, ✌
In several of my previous analyses, I have accurately identified and hit all of the gain targets. In this analysis, I aim to provide you with a comprehensive overview of the future price potential for Shiba Inu , 📚🎇
While we may observe upward candles as part of completing the current bearish phase, which I have clearly depicted on the chart, the potential for further decline remains. I foresee another drop of at least 30% for Shiba, with a primary target price of 0.00001120. The bearish channel is still active and may extend downward. Given this, it's crucial to implement a stop-loss strategy to mitigate any downside risk. Protect your investment by closely monitoring the market's behavior and adjusting accordingly. 📚✨
🧨 Our team's main opinion is: 🧨
There might be a short-term upward movement, but Shiba could still drop another 30% to around 0.00001120, so make sure to set a stop-loss to protect your investment.
Give me some energy !!
✨We invest countless hours researching opportunities and crafting valuable ideas. Your support means the world to us! If you have any questions, feel free to drop them in the comment box.
Cheers, Mad Whale. 🐋

EURAUD: Intraday Bearish Signal?!It appears that the EURAUD pair could continue to decrease in value.
I have observed a downward breakout of a bearish flag pattern on the hourly chart following a retest of a support level that was recently broken.
My targets for this potential decline are 1.6591 and 1.6559.

Support and resistance zone: 202.68-211.77
Hello, traders.
If you "Follow", you can always get new information quickly.
Please click "Boost" as well.
Have a nice day today.
-------------------------------------
(SOLUSDT.P 1D chart)
Since it is a coin that has renewed its ATH, it may be natural for it to fall.
The key is whether it can receive support near the current support and resistance zone of 202.68-211.77.
-
This applies to coins where the gap between the HA-Low and HA-High indicators is unusually narrow.
Therefore, if it is supported and rises within the box range of the HA-Low indicator (173.33-218.71), it is expected to rise above the Fibonacci ratio point of 1.618 (297.94).
Otherwise, if it falls, it is expected to re-determine the trend by touching the M-Signal indicator on the 1M chart.
-
(SOLUSDT 1D chart)
I think it is also good to hold SOL coins as a long-term investment.
However, I think it is wise to increase the number of coins (tokens) held by increasing the number of coins (tokens) corresponding to profits, if possible, for all altcoins.
The reason is that the volatility is quite large.
I think the only way to stabilize your psychological state in this volatility is to increase the number of coins (tokens) corresponding to profits.
-
Thank you for reading to the end. I hope you have a successful transaction.
--------------------------------------------------
- Big picture
I used TradingView's INDEX chart to check the entire range of BTC.
(BTCUSD 12M chart)
Looking at the big picture, it seems to have been in an upward trend since 2015.
In other words, it is a pattern that maintains a 3-year upward trend and faces a 1-year downward trend.
Accordingly, the upward trend is expected to continue until 2025.
-
(LOG chart)
Looking at the LOG chart, you can see that the upward trend is decreasing.
Accordingly, the 46K-48K range is expected to be a very important support and resistance range from a long-term perspective.
Therefore, I expect that we will not see prices below 44K-48K in the future.
-
The Fibonacci ratio on the left is the Fibonacci ratio of the uptrend that started in 2015.
That is, the Fibonacci ratio of the first wave of the uptrend.
The Fibonacci ratio on the right is the Fibonacci ratio of the uptrend that started in 2019.
Therefore, this Fibonacci ratio is expected to be used until 2026.
-
No matter what anyone says, the chart has already been created and is already moving.
It is up to you how to view and respond to it.
Since there is no support or resistance point when the ATH is updated, the Fibonacci ratio can be appropriately utilized.
However, although the Fibonacci ratio is useful for chart analysis, it is ambiguous to use it as a support and resistance role.
The reason is that the user must directly select the important selection points required to create the Fibonacci.
Therefore, it can be useful for chart analysis because it is expressed differently depending on how the user specifies the selection point, but it can be seen as ambiguous for use in trading strategies.
1st: 44234.54
2nd: 61383.23
3rd: 89126.41
101875.70-106275.10 (when overshooting)
4th: 134018.28
151166.97-157451.83 (when overshooting)
5th: 178910.15
-----------------

Load the ADA boat !Not too much to say here , the chart patterns speak for themselves.
Do check ADABTC where you can see a reversal is imminent.
Happy trading !

Bitcoin Double Top Forming(Neckline is 92K so wait for breakout)As we can see until now Price test ATH resistance zone Two times and we have Strong support zone near 92K$ so we may have Double Top forming here which is strong Reversal structure and after the neckline support break to the downside this structure is completed and will cause huge dump and fall to the downside like the arrows mentioned on the chart.
Notice: only if the ATH resistance break successfully then this scenario is invalid and price can see more gain to the next possible ATH mentioned on the chart.
DISCLAIMER: ((trade based on your own decision))
<<press like👍 if you enjoy💚

long term DOT forecast based on ETH patternPolkadot will update its ATH, but the time targets may be different

GOLD → The trend is not broken, gold could go even higherFX:XAUUSD continues to strengthen after a small correction. There is a zone of interest ahead and the price may form a correction to the support before it starts to storm ATH
Gold is rising due to the growing risks on the background of the tariff war started by Trump. Despite the risks posed by the US residents as well, he is willing to continue to do so. In addition, his comment about the Fed, “The Fed made the right decision last week to hold off on cutting rates” gave aggressive support to the dollar, but that didn't break gold, which is heading for the highs. The trend is not broken and interest in the metal due to growing risks is also growing. The focus is on US and Chinese economic data as well as Fed statements.
Technically, the support in the form of the previous ATH - 2790 plays a key role and gold may test this area once again before continuing its growth. But, in the short term, it is worth keeping an eye on 2800.
Support levels: 2795, 2790
Resistance levels: 2802, 2808
There may be a small correction from 2802 or from 0.7-0.79 fibo before the price decides to storm this area again to consolidate above the support before rising further.
Regards R. Linda!

Sell it now!If XAU hold here . we are facing down to 2737
sell now @ 2841 with only 90 pips stop and a HUGE profits ...

Gold could start a correctionYesterday, after an intraday correction during the Asian session, OANDA:XAUUSD bulls regained control and pushed the price to a new all-time high of 2830.
Since the start of the year, gold has been trading within a tight ascending channel.
Given that the price touched the upper boundary of this channel yesterday, a test of the lower boundary could be expected next.
At the time of writing, the price is hovering around minor support, and a break below this level could expose the 2770 zone.
Despite the strong uptrend, my strategy is to sell into rallies—though this approach carries significant risk.
A new all-time high would invalidate this scenario.
