DIVERGENCE CHEATSHEETHello dear traders and investors community!
The Divergence Cheat Sheet
Divergence occurs when the price of an asset and an indicator, such as the Relative Strength Index (RSI), move in opposite directions. This pattern provides valuable insights into potential price reversals or changes in trends.
Detecting Divergence
Detecting divergence is crucial for identifying lucrative trading opportunities. By using divergence indicators like the RSI, MACD, or Stochastic Oscillator, we can gain significant insights into market trends and potential price reversals.
To pinpoint divergence effectively, follow these steps:
Choose an indicator capable of detecting divergence, such as the RSI, MACD, or Stochastic Oscillator.
Look for discrepancies between the indicator and the price action. Regular divergence occurs when the price and the indicator move in opposite directions, while hidden divergence occurs when they move in the same direction but at different rates.
Monitor the direction of the trend. Divergence can indicate a trend reversal, so keeping track of the current market trend is crucial.
Confirm the divergence signal with other technical analysis tools. Divergence is just one piece of the puzzle, so it's essential to use other indicators to validate your trading decisions.
Examples of Divergence in Trading Charts
Let's examine a few examples of divergence on Bitcoin charts:
Strong Bullish Divergence:
When lows of the price decreases while the RSI increases, a regular bullish divergence occurs. This signals a potential trend reversal and presents an opportunity for a bullish trade.
Strong Bearish Divergence:
When highs the price of an asset is rising while the RSI is falling, it indicates a regular bearish divergence. This suggests a potential trend reversal and presents an opportunity for a bearish trade.
Medium Bullish Divergence:
When the lows of an asset remain equal while the RSI is rising, it indicates a medium bullish divergence. This suggests a potential increase in price, although it may not be a strong upward movement.
Medium Bearish Divergence:
When the highs of an asset remain unchanged while the RSI is decreasing, it indicates a medium bearish divergence. This suggests a potential decline in price, although the downward movement may not be significant.
Weak Bullish Divergence:
When the lows of an asset is decreasing while the RSI lows is equal, it indicates a weak bullish divergence. This suggests a potential increase in price, although it may not be a strong upward movement.
Weak Bearish Divergence:
When the highs of an asset are rising while the RSI remains unchanged, it indicates a moderate bearish divergence. This suggests a potential decline in price, although the downward movement may not be significant.
Hidden Bullish Divergence:
Hidden bullish divergence occurs when the price creates higher lows while the RSI is creating lower lows. This reinforces an existing uptrend and suggests its strength.
Hidden Bearish Divergence:
Hidden bearish divergence is observed when the price forms lower highs while the RSI forms higher highs. This indicates a potential weakening of the current uptrend and might signal a trend reversal or a pullback.
By recognizing these divergence patterns on trading charts, we can gain insights into potential market reversals, entry and exit points, and adjust trading strategies accordingly.
To effectively incorporate divergence into your trading, consider the following steps:
Identify the appropriate indicators: Choose reliable indicators such as RSI, MACD, or Stochastic Oscillator that can detect divergence patterns effectively.
Learn to spot divergence: Familiarize yourself with the different types of divergence patterns and practice identifying them on price charts. This will help you develop a trained eye for spotting potential trading opportunities.
Confirm with additional analysis: While divergence can provide valuable signals, it's essential to use other technical analysis tools to confirm your trading decisions. Look for supporting indicators, chart patterns, or trendline breaks that align with the divergence signal.
Set clear entry and exit criteria: Define your entry and exit points based on the divergence signal and your risk tolerance. Consider using stop-loss orders and take-profit levels to manage your trades effectively.
Practice risk management: Implement proper risk management techniques, such as position sizing, to protect your capital. Divergence alone should not be the sole basis for your trading decisions but rather an additional tool in your arsenal.
Backtest and refine your strategy: Test your divergence-based trading strategy on historical price data to assess its effectiveness. Make adjustments as needed and continuously monitor and evaluate your results to improve your trading approach.
Remember, divergence analysis is not foolproof and should be used in conjunction with other technical analysis methods and market factors.
Divergence analysis is a powerful tool that can provide us with an edge in the cryptocurrency market. By understanding and effectively utilizing divergence patterns, we can identify potential trend reversals, improve entry and exit timing, and enhance overall trading strategy. Incorporate divergence analysis into your trading approach and combine it with other technical indicators and risk management techniques for a well-rounded and informed trading strategy.
Rsidivergence

Bitcoin👀Hello guys
on the four and a half hour time frame with a short-term view; We can have a price correction up to the range of $26,665.
This upward trend line that is clear in the chart is related to higher time frames.
If the purple range ($29088) is completely consumed (which is highly likely), we will have a price correction in the lower time frames to the trend line range.
Approval of this process has been issued by Ichi Moku!
If the $32,578 range is completely consumed before the bearish trend begins, the situation will become very attractive.
What do you think?

Riding the Bullish WaveAmidst the whirlwind of events, the Euro-Dollar chart stands strong with a bullish trajectory. 📈 The weekly chart showcases a series of resolute highs, fortified by untested supports, painting an appealing canvas for potential buying opportunities. 🎨
Zooming into the daily chart, a pivotal support at 1.0834 shelters the bullish sentiment. A breach here could cast shadows on the prevailing optimism. However, the four-hour and one-hour charts echo a touch of bearish undertones, contrasting with the larger bullish narrative. 📉🕒
Within this landscape, the spotlight is on a possible buying chance, defying the bearish signals of the lower timeframes.
Back on the weekly chart, attention focuses on 1.1232 as a battlefield for counter-trend short positions. Conversely, trend traders set their sights on 1.0698, a fortress for ultimate pullback aspirations. On the daily chart, anchored on support, a magic candle confirmation beckons before diving into trades. 🛡️🕯️
Shifting gears to the four-hour chart, a bullish bat pattern is poised, brimming with confirmation yet diving deeper. Patient traders await a trend line breach and RSI divergence as signs for opportune action. 🦇📊
The one-hour chart reveals a potential shorting scenario through a bearish shark pattern. The saga unfolds from point C, advocating patience for the sell zone breach, a signal for bearish entry. 🦈

A Ticket to Ride: A Pathway to ProfitEmbarking on this trade has the potential to unlock substantial gains. The allure of this trading setup lies in its composition: a Bullish Gartley Pattern harmonizing with RSI Divergence. This synergy is reinforced by the prevailing weakness of the JPY. This confluence presents a promising opening, notably amplified by the market's respect for the support level.
Concerns about the Potential Reversal Zone (PRZ) being breached can be allayed. The candle that appeared to challenge it, in fact, constructs a Pattern Excursion Zone (PEZ). In simpler terms, think of it as a "Covered Support." As the name implies, this indicates that support remains intact – in this case, the PRZ remains unviolated.
In this endeavor, strategic planning is paramount: Plan Your Trade & Trade Your Plan. 📈📊
#TradingOpportunity 📉 #ProfitPotential 📈 #StrategicPlanning 📋 #MarketInsights 🌐
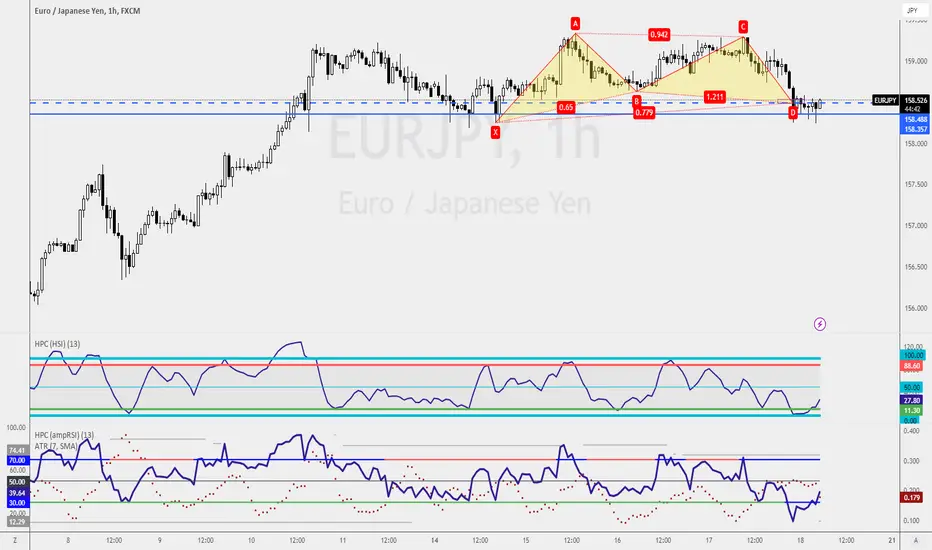
Bearish Shark Pattern with RSI Divergence🦈📉 Bearish Shark Pattern with RSI Divergence 📉🦈
Finally, the trade I've been patiently waiting for on EURJPY is here! 🚀 This one calls for a shorting opportunity, treating it as a pullback trade, a retracement trade.
Now, it's time to keep a close eye on how the market reacts when it reaches our first target at 154.25. 🎯 If the market respects this level and chooses to rebound upwards, we have our answer. But if it bashes through the blue box, then we know there's a higher chance of hitting our second target.
Make sure to follow my only account @raynlim for more updates and insights on the financial markets. Let's trade smart and seize the profit opportunity together! 💪💰

EURNZDhi,
eurnzd in an uptrend and continue its way. i leave some info to the chart.
take a stoploss
cy

SNXUSDTHello dear friends
✔️ The long-term downtrend line has been broken.
At the same time, we have a positive RSI divergence in the daily time frame.
✔️ The support range ($1,523) is well maintained.
❕ If the resistance range of $3.6, which is a very important area, is completely consumed, the situation will become very attractive for us.
Considering that LL has not been formed on the downward trend, if a higher high is formed in the lower time frame, it can be a short-term confirmation.
What do you think?

KOTAK is finally moving.1. Kotak Bank weekly chart. Has been a late mover, but has closed with a solid bullish bar at the 1980 resistance level after a bullish RSI divergence.
2. Breakout could lead to 2200 and all time highs thereafter.
❤ & follow for more.

EthereumLet's take a look at Ethereum.
The uptrend is well maintained for now. The price range of $1,609.41 has been preserved in the downward trend.
On higher time frames, if the $2173.14 resistance zone is fully consumed, we can have an attractive bullish trend.
On the lower time frames, the condition of the upward trend can be the consumption of the range of $1937.12.
The above view is valid on the condition of maintaining the range of $1609.41.

🔴 MATIC Hello Dear friends
The price chart on the daily time is below a downward trend line and so far this trend line has been preserved.
The indicator from RSI has issued a negative divergence on the four-hour time frame.
And as we can see, the resistance areas are not fully consumed. But we lost support areas in almost every corrective move.
Currently, it seems that the possibility of forming a corrective trend is much higher and the possibility of breaking the downward trend line from this range with this movement momentum is very weak.
What do you think?

Nifty could be very close to the end of the current rally.Points to note:
1. Bearish RSI divergence on the NIFTY daily chart.
2. Bearish engulfing formed.
3. Above average bearish volume.
Consolidation or reversal possible. Avoid fresh longs.
❤ & follow for more.

City Union Bank Bullish divergence.City Union Bank weekly chart, price has made a lower low, RSI has made a higher low. Bullish Divergence, could lead to consolidation or reversal. The down trend could end now. Keep watch.
Boost & follow for more.

USDJPY Trend Shift Short Trade SetupOn the 1 hour timeframe USDJPY has shifted from making higher highs and higher lows to barely making any higher highs and now broke the recent swing high.It also found resistance at an important level and made fake higher highs which immediately reversed.The uptrend has ran out of steam and a new downtrend has started.I believe it now a good time to take a short trade and profit from this downtrend as it is still early and at the time of writing this we have a retest at the previous support level that has turned to resistance.There is also a clear RSI divergence emphasising the bearish market.As for stop loss I recommend you set it at around the 141.760 level above the wick of the red candle and for take profit price previously struggled to break a resistance level at around the 140.240 level so this is where I have set my take profit.
This is not a financial advice.Always do your own research.

Counter-Trend Trading opportunityLow Risk, Good Return Trade
A Bearish Shark Pattern has shown up on the AUDUSD 4-hourly chart. As it is not the best trading setup but the second target produces a healthy Profit Factor of 2.
I've shorted the Shark Pattern as it coincides with the 1-hourly chart 3 drive formula.
This is possible because we use our in-house A.P.E framework and this is known as the combo trade.

Low Risk, High Return TradeA combo trade, this is what I call it.
A Bearish Shark Pattern appears on the M15 chart coinciding with the 1-hourly chart Wedge Pattern with a retest of resistance, allowing me to engage the trade base on the M15 chart but allow an extended target on the 1-hourly chart.
As good as it sounds, I'll be placing my stop loss as per usual and will not overtrade this.

A simple trading strategyEarning money can be as simple as waiting for the market to pull back to 0.6631 and waiting for a shorting opportunity.
Trading could be easy; what's not easy for most people is having the patience to wait for the trading opportunity.
They like to get involved in all moves. Mature traders will only wait for the best trading strategy and not get involve in every candlesticks move.
What kind of traders would you be?
Comment down below!!

A counter-trend move, is it a good ideaIf you have been following me for sometime, you would know that I've my bias in looking to long the US Dollar.
At this moment, there isn't such opportunity, but multiple shorting opportunity presents itself, in this moment, the bearish crab pattern, retest on the 4-hourly chart.
I will take the trade once the market has show the confirmation and will treat it as a counter-trend trade.

You can short as early as 1.0761If you are looking for the next shorting opportunity on EURUSD, you can engage the trade as early as 1.0761-1.0801 on the 4-hourly chart.

📊 3 Types Of DivergenceRSI (Relative Strength Index) is a commonly used technical indicator in trading that helps identify overbought and oversold conditions in the market. It measures the strength and speed of price movements and provides traders with valuable insights into potential trend reversals. When analyzing RSI, three types of divergences can be observed: regular, hidden, and exaggerated divergences.
📍Regular Divergence: Regular divergence occurs when the price and the RSI indicator move in opposite directions. There are two types of regular divergences: bullish and bearish.
📍Hidden Divergence: Hidden divergence refers to a situation where the price and the RSI move in the same direction, but the RSI signals a potential trend continuation rather than a reversal.
📍Exaggerated Divergence: Exaggerated divergence is a type of divergence where the RSI signal extends beyond the typical overbought or oversold levels. It suggests that the price is showing extreme momentum and could potentially experience a significant reversal.
In summary, regular, hidden, and exaggerated divergences in RSI analysis provide traders with valuable insights into potential trend reversals and continuations. By understanding these divergences, traders can make more informed decisions regarding their trading strategies and positions in the market.
👤 @AlgoBuddy
📅 Daily Ideas about market update, psychology & indicators
❤️ If you appreciate our work, please like, comment and follow ❤️

The Oldest Pair I've TradedDo you still remember those unforgettable moments when I first embarked on my trading journey with GBPJPY? It holds a special place in my heart as the very first pair I traded, and I stuck with it through the ups and downs until the spread for GBPJPY skyrocketed to 14 pips for an extended period. Oh, the memories!
Presently, GBPJPY finds itself in a captivating sideways movement, offering ample opportunities for those employing the support and resistance trading strategy. It's a perfect scenario for executing the age-old principle of buying low and selling high, or even exploring the realm of harmonic patterns.
Personally, I'm eagerly awaiting the completion of a bearish shark pattern at 173.23, signaling a potential shorting opportunity that aligns with my analysis.
Alternatively, you can choose to navigate the daily chart's defined zone, indicated by the red resistance line at 172.05 and the blue support line at 167.48. Within this trading range lies an enticing profit potential of 457 pips just waiting to be tapped into.
Join me as we delve into the timeless allure of GBPJPY and unleash the vast possibilities it holds for traders like us.

A Closer LookThe Intriguing Factors That Have Sustained My Interest in This Promising Buying Opportunity
When it comes to GBPUSD, my sights are set firmly on one direction: buying opportunities. The stage is set for a potentially lucrative trade, and I'm eagerly awaiting the perfect entry point.
On the 4-hourly chart, a retest of the trendline (right) holds the key to triggering a buying opportunity. As long as the price remains above the lowest trendline, a breakout could present an ideal entry. Alternatively, a break and close above the high at 1.2483 (also on the 4-hourly chart) could be the signal to jump in.
Delving deeper, the 1-hourly chart (left) offers additional scenarios for a potential buying opportunity. A retest of support at 1.2421 or a more significant level at 1.2395 could both serve as triggers for an entry.
But why this unwavering persistence? Let's turn our attention to the weekly chart, where a break and close above resistance becomes a compelling catalyst for my bullish stance. Although we remain within the sell zone, I'm already scouting for buying opportunities, anticipating a potential shift in momentum.
Now, what if I'm wrong? It's a calculated risk. I understand that hitting stops is a possibility, but I mitigate that risk by ensuring most of my trades have a profit factor of 2. This means I can maintain profitability with a 40% accuracy rate.
So, as the GBPUSD landscape unfolds, I remain resolute in my pursuit of buying opportunities, armed with strategic insights and a calculated approach to capitalize on potential gains.

EURUSD RSI Divergence - Bounce incoming?Simple idea here,
A) Touched the downward trendline, even if this turns out to be a downward channel this is the bottom of the range.
B) Deeply oversold on RSI ( <20 on both 1H and 2H ),
C) RSI divergence on the 1H
Just targetting a short term pullback here, short term Target 1.083 but potential for a runner up to the 1.09s.

One last SHOT!!If you have been following, you should know I've been getting into the long position on the AUDCAD to take a ride on the Weekly Chart's 5-0 Pattern.
If you aren't familiar with harmonic patterns,it means I'm looking to have a ride on the bullish trade from a mid to long-term perspective. (approx 2mths)
There are a couple of attempts, and not all went to loss, it fact I'm pretty profitable with these trading ideas when I didn't get what I want.
This is probably the last or the last is near for these trading ideas to work.
I'd engaged the bullish bat pattern on the 4-hourly chart and see if it able to take me to my final target for the 5-0 patterns and beyond.
