Log Chart Paints Bleak Picture for NVDAPrimary Chart: Daily Chart on Log Scale with Down Trendlines, VWAPs, and Key Price and Fibonacci Levels
Some may be feeling a bit giddy over the fact that NVDA has rallied 28% off the lows. But look at those other bear rallies since the all-time highs shown on the Primary Chart. How do we know this time will be different? Expecting it to be different before a dramatic shift in the macro environment, or before a serious change in trend structure, is like hoping a lottery ticket will somehow beat the astronomical odds against it.
This post is not asserting that traders can't make money on a bear rally. Countertrend trades, though lower probability trades that remain very tricky, can be a profitable part of a traders approach. For traders willing to see both the bearish and bullish side of markets this year, some of the bear rallies could have been exceedingly profitable even if only a portion of those rallies was caught by the trade.
A logarithmic chart of this former stock market leader NVDA reveals an even bleaker picture than the linear chart. A linear chart shows that NVDA is contending with some limited degree of success with a shorter-term down TL from March 29, 2022 through the mid-August 2022 highs.That has some validity and can be watched as well going forward. But given the sheer magnitude of the decline this year, it's worth paying heeding the log version (shown on the Primary Chart) as well. The log version shows the shorter down TL being some distance above where price is currently trading, meaning that NVDA has a fair amount more work to even start to *begin* to change its trend structure.
For comparison, here is the linear chart with the shorter of the two major down TLs shown:
Supplementary Chart A: Down TL from March 29, 2022
Sure, NVDA is rallying nicely off the YTD lows from mid-October 2022. And that rally should continue to be respected until it's confirmed to be complete. A good way to gauge the rally off the lows is to use an upward trendline—here a parallel channel is used, and the lower boundary of the channel is the upward trendline off the lows. Consider the following "zoomed-in" version of the chart using an intraday 130m price bar:
Supplementary Chart B: Parallel Channel from October 2022 Low
For now, price is well contained within that channel. Shorting does not make sense until good confirmation arises that this bear rally is finished. The VWAP anchored to YTD lows (orange) also may work as a guide for the short-term bear rally. It is prudent not to fight the rally until it's weakened or has reached a major resistance level and shown signs of weakening momentum or negative divergences.
SquishTrade will be continuing to monitor both NVDA and AMD for potential shorts should this rally gather a bit more steam. A key tell is that semiconductors have decisively undercut YTD lows in June, which creates a bearish pattern generally speaking.
What are some logical price targets for this rally? Before discussing targets, a bit of a disclaimer. Countertrend targets can be a little silly to discuss—a countertrend rally can fail at any time, so picking a price target is a bit like tossing a dart with one's eyes closed. But given the parallel channel and VWAP remain supportive of the rally so far, NVDA could continue to climb until it gets squished by the FOMC presser, CPI report, or disappointing earnings.
NVDA closed at $135 today, November 1. SquishTrade thinks NVDA has a reasonable probability of reaching $140.55 (the blue line on the Primary Chart that coincides with a major swing low). Only if $140.55 is exceeded, the next price target can come into play—which is $144.36, a key Fibonacci level. After that is the $145-150 gap fill area which will also coincide with the down TL from March 2022 (on a log chart) in the next week or so.
Just because these targets make sense does not mean that they should be traded, which depends on a person's risk tolerance, time frame, ability to use stops and manage risk as well as understanding of volatility.
________________________________________
Author's Comment: Thank you for reviewing this post and considering its charts and analysis. The author welcomes comments, discussion and debate (respectfully presented) in the comment section. Shared charts are especially helpful to support any opposing or alternative view. This article is intended to present an unbiased, technical view of the security or tradable risk asset discussed.
Please note further that this technical-analysis viewpoint is short-term in nature. This is not a trade recommendation but a technical-analysis overview and commentary with levels to watch for the near term. This technical-analysis viewpoint could change at a moment's notice should price move beyond a level of invalidation. Further, proper risk-management techniques are vital to trading success. And countertrend or mean-reversion trading, e.g., trading a rally in a bear market, is lower probability and is tricky and challenging even for the most experienced traders.
DISCLAIMER: This post contains commentary published solely for educational and informational purposes. This post's content (and any content available through links in this post) and its views do not constitute financial advice or an investment or trading recommendation, and they do not account for readers' personal financial circumstances, or their investing or trading objectives, time frame, and risk tolerance. Readers should perform their own due diligence, and consult a qualified financial adviser or other investment / financial professional before entering any trade, investment or other transaction.
Semiconductors

AMD ~ Heavy Demand Area AMD, the semiconductor leader, and monstrous Tech Company has taken a very big hit on its stock in the past 12 months. AMD Has issued guidance worries on demand woes and earlier, supply woes.
No matter these shorter-term issues that are going on within AMD, and in the Macro-Outlook of the Economy, AMD is attracting and will be attracting many buyers at these much more fair-valued prices.
As AMD has continued to fall it has hit a significant Trendline that has acted as strong support for the past year's downtrend. Along with this trendline tap, AMD continues to enter a major demand zone from pre-covid levels. The High $40s to $60 will remain a very demand-heavy spot for AMD as many buyers step in.
Long Term buyers and bounce Buyers are anticipating for a bounce off these trendlines, and possibly a bottom near this solid demand zone. AMD's p/e ratio has fallen dramatically to around 20, resigning a fair price to the company's stock rather than the high $100s.
Many Buyers will be seeing value at this price.
My thesis is that this can be a smart Long-Term Entry for scale-ins on the company's stock. Buying at these demand levels will carry lower risk/reward with AMD reaching fair value, and a huge demand zone.
I personally believe years out, this is a perfect acquiring zone to start!

SSG | Semiconductors Bear ETF | LONGThe fund invests in financial instruments that ProShare Advisors believes, in combination, should produce daily returns consistent with the fund's investment objective. The index is designed to measure the stock performance of U.S. companies in the semiconductors sub-sector. The fund is non-diversified.

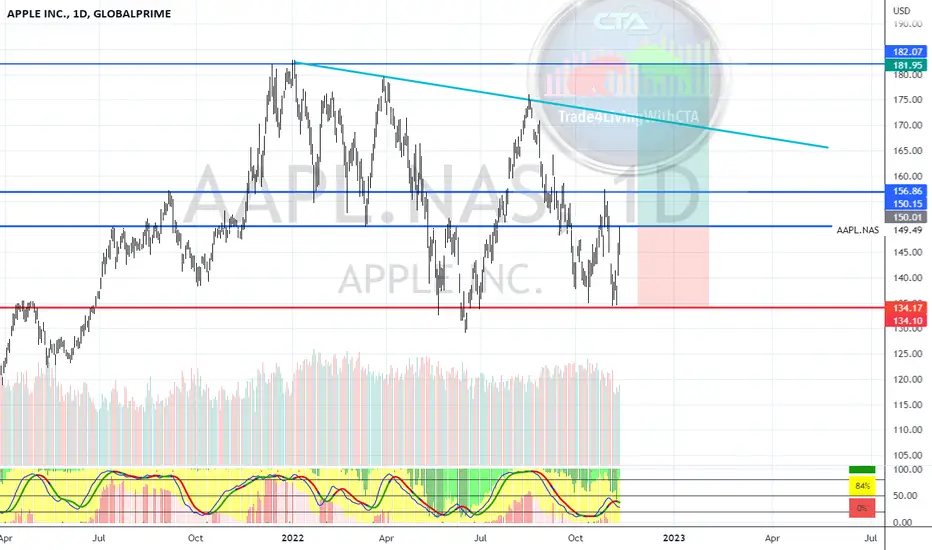
AAPL Simple Chart AnalysisAAPL looks strongly supported at 134 area. Trips bottom initiate the rebound & to continue from there, resistance require to breakthrough which might happen.
The risk ratio to win looks good too by winning 20% and losing 10% if to exit.
AVGO: Head and Shoulders?Broadcom
Intraday - We look to Buy at 457.26 (stop at 435.69)
A bullish reverse Head and Shoulders is forming. This is positive for sentiment and the uptrend has potential to return. The measured move target is 512.00. Dip buying offers good risk/reward.
Our profit targets will be 510.99 and 530.00
Resistance: 512.00 / 574.00 / 670.00
Support: 450.00 / 350.00 / 260.00
Please be advised that the information presented on TradingView is provided to Vantage (‘Vantage Global Limited’, ‘we’) by a third-party provider (‘Signal Centre’). Please be reminded that you are solely responsible for the trading decisions on your account. There is a very high degree of risk involved in trading. Any information and/or content is intended entirely for research, educational and informational purposes only and does not constitute investment or consultation advice or investment strategy. The information is not tailored to the investment needs of any specific person and therefore does not involve a consideration of any of the investment objectives, financial situation or needs of any viewer that may receive it. Kindly also note that past performance is not a reliable indicator of future results. Actual results may differ materially from those anticipated in forward-looking or past performance statements. We assume no liability as to the accuracy or completeness of any of the information and/or content provided herein and the Company cannot be held responsible for any omission, mistake nor for any loss or damage including without limitation to any loss of profit which may arise from reliance on any information supplied by Signal Centre.

BESI in a bull flag.BE SEMICONDUCTOR INDUSTRIES - 30d expiry - We look to Buy a break of 53.22 (stop at 49.98)
Prices have reacted from 38.46.
Short term bias has turned positive.
Short term momentum is bullish.
53.02 has been pivotal.
A break of bespoke resistance at 53.00, and the move higher is already underway.
Our outlook is bullish.
Our profit targets will be 60.84 and 63.84
Resistance: 53.00 / 55.40 / 59.00
Support: 50.00 / 47.30 / 45.60
Disclaimer – Saxo Bank Group.
Please be reminded – you alone are responsible for your trading – both gains and losses. There is a very high degree of risk involved in trading. The technical analysis , like any and all indicators, strategies, columns, articles and other features accessible on/though this site (including those from Signal Centre) are for informational purposes only and should not be construed as investment advice by you. Such technical analysis are believed to be obtained from sources believed to be reliable, but not warrant their respective completeness or accuracy, or warrant any results from the use of the information. Your use of the technical analysis , as would also your use of any and all mentioned indicators, strategies, columns, articles and all other features, is entirely at your own risk and it is your sole responsibility to evaluate the accuracy, completeness and usefulness (including suitability) of the information. You should assess the risk of any trade with your financial adviser and make your own independent decision(s) regarding any tradable products which may be the subject matter of the technical analysis or any of the said indicators, strategies, columns, articles and all other features.
Please also be reminded that if despite the above, any of the said technical analysis (or any of the said indicators, strategies, columns, articles and other features accessible on/through this site) is found to be advisory or a recommendation; and not merely informational in nature, the same is in any event provided with the intention of being for general circulation and availability only. As such it is not intended to and does not form part of any offer or recommendation directed at you specifically, or have any regard to the investment objectives, financial situation or needs of yourself or any other specific person. Before committing to a trade or investment therefore, please seek advice from a financial or other professional adviser regarding the suitability of the product for you and (where available) read the relevant product offer/description documents, including the risk disclosures. If you do not wish to seek such financial advice, please still exercise your mind and consider carefully whether the product is suitable for you because you alone remain responsible for your trading – both gains and losses.

Applied Materials: Another Lower High?Applied Materials has recently bounced along with other technology stocks. But some trend followers may look for it to roll over.
The first pattern on today’s chart is the line running along the highs of January and August. The chip-equipment stock is approaching that potential resistance area. Will it roll over again?
The most recent price action may have already answered that question. After all, Wednesday’s peak was $0.06 below its monthly high from October 6. The S&P 500, in contrast, made new highs last week versus earlier in the month. That may reflect a lack of relative strength.
Third, AMAT has been stalling at its 50-day simple moving average (SMA). Is the intermediate-term downtrend still in effect?
Finally, stochastics are back to an overbought condition.
TradeStation has, for decades, advanced the trading industry, providing access to stocks, options, futures and cryptocurrencies. See our Overview for more.
Important Information
TradeStation Securities, Inc., TradeStation Crypto, Inc., and TradeStation Technologies, Inc. are each wholly owned subsidiaries of TradeStation Group, Inc., all operating, and providing products and services, under the TradeStation brand and trademark. You Can Trade, Inc. is also a wholly owned subsidiary of TradeStation Group, Inc., operating under its own brand and trademarks. TradeStation Crypto, Inc. offers to self-directed investors and traders cryptocurrency brokerage services. It is neither licensed with the SEC or the CFTC nor is it a Member of NFA. When applying for, or purchasing, accounts, subscriptions, products, and services, it is important that you know which company you will be dealing with. Please click here for further important information explaining what this means.
This content is for informational and educational purposes only. This is not a recommendation regarding any investment or investment strategy. Any opinions expressed herein are those of the author and do not represent the views or opinions of TradeStation or any of its affiliates.
Investing involves risks. Past performance, whether actual or indicated by historical tests of strategies, is no guarantee of future performance or success. There is a possibility that you may sustain a loss equal to or greater than your entire investment regardless of which asset class you trade (equities, options, futures, or digital assets); therefore, you should not invest or risk money that you cannot afford to lose. Before trading any asset class, first read the relevant risk disclosure statements on the Important Documents page, found here: www.tradestation.com .

10/30/22 ONON Semiconductor Corporation ( NASDAQ:ON )
Sector: Electronic Technology (Semiconductors)
Market Capitalization: 29.235B
Current Price: $67.48
Breakout price: $68.50
Buy Zone (Top/Bottom Range): $66.65-$59.00
Price Target: $86.90-$88.50 (2nd)
Estimated Duration to Target: 84-90d
Contract of Interest: $ON 1/20/23 70c
Trade price as of publish date: $6.30/contract

Here's Why Marvell is a Great Investment OptionMarvell is a semiconductor company headquartered in Sunnyvale, California. It designs and manufacturers standard digital and mixed-signal integrated circuits solutions for various applications across multiple end markets. Marvell has been a steady performer in the semiconductor industry, with its stock price rising by almost 95% last year alone. It is also one of the most cost-effective micro-electro mechanical systems (MEMS) manufacturers with an exceptionally high return on equity.
Marvell is a Diversified Company
Marvell is a diversified company with a range of products across multiple verticals and applications. Its core business is semiconductor design and manufacturing, with its product lines also including storage, cloud infrastructure, wireless, wired connectivity, and industrial IoT. Marvell is also a diversified geographically, with a presence in North America, South America, Europe, Asia, and the Middle East. This diversification, along with its balanced product portfolio, makes Marvell a strong investment option. Marvell's diversified business model and product portfolio help to sustain its revenue stability, cash flow, and profitability through cyclical downturns in specific industries. In addition, a balanced geographic presence helps to reduce the risk of a single-market setback, such as a trade war, or a currency fluctuation.
Marvell has an Exceptional Return on Equity
A key indicator of a great investment option is its ROE, which is calculated by dividing the net income by the total equity on a company's balance sheet. Marvell's ROE is exceptionally high at 25%, which is one of the highest in the semiconductor industry. This high figure shows that Marvell is able to generate a lot of cash from its equity capital through its operations. This shows that Marvell has a very strong business model and can be expected to generate consistent growth in its stock price over the next few years. ROE is a great metric to identify strong investment options because high figures indicate that a company is able to tap equity at low cost. This means that the company has a strong business model and can grow its equity without taking on a lot of debt. This makes Marvell a great investment option as it can sustain high returns without compromising on its financial health and other metrics such as asset turnover ratio and profit margin.
Marvell is a Solid ROIC Company
ROIC is a metric used to determine the financial health of a company and its ability to generate a consistent return on investment for its shareholders. It is calculated by dividing the company's net operating profit by the equity on the balance sheet. Marvell's ROIC is high at 36.77%, which is one of the highest in the semiconductor industry. This means that Marvell is able to generate a large amount of cash from its operating activities and is able to sustain its operations without external financial assistance. A company can generate a higher ROIC by reducing its cost of operations. Marvell has been able to maintain a low cost of operation through its innovative manufacturing processes and cost-saving initiatives. This has led to an increase in the company's net operating profit and a high ROIC. This makes Marvell a great investment option as its high ROIC shows that it has a strong business model and can be expected to generate consistent returns for years to come.
Marvell Holds Strong Partnerships with Big Brands
Marvell is partnered with leading technology and semiconductor companies to design and manufacture its products. The company's partnerships include Wistron, Intel, Samsung, Microsoft, and Huawei. These partnerships make Marvell's products more marketable and ensure its customers are well-served. This significantly reduces the risk of a decline in Marvell's stock price as the company's customers are less likely to switch to another vendor. These partnerships also enable Marvell to share best practices and learn from its customers to refine its products and services. This is expected to enable Marvell to sustain its growth rate and profitability. This makes Marvell a great investment option as its partnerships are expected to generate higher returns and minimize the risk of a decline in its stock price.
Marvell's Shrink Manufacturing Processes
Marvell has been at the forefront of the semiconductor industry through its innovation in the manufacturing sector. The company has pioneered the use of the shrinks manufacturing processes, making it more cost-effective and efficient than its competitors. This has allowed Marvell to expand its product portfolio and diversify its customer base. It has also allowed Marvell to increase its profit margins and sustain its growth rate over the years. This makes Marvell a great investment option as it is expected to generate higher returns and expand its customer base as its products become more cost-effective than its competitors.
Marvell Has Been a Solid Performer in the Semiconductor Industry
The semiconductor industry is a volatile one that is subject to market conditions and economic conditions such as economic growth, inflation, interest rates, and political developments. Marvell has been a steady performer in this industry, with its stock price rising by almost 400% in 2020-21. This makes Marvell a great investment option as it indicates that the company has been able to sustain its profitability through these volatile conditions and generate consistent returns. This is expected to increase the company's stock price and sustain its profitability over the next few years as well.
Marvell's Balance Sheet Looks Strong
A company's balance sheet is an indicator of its financial health and its ability to generate cash flow. Marvell has a strong balance sheet, with a debt-equity ratio of 0.7, an asset turnover ratio of 1.39, a profit margin of 15.67%, and a free cash flow of $460 million. This makes Marvell a great investment option as the company can sustain its operations without external financial assistance and generate cash flow to repay its debts.
An Excellent Track Record of Acquisitions
A key metric that indicates a company's ability to expand its business is its ability to make strategic acquisitions. Marvell has an excellent track record of acquisitions, with the last acquisition being Nautics to expand its presence in the cloud infrastructure sector. This makes Marvell a great investment option as its acquisitions have allowed the company to diversify its product portfolio and expand its customer base. This is expected to generate higher returns and sustain the company's profitability.
Solid Free Cash Flow
Free cash flow is a metric used to determine the profitability of a company. It's calculated by deducting the operating expenses, such as the cost of goods sold, and financing expenses, such as interest on debt, from the company's revenue. Marvell has a high free cash flow of $460 million, which is expected to increase as the company continues to grow its revenue.
Conclusion
Marvell is a diversified company, Marvell has an exceptional return on equity, Marvell is a solid ROIC company, Marvell holds strong partnerships with big brands, Marvell's shrinks manufacturing processes, Marvell has been a solid performer in the semiconductor industry, Marvell's balance sheet looks strong, and Marvell has an excellent track record of acquisitions. In short, Marvell is a great investment option and is expected to generate consistent returns over the next few years.
Free Cash Flow
Valuation Metrics
EPS Estimates & P/E
MRVL Financials

wow. chips are cheap even with all these dollars.the semiconductor industry stocks are so far outside of what is fair value to the downside that by december 2023 its just a guarantee that we will be back up to the tope of monthly envelope.

Advanced Micro Gives a Class on CandlesticksAdvanced Micro Devices has done more recently than just plunge to its lowest level in over two years. It’s also given some interesting lessons on candlestick patterns.
The heavily traded chip had a thick red bar on October 7 after preannouncing weak quarterly results. The next session saw prices inch lower but remain in a tight range. On October 11, AMD made a higher high and lower low: an outside day. The 12th was just the opposite, with a small inside candle. Then another outside day (bullish), a bearish inside day on Friday and a positive inside candle on Monday. Tuesday and Wednesday saw another pair of outside and inside moves.
All those candles, on the heels of four weeks of solid downside, could potentially suggest prices are stabilizing. Is all the bad news priced in before CEO Lisa Hsu announces final numbers on November 1?
Next, the patterns occurred around $59. That level held AMD in check February and July 2020 before excitement about 7nm Ryzen chips triggered a breakout. Could old resistance be turning into new support?
TradeStation has, for decades, advanced the trading industry, providing access to stocks, options, futures and cryptocurrencies. See our Overview for more.
Important Information
TradeStation Securities, Inc., TradeStation Crypto, Inc., and TradeStation Technologies, Inc. are each wholly owned subsidiaries of TradeStation Group, Inc., all operating, and providing products and services, under the TradeStation brand and trademark. You Can Trade, Inc. is also a wholly owned subsidiary of TradeStation Group, Inc., operating under its own brand and trademarks. TradeStation Crypto, Inc. offers to self-directed investors and traders cryptocurrency brokerage services. It is neither licensed with the SEC or the CFTC nor is it a Member of NFA. When applying for, or purchasing, accounts, subscriptions, products, and services, it is important that you know which company you will be dealing with. Please click here for further important information explaining what this means.
This content is for informational and educational purposes only. This is not a recommendation regarding any investment or investment strategy. Any opinions expressed herein are those of the author and do not represent the views or opinions of TradeStation or any of its affiliates.
Investing in cryptocurrencies involves significant risks. Please click here for TradeStation Crypto’s risk disclosures on investing and trading in cryptocurrencies.
Investing involves risks. Past performance, whether actual or indicated by historical tests of strategies, is no guarantee of future performance or success. There is a possibility that you may sustain a loss equal to or greater than your entire investment regardless of which asset class you trade (equities, options, futures, or digital assets); therefore, you should not invest or risk money that you cannot afford to lose. Before trading any asset class, first read the relevant risk disclosure statements on the Important Documents page, found here: www.tradestation.com .

10/16/22 SMHVanEck Semiconductor ETF ( NASDAQ:SMH )
Sector: Miscellaneous (Investment Trusts/Mutual Funds)
Market Capitalization: $ --
Current Price: $173.15
Breakdown price (hold below): $173.40
Sell Zone (Top/Bottom Range): $185.00-$211.50
Price Target: $139.80-$134.50 (2nd)
Estimated Duration to Target: 60-64d (2nd)
Contract of Interest: $SMH 12/16/22 165p
Trade price as of publish date: $8.95/contract

SOXL might be overextended & blowing off soon; not yet but soonMonths ago, SOXL came into the radar, and as it broke out, it also failed along with the rest of the markets. There were many clear opportunities on both sides.
SOXL has more than halved its value since its last high. Is it over extended to the downside - yet?
Short of the lack of a higher low, and being way ahead of the curve, SOXL appears to be having a bullish divergence in both the Weekly and Daily charts. Notwithstanding, it is still in a deep downtrend. Just look at the Friday candle, it is a clear and present Dark Cloud Cover, which suggest more downside to follow.
Targeting the next and possibly last downside target is 5.60.
And then it might be time to watch for the price movement to realign to the bullish divergence, if it does when it reaches at that time.
But for now, it is just a heads up...
Stand by!

Semis Monthly Wave CountIt seems we are heading towards the dot com bubble highs. This is great support and will serve for the next build up.

The world no longer needs chips! LOLThis is in my opinion like buying oil stocks in the march 2020 crash. Semis to technology is like oil to transport. The world will not survive without either. So I place my long here today confidently regardless of the next few weeks or months. I will hold this until we re-reach our previous ATH which will be sooner than most anticipate. I expect by 2025 this will rereach those highs and achieve a much higher value by 2030. This is a serious chance to change your wealth status. Buy red sale green as always this is not financial advice. Do not be short-sided with this dip. Get in front of big money. Retail is gone from the markets, now all that is left is big money to choose their picks... high probability this bounces soon major.

$AMD Analysis, Key levels, and Targets $AMD Analysis, Key levels, and Targets
It is time to just be prepared on all levels… I’m labelling this long because these are my levels were I will be accumulating… I don’t accumulate haphazardly, I have very specific levels…
So even though I’m not doing anything right this moment, my levels are marked and ready to go….
These moves could have the potential to be really amazing and huge, but also really devastating if you don’t know what you’re doing or don’t have an ability to average down if necessary…
I don’t have a position right now, but will post when I do… and it shouldn't be long because honestly this is starting to look really attractive here…
IF you trade this let me know your thoughts….
I’m going through my entire stock list this week (definitely longer than a week) so sorry in advanced for blowing up your emails… This is where the opportunities are at, y’all…
—-
I am not your financial advisor. Watch my setups first before you jump in… My trade set ups work very well and they are for my personal reference and if you decide to trade them you do so at your own risk. I will gladly answer questions to the best of my knowledge but ultimately the risk is on you. I will update targets as needed.
GL and happy trading.
IF you need anything analyzed Technically just comment with the Ticker and I’ll do it as soon as possible…
it looks like semiconductors are busti imagine this down move in semiconductors is going to push mich lower, and soxs is a long at these levels into the upper 70s. the signal moving average is green on this inverse.

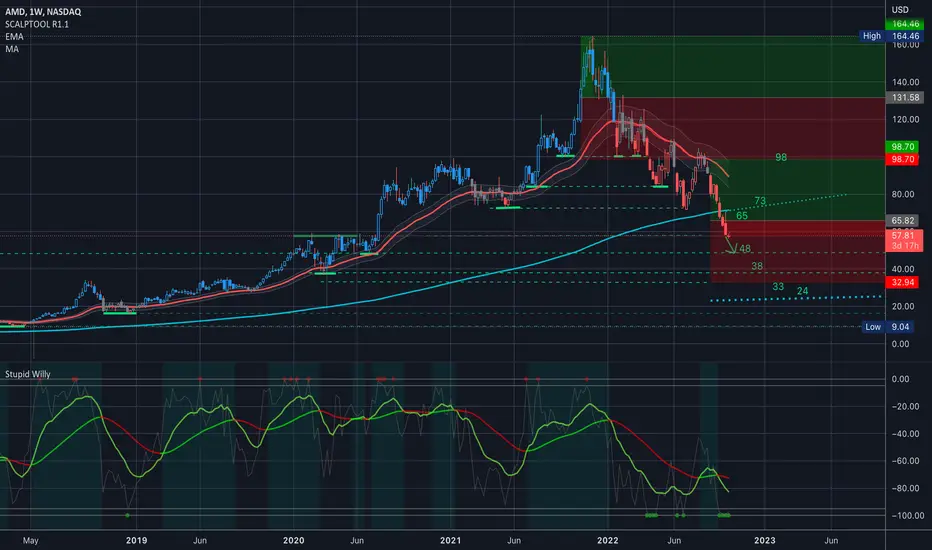
AMD going after 2020 H&S that was ignored due to tech bubbleAMD formed a H&S topping pattern & has since broke below 100 psychological level & the neckline. It wants to retest 75, the neckline of a 2020 H&S that was bypassed because of the tech bubble. If the 75 neckline does not hold, the measured move may see a low of 49 or even a little lower.( due to the bigger H&S from ATH)
However, it will be good to start averaging down in the 64 to 49 zone because of the many Fib levels in
this area which may offer support.
Shortterm bearish but longterm bullish. Semi-conductor & memory chips will benefit from the gaming, Metaverse, AI, Automation & EV boom.
Not trading advice

Intel up 4%, files to IPO its Mobileye self driving car divisionApparently, Intel has an ace up its sleeve. It owns a self driving car division called Mobileye and seeks to file for IPO. Mobileye valuation could range between 30-50 billion, while current market cap on Intel is around 100billion.

SOXL / SMH - CREATING A BULLISH REVERSALBACKGROUND:
SOXL (3x ETF) created a great reversal pattern back in JUNE - JULY 2022. It's tempting to ignore it because it ultimately failed on 8/26/22. Nonetheless, it was a great technical entry point when the price broke above $17.
CURRENT PRICE ACTION:
The reason I'm pointing out what happened in JUNE - JULY is because SOXL ETF is forming another BULLISH reversal (early stage) having just passed above last Friday's (9/30) high and entering back into the $9.50 - $10.50 range. The two previous reversals (8/26, 9/13) had failed. Yet the job of a trader is to not HOPE or PREDICT, but rather TRADE the signals and MANAGE RISK ACCORDINGLY .
GAMEPLAN:
I'm watching if the price closes above $10.35 (approx.) within the next few days. I'm anticipating some price action around this level. Any close above $10.35 can follow with some pullback. In fact this is a GREAT entry point for the bears if we were to follow trend alone. However, the reversal that happened from $9.50 and the bounce that's happening on the NASDAQ (potential double bottom) can signal a potential reversal in the market (short-term).
There are two potential bullish reversal scenarios:
1. Straight up(rare)
2. Chop sideways and build a larger reversal base (as happened in JUNE - JULY)
LOOK-OUT FOR:
What comes out of the FED emergency meeting. As mentioned in my previous post on the status of the DOW JONES - I think the analysts at the FED see the same. The FED will either blink and change its' stance or the market is taking another big leg down...
Be safe all and thank you for reading.

Qualcomm (QCOM) bearish scenario:The technical figure Descending Triangle can be found in the daily chart in the US company Qualcomm (QCOM). Qualcomm is an American multinational corporation. It creates semiconductors, software, and services related to wireless technology. It owns patents critical to the 5G, 4G, CDMA2000, TD-SCDMA and WCDMA mobile communications standards. The Descending Triangle broke through the support line on 30/09/2022. If the price holds below this level, you can have a possible bearish price movement with a forecast for the next 80 days towards 98.71 USD. Your stop-loss order, according to experts, should be placed at 152.81 USD if you decide to enter this position.
Looking at its valuation, Qualcomm is holding a Forward P/E ratio of 9.6. For comparison, its industry has an average Forward P/E of 17.45, which means Qualcomm is trading at a discount to the group.
It is also worth noting that QCOM currently has a PEG ratio of 0.61. This metric is used similarly to the famous P/E ratio, but the PEG ratio also takes into account the stock's expected earnings growth rate. QCOM's industry had an average PEG ratio of 1.81 as of yesterday's close.
Risk Disclosure: Trading Foreign Exchange (Forex) and Contracts of Difference (CFD's) carries a high level of risk. By registering and signing up, any client affirms their understanding of their own personal accountability for all transactions performed within their account and recognizes the risks associated with trading on such markets and on such sites. Furthermore, one understands that the company carries zero influence over transactions, markets, and trading signals, therefore, cannot be held liable nor guarantee any profits or losses.

Many Megatrends Depend on Semiconductors. Governments are competing with each other to ensure stable future supplies
The phrase ‘chip shortage’ has made quite an impression1.
- The US has earmarked an enormous one-time sum, $77 billion, in subsidies and tax credits to boost chip production within the US
- China is prepared to spend more than $150 billion through 2030
- South Korea is poised to offer an array of incentives over the coming five years, valued at roughly $260 billion
- The European Union (EU) is seeking to spend $40 billion
- Japan is seeking to spend $6 billion
In 2021, revenues in semiconductors were $553 billion, and are expected to grow to $1.35 trillion by 2030. Roughly three-quarters of chip-making capacity is in China, Taiwan, South Korea and Japan. The US only sits at about 13%, whereas the EU sits at roughly 9%2.
All chips are not the same
The Covid-19 Pandemic has shown different economies the importance of securing the supply of semiconductors. One thing to note is that there is a wide variety of semiconductors, and some countries are seeking to secure one type of supply over another. China’s push is aimed less at the cutting edge and more at being a higher volume player in the essential part of the market for lower priced but still important chips3. Some necessary chips that inhibit the production of automobiles, for example, could be valued at $1 dollar or less on a per-unit basis4, far from the most cutting edge in the space.
Company results are showcasing both successes and failures
Intel reported that Q2 earnings that received a bleak reception, with revenue falling 17% relative to Q1 of 2022. This was the worst sequential quarter-to-quarter revenue performance going back to the year 2000. Intel also noted a delay to its next generation server chip, Sapphire Rapids, and that its data centre chip business would grow slower than the overall data centre market for two years5. This compares to Taiwan Semiconductor Manufacturing Company (TSMC) growing revenue 37% and profit by 76% year-over-year6.
Earlier in 2022, Samsung reportedly lost its two biggest foundry customers, Qualcomm and Nvidia, to TSMC. Reports indicate that they were not satisfied with Samsung’s capability in the 4 and 5-nanometre space, which represents the current cutting-edge in semiconductor manufacturing. TSMC captures greater than 50% of foundry market share, operating at a market share level roughly three times that of Samsung. Still, Samsung did hold a recent ceremony to celebrate its first shipment of 3-nanometre chips, hitting this milestone faster than TSMC7. In contrast, it is estimated that roughly 25% of TSMC’s business is from Apple, and then Nvidia, Qualcomm and Advanced Micro Devices (AMD) are estimated to provide about another 5% each8.
Capital expenditures set companies up for future growth
TSMC is also investing at an incredible clip, aiming to spend up to $44 billion in 2022 compared to Samsung’s $12 billion, even if Samsung has announced a spending plan to total $151 billion between now and 20309. Intel has announced in its most recent, admittedly tough, quarterly results a plan to cut planned capital expenditures in 2022 by 15% to a level of $23 billion10.
Samsung is also facing competition in the dynamic random access memory (DRAM) business, as Micron and SK Hynix have introduced some of the most advanced chips for these purposes. Still, even amidst the competitive onslaught, Samsung’s DRAM market shares sit at about 40%. In the smartphone application processor market, Samsung’s market share was 6.6%, compared with Qualcomm at 37.7%, MediaTek at 26.3% and Apple at 26%11.
Time to invest?
Semiconductor companies tend to follow a particular rhythm, seeing strong demand, making investments, increasing supply, hitting levels of oversupply in certain types of chips, then waiting for the market to re-attain something closer to equilibrium. Today, we may be at the tail-end of the ‘chip shortage’ and it may not, at least in the short run, be the time to expect an immediate performance pop in the share prices of most semiconductor companies.
However, any megatrend that touches technology in any way requires semiconductors to function—in a sense if any of them grow, the demand for necessary semiconductors will also grow. Having a multi-year time horizon could be of greater interest, in our view. Since not all semiconductors are the same, it is also worth recognising that different companies may be more associated with different megatrends—for instance, certain companies are doing more in Artificial Intelligence (AI) model training space, whereas others are doing more in the industrial and automobile space. The supply/demand balance within different types of semiconductors will not necessarily be the same.
Sources
1 Source: Sohn, Jiyoung. “The U.S. Is Investing Big in Chips. So Is the Rest of the World.” Wall Street Journal. 31 July 2022.
2 Source: Sohn, 31 July 2022.
3 Source: Strumpf, Dan & Liza Lin. “China Bets Big on Basic Chips in Self-Sufficiency Push.” Wall Street Journal. 24 July 2022.
4 Source: Gallagher, Dan. “No Quick Fix for Auto Chip Shortage.” Wall Street Journal. 9 February 2021.
5 Source: Kim, Tae. “Intel Stock Will Plunge Further, Analyst Says, after ‘Worst’ Quarter He Has Ever Seen.” Barron’s. 29 July 2022.
6 Mellow, Craig. “Taiwan Semi’s Spending Spree Will Pay Off Big in the Long Term.” Barron’s. 29 July 2022.
7 Source: Jung-a, Song & Christian Davies. “Samsung seeks to reassure markets over semiconductor competitiveness.” Financial Times. 30 July 2022.
8 Source: Craig, 29 July 2022.
9 Source: Jung-a, 30 July 2022.
10 Source: Gallagher, Dan. “Intel Shows Limits of Chips Act.” Wall Street Journal. 29 July 2022.
11 Source: Jung-a, 30 July 2022.
This material is prepared by WisdomTree and its affiliates and is not intended to be relied upon as a forecast, research or investment advice, and is not a recommendation, offer or solicitation to buy or sell any securities or to adopt any investment strategy. The opinions expressed are as of the date of production and may change as subsequent conditions vary. The information and opinions contained in this material are derived from proprietary and non-proprietary sources. As such, no warranty of accuracy or reliability is given and no responsibility arising in any other way for errors and omissions (including responsibility to any person by reason of negligence) is accepted by WisdomTree, nor any affiliate, nor any of their officers, employees or agents. Reliance upon information in this material is at the sole discretion of the reader. Past performance is not a reliable indicator of future performance.

large cap semiconductors carrying market lower or highernasdaq us large cap semiconductors are carrying big tech right now. if they drag the market lower im bearish on the broader market. if we bounce in this group especially NVDA and AMD i think were headed for a test of the weekly lower high around 5500 translating to a $15 SOXL. if we bearflag, and head lower id imagine were in for much more of a drop. the pivot is dashed and upper/lower horizontals are solid lines. the extended line rising is the recent low linked to the all time low. if we break below this range its bearish for SOXL and the market in general.
