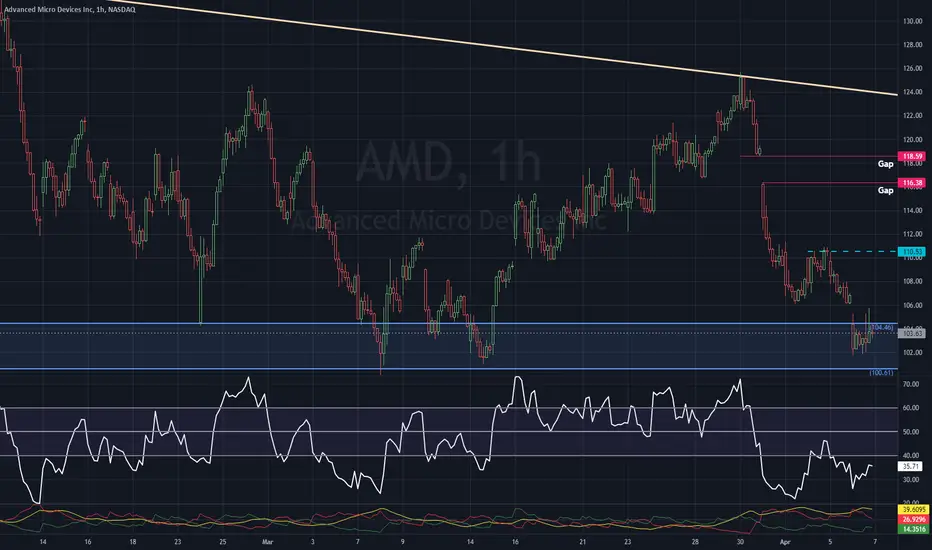
amd back into downtrendbreaking this t/l support looking to a make a move back to demand where we previously made a double bottom which we will see whether we bounce and get ready for next run or we lose demand and we make more lows
Semiconductors

semiconductors likely have some continued downsidesoxl is pretty much plummeting if we get a significant gap down and cant set a higher low 4hr the 15 minute trend will continue downwards until the 4hr is bullishly diverged stoch, rsi a lot of people are covering, and that may lead to some squeeze, but the over all trend is down if we close gap from either direction, and it looks like it is setting a lower high 4hr i would continue to sell semis. if we close gap from either direction and it looks like the test was sucessfuly holding some higher low around the thursday close its more bullish intermediate term but id imagine this is finding a daily lower high even if it recovers some or corrects sharply only to fall again.
22.04, 21.74, 21, 20.76, 20.22 key levels right now SOXL.

the 4 hr is at critical .5 level and oversold stochfib of bounce gives us about 50% retracement if there is some recovery to tighten in range we could look back up at 22.23-22.48 setting a daily higher low if market decides to gap up friday. if vwma keeps rising and trama flattens out we will have a bounce in semis. if these indicators keep bearish divergence we are likely continuing lower in broader markets. $23 is still a critical level for this trade. $20.96 is the next level if we continue this pop down. semis started this correction only they can get it out.

AMD A case of the higher lows in effect here.
As long as the $99 region holds, we can see $110-$120 next
The next buy zone is the $100-102 region.
If $99 fails., we go back to retest the $91-$93 region.

retraced weekly to .618theres an unfinished bounce going on in semiconductor stocks short squeeze could start over the 189 area and wind up touching 224
weekly picture still hasnt changed to bull, but its possible we hold these lows and see retracement backtest if we hold 152.84
impulse wave up seems like it led to correction wave and that is just about complete

AMD:Bear market rally or turnaround?Advanced Micro Devices
Short Term - We look to Buy at 95.03 (stop at 83.57)
Although the bears are in control, the stalling negative momentum indicates a turnaround is possible. The trend of higher lows is located at 90.43. This is positive for sentiment and the uptrend has potential to return. We look to buy dips. Further upside is expected.
Our profit targets will be 125.60 and 133.11
Resistance: 125.60 / 140.00 / 157.50
Support: 93.50 / 84.00 / 72.30
Please be advised that the information presented on TradingView is provided to Vantage (‘Vantage Global Limited’, ‘we’) by a third-party provider (‘Signal Centre’). Please be reminded that you are solely responsible for the trading decisions on your account. There is a very high degree of risk involved in trading. Any information and/or content is intended entirely for research, educational and informational purposes only and does not constitute investment or consultation advice or investment strategy. The information is not tailored to the investment needs of any specific person and therefore does not involve a consideration of any of the investment objectives, financial situation or needs of any viewer that may receive it. Kindly also note that past performance is not a reliable indicator of future results. Actual results may differ materially from those anticipated in forward-looking or past performance statements. We assume no liability as to the accuracy or completeness of any of the information and/or content provided herein and the Company cannot be held responsible for any omission, mistake nor for any loss or damage including without limitation to any loss of profit which may arise from reliance on any information supplied by Signal Centre.

Nice trade idea for SOXX! Semiconductor companies offer a lot of highly liquid securities that encourage risk-taking in all time frames, from intraday scalping to monthly market timing. The sector also supports various profit strategies, including momentum trading, basket allocations and short selling. It acts independently in many market phases, going its own way while major indices push higher or lower. This divergent behavior brings additional opportunities, even in difficult macro conditions. There are many ways to trade the semiconductor space, from identifying particular stocks to investing in the sector as a whole using exchange-traded funds (ETFs).

Expanding Triangle - 520 breakout levelLRCX very bullish yet very volatile setup. I posted recently but have recognized my initial count was not correct. The correct count is the following:
- LRCX is completing the final leg of an Expanding Triangle as the 5th wave of a larger Expanded Flat, which is the wave 4 of a larger motive sequence that started a decade ago off the low around 31.17.
- the B wave of the Wave 4 expanded flat was its all time high of 731.85 in Jan 2022, which was a 1.418 extension of the A of EF (thus, the A of 4)
- There are multiple indications that Friday May 20 was bottom (f leg of expanding triangle, c of v of C of 4):
1) pinbar candle on the daily chart
2) showed support at the A level around 450 and at the same time found support at the downtrend off the Jan high - the pinbar tail got bought up quick at that 450
3) 3 counts down off the e leg completed Friday May 20 - it is currently on second count of 3 up
4) the retracement of B of expanding flat showed equality with the previous extension at about 1.418
*Minimum target is the upper trendline of expanding triangle around 520 (should test that this week and attempt breakout)
**Intermediate target if we get breakout is 548
*** Goal target is new All time high above 731 (estimating 786) to complete wave 5 of the bullish impulse by August-October of 2022.
I will post a bigger picture view idea to reference for the overall counts, this idea was meant to focus on the zoomed in expanding triangle which indicates breakout is imminent. Interesting that breakout attempt is aligning time wise with NVDA earnings May 25. If they beat it would likely provide catalyst for the inductry to run and LRCX perfect setup to move big up.
Best,
A. Crawley

Supplement to previous idea - BullishHere is the bigger picture for LRCX, as referenced in previous post on expanding triangle.
We are currently at the transition from f of C of 4 and for the reasons outlined in last idea it is likely that wave 5 of the larger impulse is about to begin (or began May 20), to summarize:
- wave 4 was an expanded flat with an ending expanding triangle as the 5th wave of C ~1.418 retracement off B (the Jan highs, which was a 1.418 extension of A)
- initial target is 522, which will be the breakout level from the expanding triangle (this attempt should unfold by end of this week in alignment with NVDA earnings. If it fails, it is likely to drop to lower support of expanded triangle around low-mid 430s; if breakout is successful it will continue to the following targets in route to complete 5th motive wave:
*Intermediate target range 548-low 600s, point target 567
** goal target range 732-786 (which will be wave 5, precise level tbd and will send update if we clear 522 and intermediate level is realized
Catalyst = witchkraft

oversold semiconductors (SOXL)if critical support provides meaningful buy volume and we close the week near the highs then semiconductors, and the broader market could exhibit a bounce here towards lower 36s. if we see another wave of selling down at these levels were probably blowing through that support on the weekly trending toward upper 16s taking the market with it as semiconductors are a lead bear. keep TRAMA from sinking and come out of oversold STOCH and we could diverge bullishly. if things head for continuation it is likely more bearish.

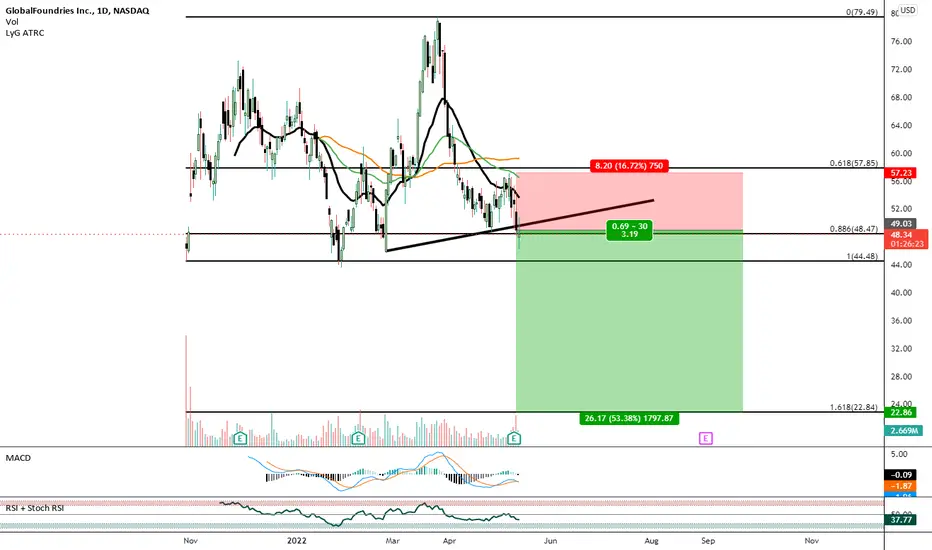
MACD Bearish Convergence Below Demand Line on GlobalFoundriesI have bought the Quarterly PUTs on this as i believe it is due for a 1.618 Retracement after it breaks through it's last support levels.
$AMD Update$AMD Update
So my buy order filled at 84.45… So I’m looking for 102.84 for 21.78% OR 66.06 to double my position….
There is a gap that was opened in July of 2020… that I also might add in….
Best of luck and have fun, y’all…
—-
I am not your financial advisor. Watch my setups first before you jump in… My trade set ups work very well and they are for my personal reference and if you decide to trade them you do so at your own risk. I will gladly answer questions to the best of my knowledge but ultimately the risk is on you. I will update targets as needed.
GL and happy trading.
IF you need anything analyzed Technically just comment with the Ticker and I’ll do it as soon as possible…

AMD - A Mighty Decline... to $18NOT SO BULLISH CASE
AMD today announced decent earnings and had a very good bounce off a small decline recently. Aided by less hawkish noises from the Fed mulling a 'soft landing', the market lapped it up - with AMD rallying almost 10% for the day. The reversal was quick and pronounced. With perhaps more juice to squeeze out of this green lime, it would need to reclaim and begin and sustain a new uptrend above $120 if the bull-trend is to continue.
BEAR CASE
With all that being said, there are many more reasons to be bearish . I therefore favour a short position in the region of $105, with a $120 stop-loss. Here is why:
1. TOP OF EXPONENTIAL CHANNEL
Firstly, there are an awful lot of similarities here when comparing us to May 1985. Beginning a recent breakdown below the 50 week MA trend line in the main chart, after a parabolic decade. We're also moving downwards generally from the top of the exponential channel. In the past, these movements have coincided with significant corrections for this stock as we'll explore. We recently lost the 50 MA, we've now just re-tested the underside of that, providing us with a great risk-reward entry of 8:1.
The bottom of the channel currently sits at $13 and a prior horizontal pivot point (dotted line) of $9 should also provide good support. Getting all the way to $13 would still represent a 82% decline from today's prices and 88% from all-time highs.
2. RSI BEAR ZONE
You'll also notice the 2nd indicator below, showing the RSI has just commenced and triggered a new bearish zone. Dropping below 40 on the weekly chart for the first time since November 2017. In future posts I will go into further detail as to how & why these custom indicators work. In the absence of this, it's still abundantly clear to see from prior periods in the RSI bear zone, that these have triggered significant declines over the years:
86% - May 1985 to November 1990 (5.5 years)
86% - July 2000 to October 2002 (2.5 years)
92% - May 2006 to December 2008 (2.5 years)
A decline of 82% from $105 to $18 should not be unexpected.
3. FRACTAL
Taking the same bar pattern from the 1975 to 1985 period and condensing it down into fewer years - we have generated similar logarithmic gains from 6 years instead of 10. This would also suggest a quicker but still slow'ish grind to the downside, potentially to as low as $18 by December 2025.
4. FUNDAMENTALS
With such huge shipping disruptions forthcoming in Asia, the market may still be unaware of the forthcoming impact on availability of product and therefore their manufacturing/foundry capabilities for the quarters ahead. On AMD's website discussing Supply Chain Responsibility, they reference that 80% of their manufacturing is done in Asia still to this day. They are very much dependent upon Taiwanese subcontractors. Even without any further deterioration in the conditions and the lockdowns in that part of the world, I would argue this as well as any other geopolitical issues have not been priced in to their forward performance. AMD is still priced to perfection.
Below are some of the risks they mention on their annual report, including many others (removed for readability):
Global economic and market uncertainty may adversely impact our business and operating results.
The loss of a significant customer may have a material adverse effect on us.
The ongoing novel coronavirus (COVID-19) pandemic could materially adversely affect our business.
The semiconductor industry is highly cyclical and has experienced severe downturns.
IT outages, data loss, data breaches and cyber-attacks could compromise our intellectual property or other sensitive information.
Uncertainties involving the ordering and shipment of our products could materially adversely affect us.
If we lose Microsoft ... our ability to sell our products could be materially adversely affected.
If we cannot adequately protect our technology or other intellectual property... we may lose a competitive advantage and incur significant expenses.
We rely on third parties to manufacture our products, and if they are unable to do so on a timely basis in sufficient quantities and using competitive technologies, our business could be materially adversely affected.
If essential equipment, materials, substrates or manufacturing processes are not available to manufacture our products, we could be materially adversely affected.
SUMMARY
As uplifting as the above sounds, there's an opportunity here for us. Let's come back and revisit this one in 6 months time. Even if you're not short, avoiding such a bad time to go long is advised! Crossing below the top of the green channel recently indicated to take profits and now we've just got a sell signal...so it's time to take it...

5/4/22 AMD Advanced Micro Devices ( NASDAQ:AMD )
Sector: Electronic Technology (Semiconductors)
Market Capitalization: 161.076B
Current Price: $99.42
Breakout price: $100.00
Buy Zone (Top/Bottom Range): $97.85-$84.75
Price Target: $113.80-$117.60 (1st), $138.30-$141.40 (2nd)
Estimated Duration to Target: 20-21d (1st), 38-40d (2nd)
Contract of Interest: $AMD 5/20/22 100c, $AMD 6/17/22 110c
Trade price as of publish date: $4.41/contract, $3.45/contract

AMD (Advanced Micro Devices) - Bearish Weekly Price DowntrendAMD (Advanced Micro Devices) stock price has been in a weekly downtrend, and is currently seeking a lower-low in the price.
If quarterly financial earnings and news this year are not satisfactory, AMD stock price could test support levels to the downside.
Bearish Price Targets: $85, $75, $65.
Head-and-shoulders chart pattern confirmed, loss of $100 price support level, breakdown of parabolic support curve -- all are bearish technical chart events.
All content is Not financial advice. Trade at your own risk.

SOXL close to a strong supportSOXL tracks the performance of the thirty largest U.S. listed semiconductor companies.
The semiconductor space is still hot, but the companies in the leveraged Direxion Daily Semiconductor Bull 3X Shares (SOXL) didn`t performed well against the inflation and raising interest rates recently.
I think SOXL is now close to the strong support of $21, pre-pandemic level, from which it can bounce to the $36 resistance.
Looking forward to read your opinion about it.

4/24/22 SMHVanEck Semiconductor ETF ( NASDAQ:SMH )
Sector: Miscellaneous (Investment Trusts/Mutual Funds)
Market Capitalization: $ --
Current Price: $234.73
Breakdown price (hold below): $237.35
Sell Zone (Top/Bottom Range): $241.85-$261.90
Price Target: $206.40-$204.00
Estimated Duration to Target: 67-72d
Contract of Interest: $SMH 6/17/22 200p
Trade price as of publish date: $4.35/contract

TSM - 5th leg down, 3 drive pattern SHORT CITYIt is in my humble opinion TSM is looking at a rather large drop looming ahead - symmetrically the pattern meets the harmonic qualifications as well as the elliot wave theory macro wave iterations.
It is possible TSM will make a small shoulder before breaking the $100 price level - should it break this level and close below I believe it will be a swift fall to the $85 level, however if it wasn't "quick" the position I hold does allow for some time.
Trade: 6/17 exp $85 PUTS @ 1.17 on 4/1 - currently trading at 1.62 at time of post

NVDA short should drop in price to 190-195NVDA SHORT 21/04/22 07:00 GMT
14 year old English trader trading on demo accounts currently gaining experience in the markets.
NASDAQ:NVDA should drop to around the 200-205 price mark because of many factors such as inflation, monetary policy tightening, and current market sentiment.
NVDA has been deeply affected by the current market sentiment dropping 19.65% in the last month. This large price drop was caused by many things such as inflation, inflation usually negativity impacts growth stocks and positively or neutrally impacts value stocks and as NVDA is a high growth stock it has some of the best growth aspects in its sector. So, inflation has caused a large downfall for NVDA and the way the fed is aggressively trying to combat inflation suggests there is a hard landing coming for the markets. Soring electricity prices has caused NVDA to have higher operating costs. One single semiconductor factor takes up 100 megawatts per hour and usually run between 10-12 hours in a day taking around 1,100 megawatts per day. Which means it could deeply affect their earnings this quarter causing their stock price to fall. NVDA will continue to drop because of these reasons and as the Ukraine war continues on NVDA earnings will continued to be affected. NVDA is a strong buy for longer term but during this bear market with potential of recession of 35% in the next to year (predicted by Goldman Sachs) and the aggressive fed combating inflation has never been done before without a full-blown recession which suggests a tough period for the market is coming as well as NVDA
Market wrap 9:00 GMT
NVDA is currently at 20.65 which I predicted earlier the chance that NVDA ends up in the positive quite high as it is classed as oversold by the RSI which could pick up a lot of potential buyers but I can see NVDA trading between 205-195 price region over the next few days. The main reason why NVDA’s stock dropped 6.05% today was because of the death cross which is when the 50-day moving average moves below the 200-day moving average which suggest this bear market is here to stay and NVDA’s stock will continue to drop. This suggest to us that this market is not going to be short term and as the us ten-year bond rose 2.93% today which will negatively impact stocks because they usually are inversely propionate. This is why I believe NVDA should drop even further to around the 190-195 price level which could be another opportunity for a buy position I believe over the next few days the stock could rally 3 or 4% which could be a good opportunity to short.
Semiconductors stocks such as AMD or intel. AMD has dropped by 22.05 % in the last month and suggests a strong sell signal as it hit below 90 per share today. Intel has dropped 2.03% in the last month but as it is a more mature company this is expected. This suggests to us that the semiconductor market is set to fall even further as the reason I mentioned early about high energy prices causing semiconductor companies to have a negative impact on their earnings. Causing people to take short positions in these companies. This also shows the impact of inflation on growth stocks as I talked about earlier
To conclude I do not believe that NVDA will have a complete trend reversal against the S&P in this current bear market and will continue to fall has an influx of negative news continues to be delivered on inflation and energy prices. As well as the increasing fear of a recession approaching.

4/17/22 AMATApplied Materials, Inc. ( NASDAQ:AMAT )
Sector: Producer Manufacturing (Industrial Machinery)
Market Capitalization: 100.142B
Current Price: $113.36
Breakdown price: $114.50
Sell Zone (Top/Bottom Range): $125.60-$136.95
Price Target: $97.20-$94.80 (4th)
Estimated Duration to Target: 40-44d (4th)
Contract of Interest: $AMAT 5/20/22 110p
Trade price as of publish date: $4.95/contract

AMD idea #1AMD currently trading below multi-month support. If it can get back and hold above 100, could test the top of regression channel.

AMD Bullish Short Term - SemiconductorsIn my last posts on AMD and video we were bearish on the stock calling for a much lower downward target; however, we want to take advantage or short term changes when opportunities present themselves. Therefore, you can have both bullish and bearish sentiments and outlooks -- trade what the markets give you.
Market Reversal Mid-day; Bear Markets still present. Today is setting up for a key reversal day after that last push into the mid day. This doesn’t mean the bear market reversal is in but it is potential short term importance.
I went long AMD around 3:45 before the close. I provide some insight into that reasoning in my video below and on #FB

AMD is in a neutral to bearish positionAMD is in an area where it has the capability to experience a minor upswing; however, that is based on the overall market conditions and the beatdown #SOX Semiconductor index. Both #NVDA and #AVGO had the largest pullbacks today (of those that I watch in this sector). The Semiconductor Index is well below the 200 day and 50 day moving averages, which is never a good sign, and today we see the NASDAQ-100 gap down to its 50-day area.
Market conditions are not idea and personally I think the march lows will be tested soon -- that is not to say we won't have any upward impulse moves for day trading opportunities. Overall, my sentiment is neutral to bearish on #AMD based on the current complexion of the overall markets, the semiconductor index, and technical conditions.