EURGBP: Trading Signal From Our Team
EURGBP
- Classic bearish setup
- Our team expects bearish continuation
SUGGESTED TRADE:
Swing Trade
Short EURGBP
Entry Point - 0.8632
Stop Loss - 0.8640
Take Profit - 0.8615
Our Risk - 1%
Start protection of your profits from lower levels
Disclosure: I am part of Trade Nation's Influencer program and receive a monthly fee for using their TradingView charts in my analysis.
❤️ Please, support our work with like & comment! ❤️
Short

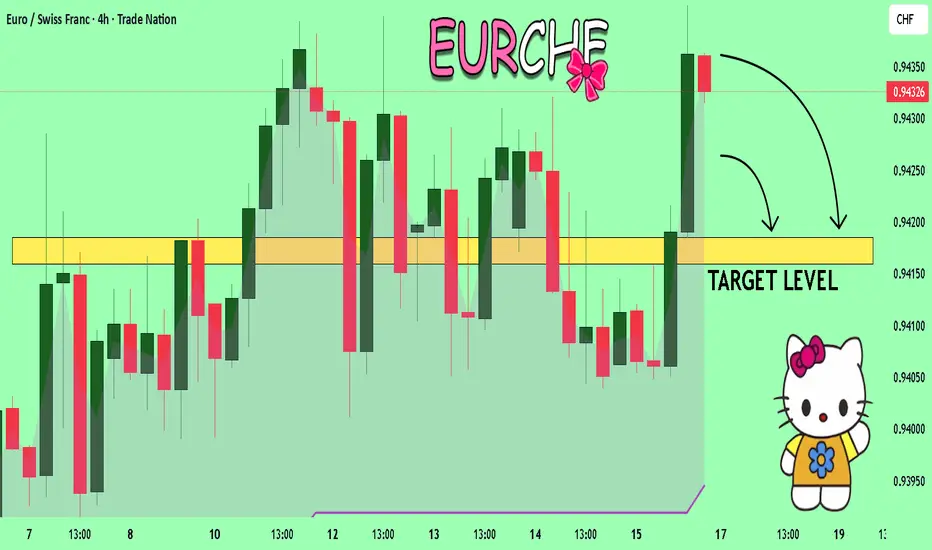
EURCHF What Next? SELL!
My dear followers,
I analysed this chart on EURCHF and concluded the following:
The market is trading on 0.9432 pivot level.
Bias - Bearish
Technical Indicators: Both Super Trend & Pivot HL indicate a highly probable Bearish continuation.
Target - 0.9418
About Used Indicators:
A super-trend indicator is plotted on either above or below the closing price to signal a buy or sell. The indicator changes color, based on whether or not you should be buying. If the super-trend indicator moves below the closing price, the indicator turns green, and it signals an entry point or points to buy.
Disclosure: I am part of Trade Nation's Influencer program and receive a monthly fee for using their TradingView charts in my analysis.
———————————
WISH YOU ALL LUCK
EURNZD: Bearish Forecast & Outlook
The price of EURNZD will most likely collapse soon enough, due to the supply beginning to exceed demand which we can see by looking at the chart of the pair.
Disclosure: I am part of Trade Nation's Influencer program and receive a monthly fee for using their TradingView charts in my analysis.
❤️ Please, support our work with like & comment! ❤️

EURUSD My Opinion! SELL!
My dear friends,
Please, find my technical outlook for EURUSD below:
The price is coiling around a solid key level - 1.1688
Bias - Bearish
Technical Indicators: Pivot Points Low anticipates a potential price reversal.
Super trend shows a clear sell, giving a perfect indicators' convergence.
Goal - 1.1662
Safe Stop Loss - 1.1701
About Used Indicators:
The pivot point itself is simply the average of the high, low and closing prices from the previous trading day.
Disclosure: I am part of Trade Nation's Influencer program and receive a monthly fee for using their TradingView charts in my analysis.
———————————
WISH YOU ALL LUCK

USDCAD Will Go Lower From Resistance! Sell!
Take a look at our analysis for USDCAD.
Time Frame: 4h
Current Trend: Bearish
Sentiment: Overbought (based on 7-period RSI)
Forecast: Bearish
The market is approaching a key horizontal level 1.379.
Considering the today's price action, probabilities will be high to see a movement to 1.375.
P.S
Please, note that an oversold/overbought condition can last for a long time, and therefore being oversold/overbought doesn't mean a price rally will come soon, or at all.
Disclosure: I am part of Trade Nation's Influencer program and receive a monthly fee for using their TradingView charts in my analysis.
Like and subscribe and comment my ideas if you enjoy them!

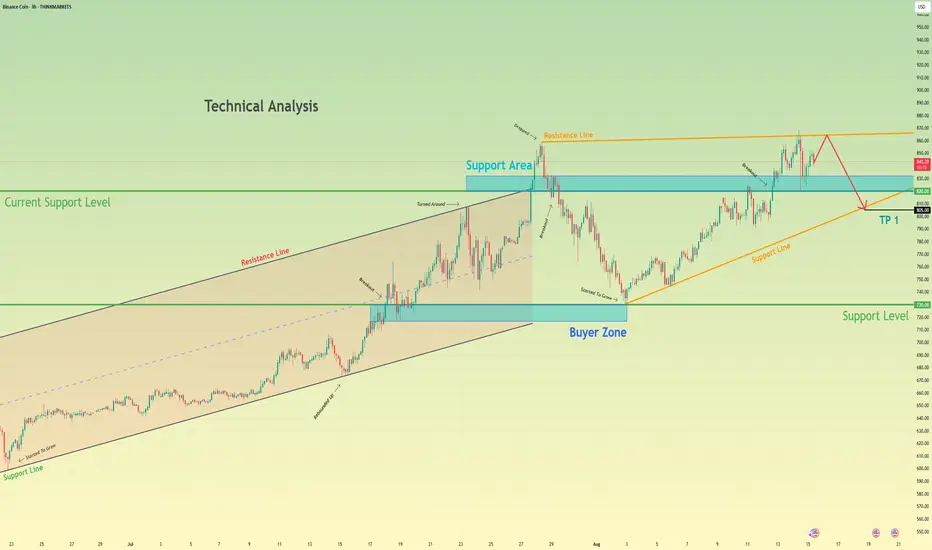
Binance Coin may drop to 805 points and break support levelHello traders, I want share with you my opinion about Binance Coin. The bullish momentum for BNB has been visibly accelerating, with the price transitioning from a steady upward channel into a steeper and more aggressive rising wedge formation. This change in character often suggests a late-stage trend that may be approaching exhaustion. The price action has been oscillating within this wedge, using the 820 level as a key support area for its most recent rebound. Currently, the asset is making another push towards the apex of the formation, approaching the final resistance line that has capped the highs. The primary working hypothesis is a short scenario, which is based on the typically bearish resolution of a rising wedge pattern. It is anticipated that the price will be rejected from the upper resistance line of the wedge, signaling the exhaustion of buying pressure. A confirmed rejection from this peak would likely trigger a sharp reversal, with enough momentum to cause a breakdown below the wedge's ascending support line and the critical horizontal support area around 820. This structural failure would validate the bearish thesis. Therefore, the tp for this anticipated reversal is logically placed at the 805 level, representing a prudent first target for the price to reach following a breakdown of the multi-week wedge structure. Please share this idea with your friends and click Boost 🚀
Disclaimer: As part of ThinkMarkets’ Influencer Program, I am sponsored to share and publish their charts in my analysis.
EURUSD TODAY ANALYSIS EURUSD today : waiting for a mitigation of the upper 4H and 15m POI and a clear liquidity sweep in order to take 15m swing low more probably until 4H swing low.

USDCAD: Bearish Continuation is Expected! Here is Why:
Our strategy, polished by years of trial and error has helped us identify what seems to be a great trading opportunity and we are here to share it with you as the time is ripe for us to sell USDCAD.
Disclosure: I am part of Trade Nation's Influencer program and receive a monthly fee for using their TradingView charts in my analysis.
❤️ Please, support our work with like & comment! ❤️

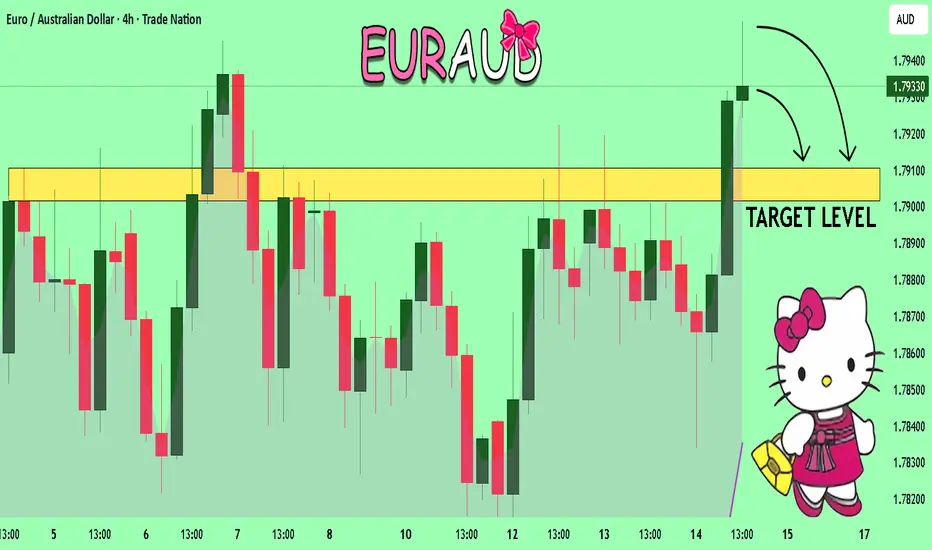
EURAUD Set To Fall! SELL!
My dear subscribers,
This is my opinion on the EURAUD next move:
The instrument tests an important psychological level 1.7938
Bias - Bearish
Technical Indicators: Supper Trend gives a precise Bearish signal, while Pivot Point HL predicts price changes and potential reversals in the market.
Target - 1.7910
About Used Indicators:
On the subsequent day, trading above the pivot point is thought to indicate ongoing bullish sentiment, while trading below the pivot point indicates bearish sentiment.
Disclosure: I am part of Trade Nation's Influencer program and receive a monthly fee for using their TradingView charts in my analysis.
———————————
WISH YOU ALL LUCK
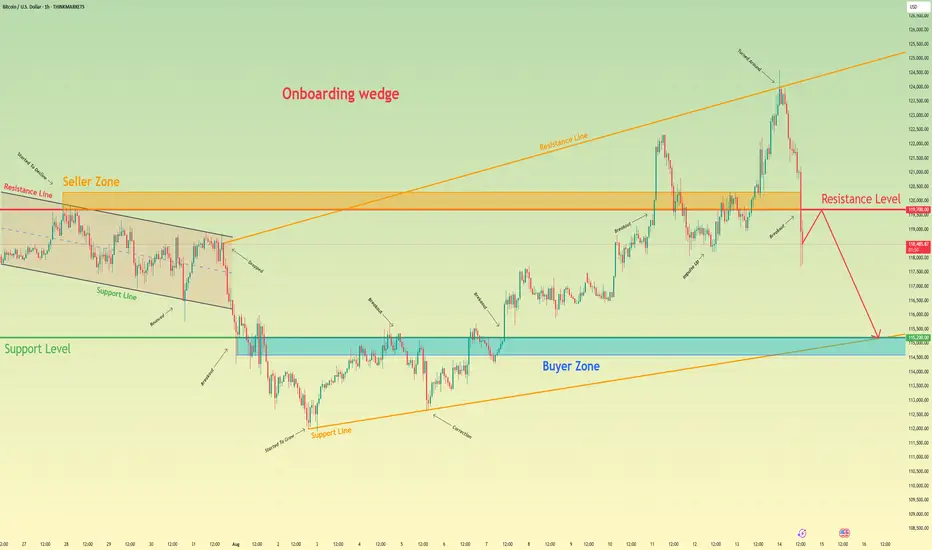
Bitcoin may continue to decline to support level in wedgeHello traders, I want share with you my opinion about Bitcoin. The market structure for Bitcoin has evolved significantly, transitioning from a contained downward channel into a much more volatile and expansive broadening wedge after a major breakout. This new pattern has defined a wide trading range, with price action making higher highs and lower lows, indicating a fierce battle between market participants. The most recent and critical development within this structure has been the price's failure to hold above the key level of 119700, breaking down below this former support and seller zone. Currently, the asset appears to be in a corrective phase, setting up for a potential retest of this broken level from underneath. The primary working hypothesis is a short scenario, which anticipates that the price will rally to test the 119700 resistance level and be rejected. A confirmed failure to reclaim this level would serve as a strong validation of the bearish pressure and suggest that a full rotation towards the bottom of the broadening wedge is now the most probable outcome. Therefore, the tp is logically and strategically placed at the 115200 level. This target is particularly significant as it represents a powerful confluence of the horizontal support level, the main buyer zone, and the ascending support line of the wedge, making it a natural magnet for price on the next major downward impulse. Please share this idea with your friends and click Boost 🚀
Disclaimer: As part of ThinkMarkets’ Influencer Program, I am sponsored to share and publish their charts in my analysis.
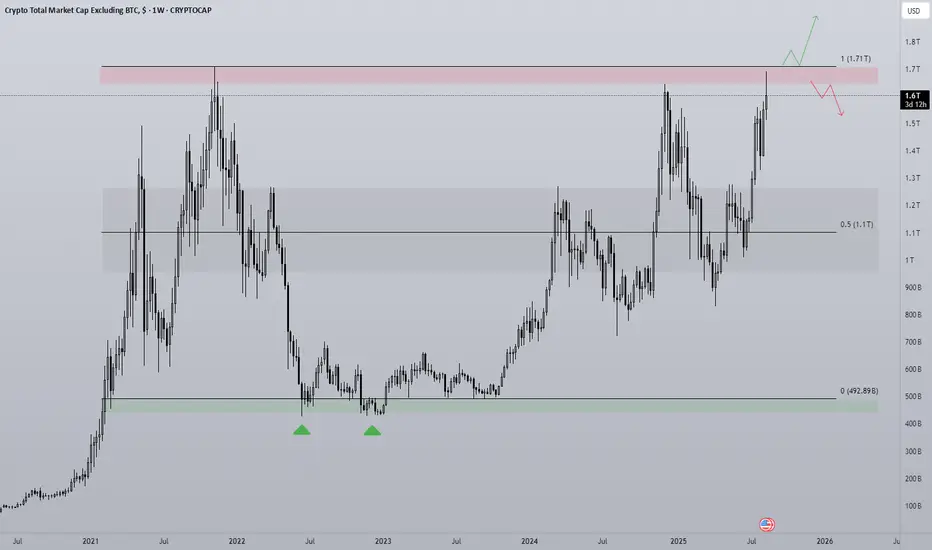
TOTAL2 - Breakout or Rangebound?The altcoin market as a whole has reached a critical point in the cycle. With all time highs in sight the question of what happens next is an important one.
Bullish scenario -
Accumulation under the Range high and a strong break above with volume, that would put TOTAL2 into price discovery and from there just riding the wave until there is a reason not too. Invalidation on the loss of range high.
Bearish scenario -
Clear rejection off the Range high and a break in bullish structure e.g a lower high and lower low on the 4H/1D time frame. This does not include bullish accumulation under the high as that shows coiling for a breakout instead of a loss of momentum.
Paying close attention to the context of the trading environment is key to the execution of the trade as well. Anecdotally the crypto sphere is euphoric with many calling for astronomical gains, posting their trade gain screenshots etc, google searches for coins like Ethereum have sky rocketed. These are all warning signs for me that at least as of now we are due a correction going off of previous cycles. I am by no means bearish on the larger time frame but coming into range high resistance with the market environment the way that it is this needs to be considered in trade execution.
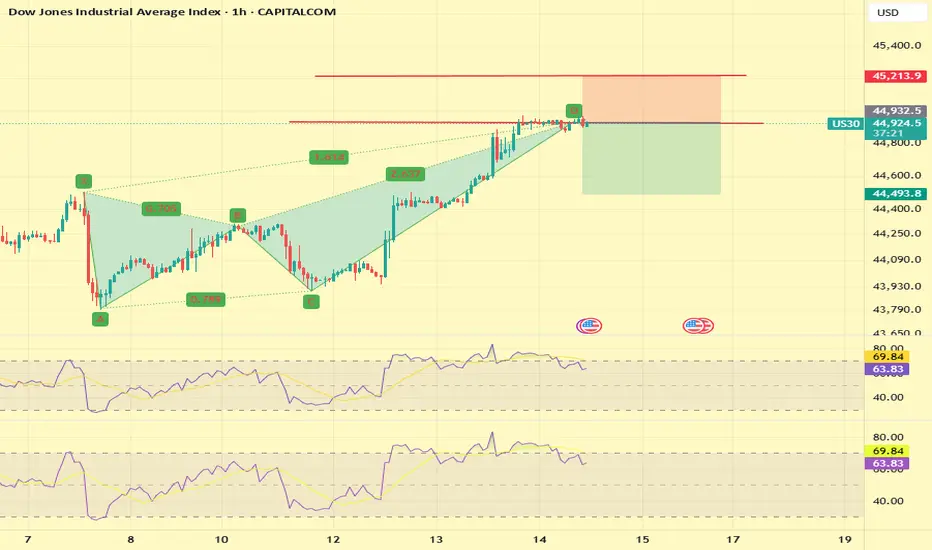
US30 Short This trade is massively overbought on all timeframes and at the all-time high with very good resistance
There is a crab pattern on H1 and H4
Multiple tops on M15 and M30 are showing massive divergence
stoploss above 150 pips
This is against the trend so will have to monitor when it is time to exit
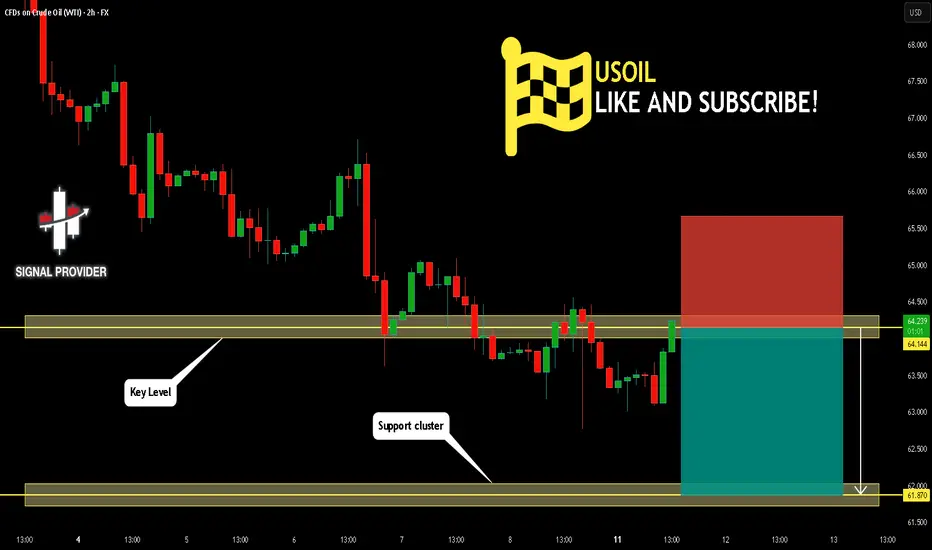
USOIL Is Going Down! Sell!
Take a look at our analysis for USOIL.
Time Frame: 2h
Current Trend: Bearish
Sentiment: Overbought (based on 7-period RSI)
Forecast: Bearish
The price is testing a key resistance 64.144.
Taking into consideration the current market trend & overbought RSI, chances will be high to see a bearish movement to the downside at least to 61.870 level.
P.S
Overbought describes a period of time where there has been a significant and consistent upward move in price over a period of time without much pullback.
Disclosure: I am part of Trade Nation's Influencer program and receive a monthly fee for using their TradingView charts in my analysis.
Like and subscribe and comment my ideas if you enjoy them!
GBP/JPY BEARS ARE STRONG HERE|SHORT
Hello, Friends!
GBP/JPY pair is trading in a local downtrend which know by looking at the previous 1W candle which is red. On the 1D timeframe the pair is going up. The pair is overbought because the price is close to the upper band of the BB indicator. So we are looking to sell the pair with the upper BB line acting as resistance. The next target is 195.254 area.
Disclosure: I am part of Trade Nation's Influencer program and receive a monthly fee for using their TradingView charts in my analysis.
✅LIKE AND COMMENT MY IDEAS✅

USDCAD Set To Fall! SELL!
My dear subscribers,
My technical analysis for USDCAD is below:
The price is coiling around a solid key level - 1.3779
Bias - Bearish
Technical Indicators: Pivot Points Low anticipates a potential price reversal.
Super trend shows a clear sell, giving a perfect indicators' convergence.
Goal - 1.3755
About Used Indicators:
By the very nature of the supertrend indicator, it offers firm support and resistance levels for traders to enter and exit trades. Additionally, it also provides signals for setting stop losses
Disclosure: I am part of Trade Nation's Influencer program and receive a monthly fee for using their TradingView charts in my analysis.
———————————
WISH YOU ALL LUCK

USDJPY Under Pressure! SELL!
My dear friends,
Please, find my technical outlook for USDJPY below:
The instrument tests an important psychological level 148.39
Bias - Bearish
Technical Indicators: Supper Trend gives a precise Bearish signal, while Pivot Point HL predicts price changes and potential reversals in the market.
Target - 147.86
About Used Indicators:
Super-trend indicator is more useful in trending markets where there are clear uptrends and downtrends in price.
Disclosure: I am part of Trade Nation's Influencer program and receive a monthly fee for using their TradingView charts in my analysis.
———————————
WISH YOU ALL LUCK

EURCHF: Short Trading Opportunity
EURCHF
- Classic bearish formation
- Our team expects fall
SUGGESTED TRADE:
Swing Trade
Sell EURCHF
Entry Level - 0.9425
Sl - 0.9429
Tp - 0.9417
Our Risk - 1%
Start protection of your profits from lower levels
Disclosure: I am part of Trade Nation's Influencer program and receive a monthly fee for using their TradingView charts in my analysis.
❤️ Please, support our work with like & comment! ❤️

GBPJPY The Target Is DOWN! SELL!
My dear followers,
This is my opinion on the GBPJPY next move:
The asset is approaching an important pivot point 200.10
Bias - Bearish
Safe Stop Loss - 200.28
Technical Indicators: Supper Trend generates a clear short signal while Pivot Point HL is currently determining the overall Bearish trend of the market.
Goal - 199.76
About Used Indicators:
For more efficient signals, super-trend is used in combination with other indicators like Pivot Points.
Disclosure: I am part of Trade Nation's Influencer program and receive a monthly fee for using their TradingView charts in my analysis.
———————————
WISH YOU ALL LUCK

GOLD: Short Trade Explained
GOLD
- Classic bearish formation
- Our team expects pullback
SUGGESTED TRADE:
Swing Trade
Short GOLD
Entry - 3365.8
Sl - 3371.4
Tp - 3354.5
Our Risk - 1%
Start protection of your profits from lower levels
Disclosure: I am part of Trade Nation's Influencer program and receive a monthly fee for using their TradingView charts in my analysis.
❤️ Please, support our work with like & comment! ❤️

EURUSD Buyers In Panic! SELL!
My dear subscribers,
EURUSD looks like it will make a good move, and here are the details:
The market is trading on 1.1704 pivot level.
Bias - Bearish
Technical Indicators: Both Super Trend & Pivot HL indicate a highly probable Bearish continuation.
Target - 1.1654
About Used Indicators:
The average true range (ATR) plays an important role in 'Supertrend' as the indicator uses ATR to calculate its value. The ATR indicator signals the degree of price volatility.
Disclosure: I am part of Trade Nation's Influencer program and receive a monthly fee for using their TradingView charts in my analysis.
———————————
WISH YOU ALL LUCK

British Pound can little grow and then drop to buyer zoneHello traders, I want share with you my opinion about British Pound. If we look at the chart, we can see how the price started to grow inside an upward channel, where it at once broke the 1.3280 level. In the channel, it rose to the resistance level, which coincided with the seller zone, after which it rebounded and fell to the support line of the channel. Later, GBP rose to the seller zone and dropped, breaking the resistance level and exiting from the upward channel. Then the price entered to wedge and then made an impulse up, breaking the resistance level, and rose to the resistance line of the wedge. After this movement, it turned around and started to decline. Soon, it broke the 1.3580 level one more time and fell more. But later it turned around and rose to the 1.3580 resistance level, which coincided with the resistance line of the wedge. Then it dropped to the support line of the wedge, breaking the support level, but soon it backed up and rose back to the resistance line of the wedge pattern. Now I expect that the British Pound can continue to decline inside the wedge, and reach the buyer zone, breaking the support level. For this case, I set my TP at 1.3245 points, which coincided with the buyer zone. Please share this idea with your friends and click Boost 🚀
Disclaimer: As part of ThinkMarkets’ Influencer Program, I am sponsored to share and publish their charts in my analysis.

SILVER Is Going Down! Sell!
Please, check our technical outlook for SILVER.
Time Frame: 1D
Current Trend: Bearish
Sentiment: Overbought (based on 7-period RSI)
Forecast: Bearish
The market is approaching a significant resistance area 3,850.1.
Due to the fact that we see a positive bearish reaction from the underlined area, I strongly believe that sellers will manage to push the price all the way down to 3,624.2 level.
P.S
Overbought describes a period of time where there has been a significant and consistent upward move in price over a period of time without much pullback.
Disclosure: I am part of Trade Nation's Influencer program and receive a monthly fee for using their TradingView charts in my analysis.
Like and subscribe and comment my ideas if you enjoy them!

EURAUD Will Fall! Short!
Here is our detailed technical review for EURAUD.
Time Frame: 1D
Current Trend: Bearish
Sentiment: Overbought (based on 7-period RSI)
Forecast: Bearish
The market is on a crucial zone of supply 1.787.
The above-mentioned technicals clearly indicate the dominance of sellers on the market. I recommend shorting the instrument, aiming at 1.763 level.
P.S
Please, note that an oversold/overbought condition can last for a long time, and therefore being oversold/overbought doesn't mean a price rally will come soon, or at all.
Disclosure: I am part of Trade Nation's Influencer program and receive a monthly fee for using their TradingView charts in my analysis.
Like and subscribe and comment my ideas if you enjoy them!
