THE KOG REPORTTHE KOG REPORT:
In last week’s KOG Report we said we would be looking for the market to open, test the high and then give us the short trade into the lower red box levels. We gave the levels of 2775 and 2755-60 to traders for potential RIPs of which the 2775 region gave us the tap and bounce that we wanted to get that long trade.
We mentioned our target level of 2828 which was active and as we saw, it not only completed but was surpassed. During the week, we updated traders with the plans for pull backs and red box target levels, of which again, nearly all were completed. That along with another 8 Excalibur targets just on Gold!
An extremely decent week on the markets in Camelot, not only on gold but the numerous other pairs we trade and analyse.
So, what can we expect in the week ahead?
For this week we’re in a similar situation to the last two weeks, price has close high and it’s too risky for us to attempt long trades up here unless we’re scalping the red boxes. We have the immediate resistance level above of 2865-8 which is a potential opening target if they take this upside from the open. This is a key level and needs to be watched, if rejected this could be the first opportunity to short again into the lower levels of 2855-50 and below that 2830-35. If broken, we’ll look higher at the 2895-2902 (target region) level for another attempt.
On the flip, ideally we want to see this go down into the first region 2830-5 for the bounce, and then flip the resistance to continue the move downside into the lower support and red box levels which is where we will be waiting again to swing this long.
In summary, expect ranging first part of the week, potential for 2885 resistance and 2855 support which are the levels that need to break to determine the next move. Don’t get carried away with trading it to the moon or shorting it to the core of the earth. Trade it how you see it on the day, follow KOG’s bias of the day and the red box targets which are proven to be effective for day traders and scalpers.
KOG’s Bias for the week:
Bearish below 2875 with targets below 2855, 2850, 2845 and below that 2835
Bullish on break of 2875 with targets above 2890, 2897, 2899 and above that 2902
RED BOXES:
Break below 2850 for 2847, 2844, 2839, 2835 and 2826 in extension of the move
Break above 2860 for 2865, 2872, 2874, 2890 and 2902 in extension of the move
Please do support us by hitting the like button, leaving a comment, and giving us a follow. We’ve been doing this for a long time now providing traders with in-depth free analysis on Gold, so your likes and comments are very much appreciated.
As always, trade safe.
KOG
Supply and Demand

GOLD (XAUUSD): To The New Highs📈Gold updated the All-Time High violating a significant intraday resistance level.
This level is now acting as a potentially strong support.
It is expected that the pair will continue to rise and reach the psychological level of 2900 in the near future.

CHECK XAUUSD ANALYSIS SIGNAL UPDATE > GO AND READ THE CAPTAINBaddy dears friends 👋🏼
XAUUSD trading signals technical analysis satup👇🏼
I think now XAUUSD ready for buy trade XAUUSD buy zone
( TRADE SATUP) 👇🏼
enter point (2903) to (2905) 📊
First tp (2908)📊
2nd target (2912)📊
Last target (2918) 📊
stop loss (2896)❌
Tachincal analysis satup
Fallow risk management

LONG ON GBP/JPYNice Double Bottom at a Key Demand Level
Jpy index is also Falling from a major resistance area.
I am taking GJ long

XAU.USD Longs from 2.820 back up I expect gold to continue pushing higher due to strong bullish momentum and the consistent bullish market structure. Now that price has taken last week's all-time high (ATH), a correction is likely this week before further upside movement.
The previous low was mitigated and showed a small reaction, but I anticipate it may fail, leading to a deeper retracement into the 6-hour demand zone that previously caused a Break of Structure (BOS). If price accumulates well in this area, we can expect a strong bullish rally.
Confluences for Gold Buys:
- Gold has been consistently bullish, forming strong higher highs and higher lows.
- Clean demand zones remain unmitigated below, which may need to be tapped before further upside.
- Fundamentals: Rising geopolitical tensions and policy shifts by Trump have increased uncertainty, strengthening gold as a safe-haven asset.
- There is still liquidity above that price may target.
Note: If price breaks the low and forms a clean supply zone, we could see the start of a short-term bearish trend, as the recent ATH sweep has taken a significant amount of liquidity.

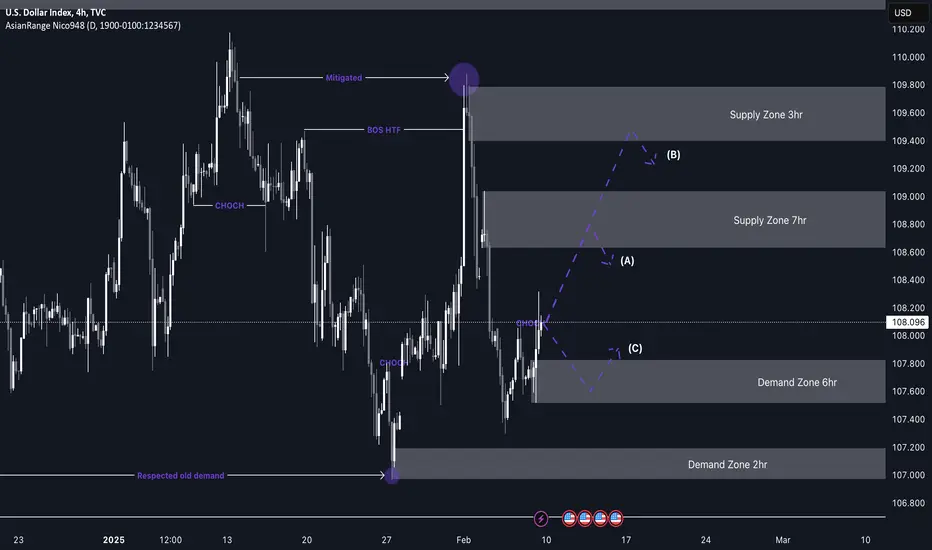
DXY (Dollar index) short from 108.800My DXY analysis aligns with the expectation of a bearish move, which suggests that my pairs—EU and GU—could push higher. However, before that, we may see a minor pullback as price moves toward a demand zone.
Price has recently broken structure to the upside, leaving behind a fresh demand level. Once price reaches this area, I anticipate accumulation before a potential move upward. I will look for opportunities to capitalize on this movement across the pairs I trade, such as Gold, EU, and GU.
The price action has been very clean so far, which is promising, and we can expect more of the same as we move further into Q1.
Have a great week ahead and remain vigilant!
CHECK GBPJPY ANALYSIS SIGNAL UPDATE > GO AND READ THE CAPTAINBaddy dears friends 👋🏼
GBPJPY trading signals technical analysis satup👇🏼
I think now GBPJPY ready for BUY trade GBPJPY BUY zone
( TRADE SATUP) 👇🏼
enter point (189.000) to (188.900) 📊
First tp (189.200)📊
2nd to (189.400)📊
Last target (189.700) 📊
stop loss (188.400)❌
Tachincal analysis satup
Fallow risk management

EURUSD Bullish Bat PatternOn the 4-hour chart, EURUSD is in a short-term shock and decline, with bears taking advantage. Currently, attention can be paid to the support near 1.0236 below, which is a potential buying position for a bullish bat pattern, and this position is in the previous demand area.

XAU/USD 15M CHARTXAU/USD M15 CHART IDEA:
Why I will take a trade:
1) Resistance Zone - 84, 86
2) Supply Zone - Bearish CHoCH
3) FVG - Fair Value Gap in M5 TF
4) -OB - Bearish Order Block
5) Gann Box - Gann Box At Premium Zone
Fave fun With IDEA.

OMNI Looks Bullish (1H)From the point where we placed the red arrow on the chart, it appears that OMNI has started forming an ABC pattern and is now at the end of wave B.
If the green box holds, this counter-triangle can complete and move into wave C.
A 4-H candle closing below the invalidation level will invalidate this analysis.
For risk management, please don't forget stop loss and capital management
Comment if you have any questions
Thank You

Beginning of the altseason or the last shakeout?Hello Traders 🐺,
In my last idea about BTC.D, I mentioned that this huge wick to the upside indicates that the BTC season is nearing its end , and we are now on the verge of entering the Altcoin season . But what makes me so confident about this?
As you can see in the chart above , we’re currently facing a strong weekly resistance at the 64% level, which has been a key point in the past. After the market’s most recent capitulation, we saw a massive dump in Altcoins , while BTC only corrected by 10% —a normal and expected move. But here’s the critical takeaway:
🔑 This means that Altcoins are now being traded at extremely undervalued levels.
So, why am I saying this with such confidence? Keep reading to find out why these levels present a major opportunity for the upcoming Altcoin season!
The Final Phase of BTC Season? The Big Altcoin Opportunity!
Currently, the chart is shaping something very similar to an ascending triangle—a pattern that’s typically bullish, especially when the overall trend for BTC.D is strong. But here’s the catch: a trend is our friend… until it ends!
🔥 And the key part? " Until it ends !" Yes, we are very close to that moment!
Why? The answer lies within the ALTCOIN/BTC charts . Right now, almost every single altcoin you can think of is down by a massive 90% from its all-time high against BTC ! This is not just a number—it’s a huge signal that there’s barely any room left for altcoins to go lower compared to BTC.
All the pieces of the puzzle are falling into place, and they’re spelling out one clear message:
💡 BTC dominance is nearing its peak, and we are extremely close to the bottom for altcoins—if we’re not already there!
The real question is: Are you ready for what’s coming next? Stay sharp, stay informed, and make sure you don’t miss what could be the biggest opportunity of the cycle!

NEW WEEK GOLD UPDATE ALERT!🚀 Calling all traders! 🌟 XAUUSD is blazing, smashing records with finesse! 🔥 Here’s the latest:
🔍 XAUUSD Overview: 📊 Engaged in a gripping duel between 2873 and 2883. 🤔 Is a breakout looming?
📉 Bearish Outlook: 📉 Be alert for potential declines if it dips below the range! 🎯 Targets: 2864 & 2854.
📈 Bullish Outlook: 📈 Anticipate buying opportunities if it breaks above! 🎯 Targets: 2900, 2915.
💬 Join the Discussion: 💬 Share your perspectives as we journey through this golden terrain! 🗣️ Let’s reach new heights together! 💼✨

CHECK BTCUSD ANALYSIS SIGNAL UPDATE > GO AND READ THE CAPTAINBaddy dears friends 👋🏼
BTCUSD trading signals technical analysis satup👇🏼
I think now BTCUSD ready for sell trade BTCUSD sell zone
( TRADE SATUP) 👇🏼
enter point (97.000) to (97.200) 📊
First tp (96.500)📊
2nd target (96.200)📊
Last target (95.800) 📊
stop loss (97.800)❌
Tachincal analysis satup
Fallow risk management

CL1! BULLISH intraday forcast The outlook for CL (Crude Oil) in intraday trading is somewhat mixed, with a few bullish factors and technical indicators to consider. Recent analysis shows that while technical signals point to a bearish trend in the short term, there are elements suggesting potential price support. For instance, the strength of the crude crack spread has risen to a 5¾-month high, which could indicate positive momentum for crude prices. Additionally, the U.S. GDP growth is showing positive signs, potentially leading to an increase in oil demand. This economic growth could push prices higher, especially if the market responds favorably to these fundamentals. However, technical indicators, including moving averages, suggest a "Sell" position at the moment. Therefore, traders should monitor market developments closely, weighing both the technical signals and broader economic factors when considering intraday trading strategies for CL.

BTC/USD M15 CHARTBTC/USD M15 CHART
Why i will take a trade:
OTE - Optimal Trade Entry Zone
FVG - Fair Value GAP
OB - Order Block
Demand Zone
ChoCH - Change of Character

EURUSDHello 🌹
The trend on higher time frames is bullish.🚀
Wait for a correction and then enter with confirmation.
I emphasize that you must get confirmation!!
Good luck 💎

BTCUSDT INTRADAY SETUP AND TRADE IDEABTCUSDT did liquidity sweep last night, filled DEMAND ZONE and flipped well did MSS, I have marked bullish FVG, where I am looking for long oppertunity but first I will look for confirmation then will take long trade.

GBPJPY: Bearish Continuation Ahead 🇬🇧🇯🇵
GBPJPY will most likely continue trading in a bearish trend
after a confirmed bearish breakout of a key horizontal support.
The broken structure and a falling trend line compose
the contracting supply zone now.
Chances are high that a bearish movement will follow from that.
Next goal - 186.0
❤️Please, support my work with like, thank you!❤️

XAU/USD M15 CHART I Enter Again XAU/USD M15 CHART IDEA:
Why I will take a trade:
1) Resistance Zone - 84, 86
2) Supply Zone - Bearish CHoCH
3) FVG - Fair Value Gap in M5 TF
4) -OB - Bearish Order Block
5) Gann Box - Gann Box At Premium Zone
6) Liquidity Sweep
7) physiological level - 2900
Fave fun With IDEA.

EURUSD 9/02/25Another week is her and we are back with our Sunday markups to start the week off with a clear idea of what we want to see and what we want to trade, as you can see our Orion system is telling us price is most likely running bullish, unless Orion changes we will follow the bias! now of course we know that the big money player are driving the price higher but we have a clear area that we want price to reach which will allow us to follow these big movers, these areas are below price which mean we have to have a counter bias move to be able to get into that long shift. so always keep in mind for us to follow long we must first have shorts in play, big money cant get entries without causing a counter move first. our main interest is for the high volume lows that are narked in gold dotted lines to be ran and then the highs marked above to be taken out, this would in turn give us our long move that is currently in our bias.
Trade safe, follow your risk profile and trade your rules.

GBPUSD - Analysis and Potential Setups (Intraday- 10.02.25)Overall Trend & Context:
The OANDA:GBPUSD pair is in an overall downtrend on the higher time frames and lower time frames are in alignment.
Technical Findings:
Price broke below all EMA's - is now consolidating below.
Keep an eye on LTF supply levels between 1.24635 - 1.24530 (within 4h supply).
Bullish price action appears inherently weaker against the bears.
Potential Scenarios:
For now I will only be considering shorts.
Trade is active at 1.24150.

USDJPY - Analysis and Potential Setups (Intraday- 10.02.25) Overall Trend & Context:
The OANDA:USDJPY pair is in an overall downtrend on the higher time frames and has reached highly significant support/demand levels. Lower time frame has given bullish indications, we can try to capitalize on this.
Technical Findings:
Price broke above the 200 EMA - this can act as dynamic support so watch current levels.
Demand zone was formed after sweeping internal liquidity (which resulted in an impulsive bullish break).
RSI shows overbought conditions - resulting in a pullback which is what we want to see to confirm price action (currently trading below the 50% level of the RSI)
Potential Scenarios:
Since we have seen a reaction off HTF supply zones we should wait for proper confirmations prior to entry.
If the demand fails, short positions should be considered - analysis will need to be adjusted to adapt to changing supply levels.

XAUUSD 9/2/25XAU is running bullish for the sixth consecutive week. We called for a new all-time high last week and the week before. If new highs form, we will shift our attention to them, but as it stands, we are anticipating another all-time high. Gold is being driven by fundamentals as well as a strong potential for gains based on past performance.
We now look to Orion for the daily bias, and as expected, it remains bullish. Based on this, we have key lows marked on our chart, with the third being a high-volume low. From our understanding, we expect a counter-trend move to start the week before continuing with more long positions. If price reaches our lower areas, we will look for the correct entry to follow through on these moves.
Trade your plan and manage your risk. Always follow Orion.
