Why GOLD IS BULLISH? DETAILED TECHNICAL AND FUNDAMENTALSXAUUSD is currently trading at $2,920, forming a bullish flag pattern—a classic continuation signal indicating potential upward momentum. The target price is set at $3,000, suggesting an anticipated gain of 80 pips upon a successful breakout.
A bullish flag pattern typically consists of a strong upward price movement (the flagpole) followed by a consolidation phase where prices move slightly downward or sideways within parallel lines (the flag). This pattern often precedes a continuation of the prior uptrend once the price breaks above the flag's resistance. In this scenario, a confirmed breakout above the flag's upper boundary could propel XAUUSD toward the $3,000 target.
Fundamentally, gold prices have been bolstered by ongoing global economic uncertainties and trade tensions, leading investors to seek safe-haven assets. Recent market analyses indicate that geopolitical developments and policies are expected to influence gold prices in 2025, with XAUUSD potentially finding support around the $2,500 level. citeturn0search1 Additionally, forecasts suggest that XAUUSD could reach a high of $2,912.14 in March 2025, with an average price around $2,855.32.
In conclusion, the formation of a bullish flag pattern in XAUUSD, coupled with supportive fundamental factors, indicates a potential upward move toward the $3,000 target. Traders should monitor key resistance levels and await confirmation of a breakout to capitalize on this opportunity.
Technical Analysis

EURJPY: Bullish Move From Support 🇪🇺🇯🇵
EURJPY looks bullish after a completion
of a consolidation on a key daily/intraday support.
A formation of a bullish imbalance candle provides a strong bullish confirmation.
I think that the price will go up and hit at least 160.33 level.
❤️Please, support my work with like, thank you!❤️

NZDJPY: Bearish Continuation 🇳🇿🇯🇵
NZDJPY formed a huge head & shoulders pattern after a test
of a key daily resistance.
Its neckline violation is a strong bearish trend-following signal.
I think that the market will continue falling.
Next support - 84.0
❤️Please, support my work with like, thank you!❤️

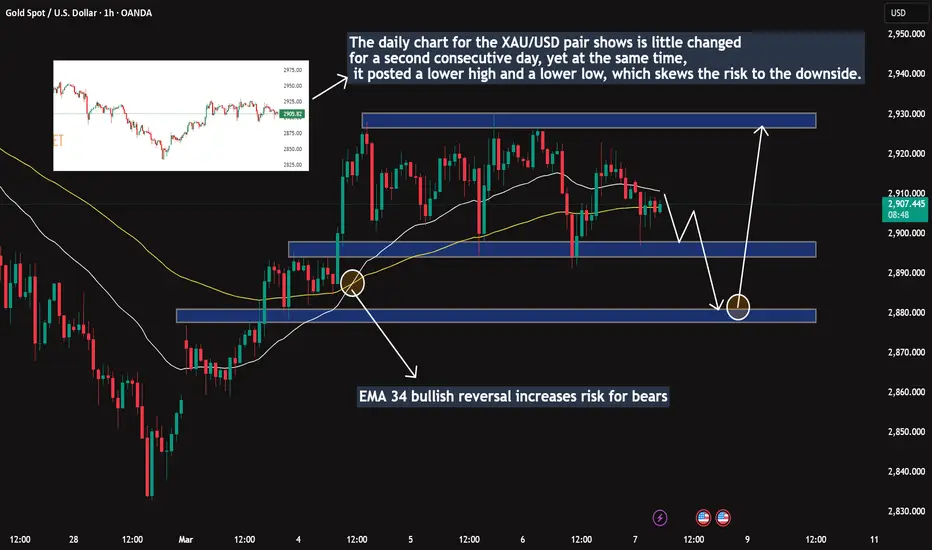
Gold purchase strategy continues to prioritize. Target 500 pips!Dear friends!
Gold continues to trade negatively for the second consecutive day, despite a combination of factors still acting as key drivers ahead of the crucial U.S. NFP report at the end of this Friday. Rising trade tensions continue to put pressure on investor sentiment.
As mentioned on the 1-hour chart, the daily chart for XAU/USD shows little change for the second consecutive day. However, at the same time, it also records lower highs and lower lows, shifting the risk bias to the downside. Nevertheless, the short-term picture indicates that buyers are struggling to maintain control, with the 34 EMA having reversed, increasing the risk for sellers. As a result, the downside potential remains limited, with dips likely to continue attracting buyers.
Key short-term levels to consider:
Support: 2,894 | 2,876
Resistance: 2,911 | 2,927
[INTRADAY] #BANKNIFTY PE & CE Levels(07/03/2025)Flat opening expected in banknifty near 48600 level. After opening if it's sustain above the 48550 then possible it can goes above upto the 48950 level. Major downside possible if banknifty starts trading below 48450 level. Downside it gives 400-500+ points upto the 48050 level.

BTCUSD – Head & Shoulders Confirmed?In my previous analysis ( ), I outlined a potential Head & Shoulders formation that could lead to a bearish move. So far, price action has followed this structure accurately.
Key Developments:
✅ The right shoulder seems to be forming as expected.
✅ Price grabbed liquidity above $92,500 before reacting downward.
✅ A double top has formed, adding further bearish confluence.
What’s Next?
If the market respects this pattern, a break below the neckline could confirm a continuation lower, with a potential target at $59,117 , aligning with the full Head & Shoulders projection.
Conclusion:
So far, this setup is playing out perfectly. If bearish pressure continues, we could see a deeper decline. However, a sustained move above $95,150 would invalidate this scenario.
🔔 Do you see BTC following this path, or do you expect a bullish surprise? Drop your thoughts below!

Nightly $SPY / $SPX Scenarios for March 7, 2025🔮 🔮
🌍 Market-Moving News 🌍:
🇺🇸📊 Anticipated U.S. Jobs Report 📊: The Bureau of Labor Statistics is set to release the February employment report on Friday, March 7. Economists expect an increase of approximately 133,000 nonfarm payrolls, with the unemployment rate holding steady at 4%.
📊 Key Data Releases 📊:
📅 Friday, March 7:
👷♂️ Nonfarm Payrolls (8:30 AM ET) 👷♂️:
Forecast: +133K jobs
Previous: +150K jobs
This report indicates the number of jobs added or lost in the economy, excluding the farming sector, and is a key indicator of employment trends.
📈 Unemployment Rate (8:30 AM ET) 📈:
Forecast: 4.0%
Previous: 4.0%
This metric represents the percentage of the total workforce that is unemployed and actively seeking employment during the previous month.
💵 Average Hourly Earnings (8:30 AM ET) 💵:
Forecast: +0.3% month-over-month
Previous: +0.2% month-over-month
This metric indicates the month-over-month change in wages, providing insight into consumer income trends.
⚠️ Disclaimer: This information is for educational and informational purposes only and should not be construed as financial advice. Always consult with a professional financial advisor before making investment decisions.⚠️
📌 #trading #stockmarket #economy #news #trendtao #charting #technicalanalysis

Fri 7th Mar 2025 GBP/CAD Daily Forex Chart Sell SetupGood morning fellow traders. On my Daily Forex charts using the High Probability & Divergence trading methods from my books, I have identified a new trade setup this morning. As usual, you can read my notes on the chart for my thoughts on this setup. The trade being a GBP/CAD Sell. Enjoy the day all. Cheers. Jim

U.UN Sprott Physical Uranium OutlookLooking for TSX:U.UN to have progressed higher in 3 waves, with current price action potentially being in the later stages, if not already completed, of a WXY pull back. Watching for a reversal and breakout to form, after which another 3 wave move higher could unfold. Simlar view on LSE:YCA may get an update out on that soon.

SPOT Eiffel Tower CAUTION!This is a very simple setup of an Eiffel Tower pattern that should be respected. Bulls do not want to be long with this setup.
The Eiffel Tower patterns are rare, hence not much talked about or understood. But they are very powerful when the conditions are right.
CAUTION!!

$TSLA Sales Slump but is Support Near?Is Tesla ( NASDAQ:TSLA ) facing a sales slump and an overpriced valuation? In this video, we dive into the latest Tesla stock analysis, starting with the declining sales numbers and why the current valuation might be raising red flags for investors. We then break down the weekly chart, spotlighting a potential breakdown retest as NASDAQ:TSLA price nears key support levels around the 243 weekly SMA. What was once resistance could now flip to support—find out how! Zooming into the daily chart, we explore the 280 price level where the 200 SMA is and outline a possible 5-wave pattern completing at 243, followed by a correction toward Goldman Sachs’ 320 target and Bank of America’s 380 forecast. But could a deeper drop to 200 be on the horizon? Get the full technical analysis, price targets, and insights to navigate NASDAQ:TSLA ’s next move in this must-watch stock market update!

ETHEREUM (ETHUSD): Bullish Continuation Confirmed
I think that ETHEREUM is going to rise.
A double bottom pattern formation on a key daily/intraday support
and a bullish breakout of its neckline show a strong buying interest.
The market is going to reach 2495 level soon.
❤️Please, support my work with like, thank you!❤️

GOLD RALLIES STRONGLY – WILL THE BULLS MAINTAIN CONTROL?💠 GOLD ANALYSIS – 03/05/2025
📌 Market Overview
Gold continues its strong upward trajectory, holding firm above key resistance levels. Following the release of ADP Nonfarm employment data, the market responded with increased demand, reinforcing the bullish sentiment.
🔥 Macroeconomic Factors at Play
The U.S. dollar (USD) has weakened due to ongoing tariff uncertainties and mixed economic data from the U.S. While there was a short-lived recovery in the dollar late last week, the overall sentiment suggests further strength in gold. Given this outlook, buying opportunities remain attractive as the price action aligns with technical confirmations.
💡 Strategic Focus for Today
During the Asian and European trading sessions, traders should closely monitor resistance levels to assess potential early BUY entries. If gold reaches the 2928 - 2926 zone, this could present an ideal setup for short-term SELL scalping, similar to yesterday’s move, which yielded a 150-pip profit.
🔹 Key Support & Resistance Levels
🔺 Resistance Levels:
2928 - 2942 - 2954
🔻 Support Levels:
2904 - 2894 - 2886 - 2874
🎯 Trading Plan for Today
🟢 BUY ZONE:
Entry: 2886 - 2884
Stop Loss (SL): 2880
Take Profit (TP): 2890 - 2894 - 2898 - 2905
🔴 SELL SCALP:
Entry: 2942 - 2944
Stop Loss (SL): 2948
Take Profit (TP): 2938 - 2934 - 2930 - 2925 - 2920
🔴 SELL ZONE:
Entry: 2954 - 2956
Stop Loss (SL): 2960
Take Profit (TP): 2950 - 2946 - 2942 - 2938 - 2934 - 2930
📌 Key Considerations & Risk Management
✔ Risk Control: Strictly adhere to Take Profit (TP) and Stop Loss (SL) levels to protect capital.
✔ Market Behavior: Prices may consolidate before tomorrow’s Nonfarm Payroll (NFP) data release, requiring patience and a disciplined approach.
✔ Confirmation Before Execution: Avoid premature entries—wait for clear signals to maximize trade efficiency.
📢 Will gold continue its bullish momentum or face a pullback? Drop your insights below! 🚀🔥

XAG/USD Silver Price Analysis: Bullish Continuation or Rejection📉 Current Price: 32.3715
📊 Key Levels:
Support Zone (~32.00 - 32.20): Price recently bounced from this level.
Resistance Zone (~33.20 - 33.50): A potential target for an upward move.
📈 Potential Scenario:
The chart suggests a bullish breakout after retesting the lower support zone.
If the price successfully retests and holds above 32.00, it could continue towards 33.50.
A break below 32.00 could invalidate this bullish move and lead to further downside.
🎯 Trading Outlook:
Bullish Bias above 32.00, aiming for 33.50.
Bearish Risk below 32.00, which could lead to further declines.

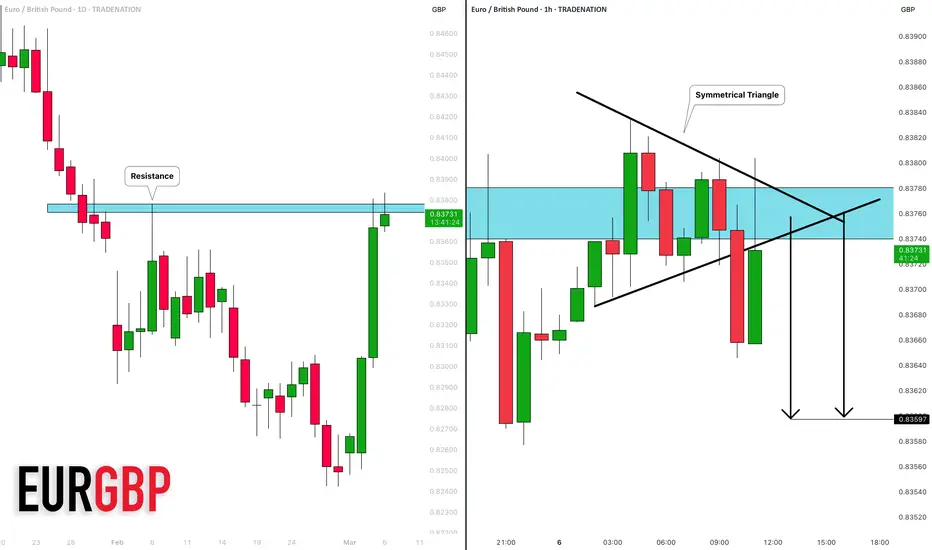
EURGBP: Bearish Chart Pattern?! 🇪🇺🇬🇧
EURGBP broke a support line of a symmetrical triangle pattern
after a test of key daily resistance.
I think that the pair may retrace at least to 0.836
❤️Please, support my work with like, thank you!❤️
I am part of Trade Nation's Influencer program and receive a monthly fee for using their TradingView charts in my analysis.
EURJPY: Overbought Market & Pullback 🇪🇺🇯🇵
I see a local bearish reversal on EURJPY.
The price formed a tiny double top after a test
of the underlined supply zone.
We can expect a correctional movement at least to 106.26 level today.
❤️Please, support my work with like, thank you!❤️

Gold price breakout – What’s Next?The XAU/USD 2-hour chart reveals an exciting breakout from the previous downtrend channel, signaling a potential trend reversal. The 34 EMA and 89 EMA continue to provide solid support, while buyers are holding firm within the consolidation zone.
Two Key Scenarios Ahead:
✅ Case 1: If gold breaks out of this consolidation box, we could see a strong bullish continuation toward $2,950 - $2,970, and possibly even higher.
⚠️ Case 2: However, if price fails to sustain above this range, a retracement to $2,880 - $2,850 is on the table.
With geopolitical tensions rising and economic uncertainty driving investors toward safe-haven assets, will gold break higher, or are we in for a deeper pullback?
📉📈 What’s your outlook on gold? Bullish or bearish? 🚀👇

#NIFTY Intraday Support and Resistance Levels - 06/03/2025Gap up opening expected in nifty above the 22400 level. After opening if it's sustain above this level and gives breakout of 22500 then expected further upside rally upto 22750 level in today's session. In case nifty starts trading below 22400 level then possible downside in index upto 22150 level in opening session.

Gold (XAUUSD) - Inverse Head & Shoulders Breakout Setup!Hello everyone, i hope you all will be doing good in your life and your trading as well, let's discuss about Gold and it is showing a strong bullish setup with an inverse head and shoulders pattern on the 1-hour chart . This means buyers are stepping in , and a breakout above the $2,930-$2,932 neckline could push prices higher toward the next resistance at $2,954-$2,960 . A stop-loss around $2,910-$2,906 can help manage risk in case of a pullback. Watch for volume confirmation when the breakout happens—it’ll add more strength to the move!
If Gold breaks out and holds above the neckline , we could see a good upside rally as buyers take charge. But if it fails to sustain, we might see some consolidation or even a drop. Best approach? Wait for a clean breakout and retest before jumping in. Stay sharp, manage risk, and trade smart!
Disclaimer: This analysis is for educational purposes only. Please consult a financial advisor before making investment decisions.
If you Found this helpful? Don’t forget to like, share, and drop your thoughts in the comments below.

Nightly $SPY / $SPX Scenarios for March 6, 2025🔮 🔮
🌍 Market-Moving News 🌍:
🇪🇺💶 ECB Interest Rate Decision 💶: The European Central Bank is expected to announce a 25 basis point reduction in its deposit rate, bringing it to 2.5%. This move aims to stimulate economic growth amid ongoing uncertainties, including trade tensions and fiscal policy shifts.
📊 Key Data Releases 📊:
📅 Thursday, March 6:
📉 Initial Jobless Claims (8:30 AM ET) 📉:This weekly report indicates the number of individuals filing for unemployment benefits for the first time, providing insight into the labor market's health.
Forecast: 220K
Previous: 215K
📦 Factory Orders (10:00 AM ET) 📦:This report details the dollar level of new orders for both durable and non-durable goods, offering insight into manufacturing demand.
Forecast: -0.5%
Previous: +1.2%
⚠️ Disclaimer: This information is for educational and informational purposes only and should not be construed as financial advice. Always consult with a professional financial advisor before making investment decisions.⚠️
📌 #trading #stockmarket #economy #news #trendtao #charting #technicalanalysis

Thu 6th Mar 2025 Daily Forex Charts: 4x New Trade SetupsGood morning fellow traders. On my Daily Forex charts using the High Probability & Divergence trading methods from my books, I have identified 4x new trade setups this morning. As usual, you can read my notes on the charts for my thoughts on these setups. The trades being a AUD/USD Buy, AUD/CHF Buy, NZD/USD Buy & a USD/CAD Sell. I also discuss some trade management. Enjoy the day all. Cheers. Jim

UK100 (FTSE)-Weekly forecast, Technical Analysis & Trading IdeasMidterm forecast:
8380.25 is a major support, while this level is not broken, the Midterm wave will be uptrend.
Technical analysis:
A trough is formed in daily chart at 8611.20 on 02/21/2025, so more gains to resistance(s) 8854.99, 9000.00, 9100.00 and more heights is expected.
Take Profits:
8664.21
8765.00
8854.99
9000.00
9100.00
__________________________________________________________________
❤️ If you find this helpful and want more FREE forecasts in TradingView,
. . . . . . . . Hit the 'BOOST' button 👍
. . . . . . . . . . . Drop some feedback in the comments below! (e.g., What did you find most useful? How can we improve?)
🙏 Your support is appreciated!
Now, it's your turn!
Be sure to leave a comment; let us know how you see this opportunity and forecast.
Have a successful week,
ForecastCity Support Team

GBPJPY: Time For Pullback 🇬🇧🇯🇵
On the today's live stream, we discussed a selling opportunity on GBPJPY.
The market looks bearish after a test of a key horizontal resistance.
A formation of a bearish engulfing candle confirms the strength of the sellers.
I expect a retracement to 190.15
❤️Please, support my work with like, thank you!❤️
I am part of Trade Nation's Influencer program and receive a monthly fee for using their TradingView charts in my analysis.
