EURJPY IS GETTING STRONGE OR WEAK ? DETAILED ANALYSISEURJPY has successfully broken out of the falling wedge pattern, hitting the projected target of 160.000 and delivering significant profits. This breakout confirmed a strong bullish reversal, allowing traders to capitalize on a deep profit opportunity. The falling wedge is a classic bullish pattern, and its breakout was accompanied by increasing momentum, pushing the pair higher in a sustained rally. With price action playing out as expected, traders who entered early have already locked in substantial gains.
From a technical perspective, EURJPY’s bullish structure remains intact, with strong support now forming around the 158.000–159.000 range. If the price consolidates above this level, we could see further upside potential beyond 160.000. However, traders should watch for any retracements or potential resistance at key psychological levels. If bullish momentum continues, the next targets could extend toward 162.000 or higher, depending on market conditions.
Fundamentally, EURJPY’s movement is heavily influenced by central bank policies. The European Central Bank’s (ECB) stance on interest rates, coupled with the Bank of Japan’s (BoJ) continued monetary easing, has contributed to yen weakness and euro strength. Additionally, risk sentiment in the market plays a crucial role—any shift toward a more risk-on environment will likely support further bullish moves in EURJPY. As the pair remains in an uptrend, traders should monitor key economic events and price action signals to maximize their profit potential.
Technical Analysis

Oil Under Pressure Amid Tariff Tensions and OPEC+ UncertaintyMacro:
- Oil prices stabilised after hitting multi-month lows as the market weighed potential output increases in Apr and escalating tariff tensions among Canada, Mexico, China, and the EU.
- Meanwhile, the halted US military aid to the Eastern Europe conflict, and OPEC+ production decisions continue to pressure oil.
Technical:
- USOIL remains in a downtrend, consistently making lower lows while trading below both EMAs, signalling persistent bearish momentum. However, the price is nearing the oversold zone, supported by multiple key levels.
- If USOIL continues declining, it may retest 66.90 and 65.80, aligning with the 78.6% Fibonacci Extension.
- Conversely, holding above 66.90 could lead to a short-term sideways movement, with a potential retest at 70.20, confluence with EMA21, and the descending channel’s upper bound.
Analysis by: Dat Tong, Senior Financial Markets Strategist at Exness

USDJPY: Consolidating below the uptrend channel!Dear Traders!
Recently, USDJPY has made a strong breakout, completely exiting the uptrend and stabilizing below a new support level, as highlighted on the 1-hour chart. The pair is currently trading around 149.20.
This stability above the new support is driven by U.S. President Donald Trump's tariff policies, which have boosted risk-off sentiment and increased demand for the U.S. Dollar as a safe-haven asset. However, expectations of a BoJ rate hike and concerns over a global trade war continue to support the Japanese Yen, keeping gains limited below the lower boundary of the previous uptrend channel.

GOLD → Breaks 2881. Buyers are ready…OANDA:XAUUSD breaking through the resistance threshold of the downward trend and attempting to seek gains above the critical resistance zone of 2881. A consolidation before the breakout is forming relative to 2894, signaling potential growth on the dollar's correction foundation.
Previously, Trump confirmed the possibility of imposing 25% tariffs on Canada, Mexico, and China, triggering retaliatory measures and increasing the risk of U.S. recession. Declining PMI and Atlanta Fed's GDP led to a sell-off on Wall Street and increased demand for gold as a protective asset.
Geopolitical tensions persist as Trump suspends military aid to Ukraine, sparking European discontent. Market focus will remain on the release of detailed U.S. monthly employment information - commonly known as the Non-Farm Payroll (NFP) report on Friday. This crucial data will impact both USD and gold metal.
Technically, the price surpassing the 2881 resistance level divides the market into two planes. A consolidation before breakthrough is forming relative to 2895. The resistance breakthrough and price consolidation above 2895 could reinforce growth. The buyers' main focus is maintaining defensive positions above 2885 - 2895.
In the context of increasing economic risks and declining dollar, gold has every opportunity to continue its growth following the local trend change. The targets in this scenario are 2915, 2921, 2929.
Best regards, Bentradegold!

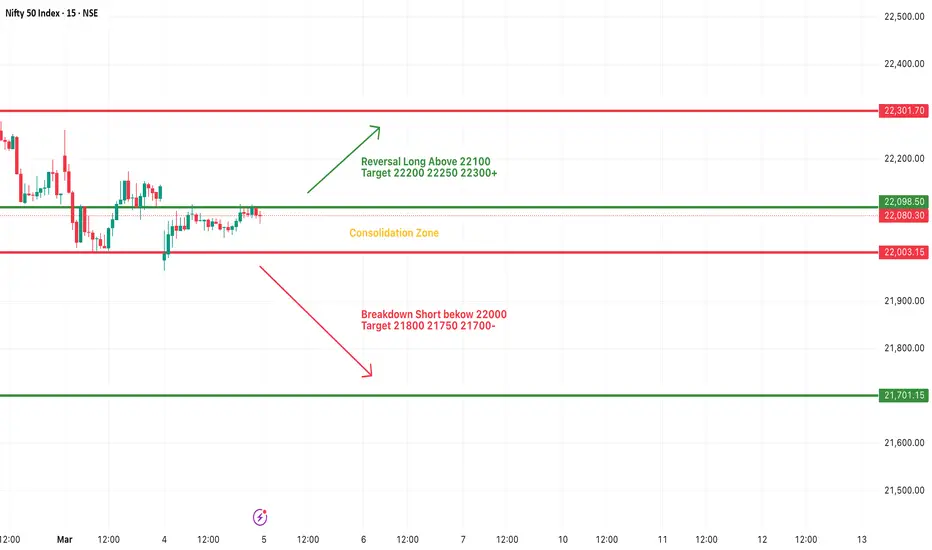
#NIFTY Intraday Support and Resistance Levels - 05/03/2025Today will be flat or slightly gap up opening expected in nifty near 22100 level. In last trading session nifty consolidated between the 22000-22100 zone. Any major upside rally only expected if nifty starts trading and sustain above 22100 level. Downside 22000 is the crucial support for nifty. Below this support level expected sharp downside fall in index.
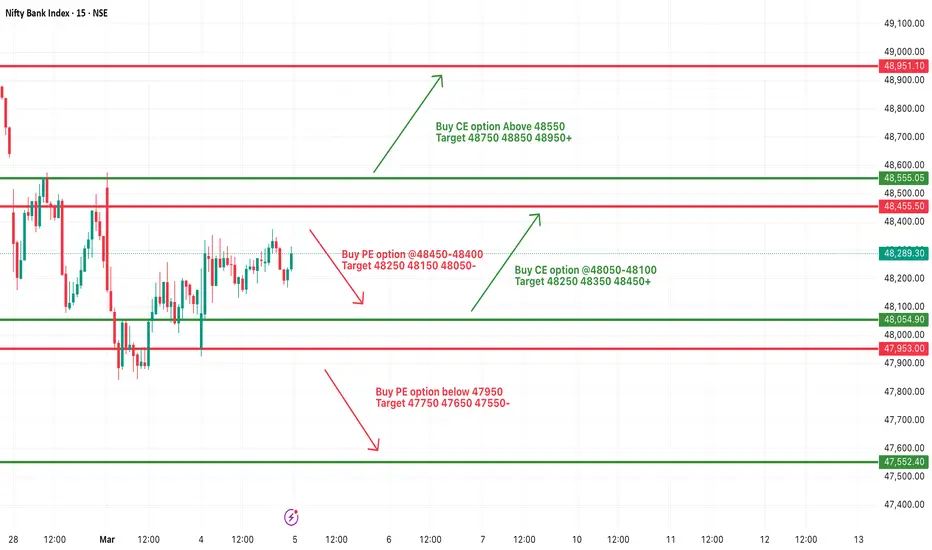
[INTRADAY] #BANKNIFTY PE & CE Levels(05/03/2025)Today will be flat opening expected in index. After opening it will trade in between the 400+ points range from 48050-48400 points. Any strong upside rally only expected above 48550 level. Downside 48050 level will act as a important support for today's session. Any major downside rally only expected below 47950 level.
Nightly $SPY / $SPX Scenarios for March 5, 2025🔮 🔮
🌍 Market-Moving News 🌍:
🇨🇳📉 China's Manufacturing Activity Contracts 📉: China's official Manufacturing Purchasing Managers' Index (PMI) fell to 49.9 in February, down from 50.1 in January, indicating a contraction in manufacturing activity for the second consecutive month. This downturn raises concerns about global economic growth and could impact markets worldwide.
📊 Key Data Releases 📊:
📅 Wednesday, March 5:
📄 ADP National Employment Report (8:15 AM ET) 📄:
Forecast: +160K jobs
Previous: +183K jobs
This report provides a monthly snapshot of private-sector employment, offering insights into labor market trends ahead of the official government employment data.
🏢 ISM Services PMI (10:00 AM ET) 🏢:
Forecast: 53.0
Previous: 52.8
This index assesses the performance of the U.S. services sector. A reading above 50 indicates expansion, while below 50 signifies contraction.
🏭 Factory Orders (10:00 AM ET) 🏭:
Forecast: -0.5%
Previous: +1.2%
This report details the dollar level of new orders for both durable and non-durable goods, providing insight into manufacturing demand.
⚠️ Disclaimer: This information is for educational and informational purposes only and should not be construed as financial advice. Always consult with a professional financial advisor before making investment decisions.⚠️
📌 #trading #stockmarket #economy #news #trendtao #charting #technicalanalysis

Gold price today: Extend the momentum!Gold prices continued their upward momentum today, hovering around the $2,910 level. The last recorded trade for gold stood at $2,928 per ounce, marking a 270-pip increase compared to early yesterday morning.
Accordingly, gold prices are currently experiencing strong impacts from USD fluctuations and US tariff policies. Meanwhile, President Donald Trump continues to raise concerns by threatening to impose tariffs on imports from Mexico and Canada. These factors could determine whether gold can reach the $3,000 per ounce mark or not.
Currently, investors are awaiting the US payroll report, expected to be released at the end of this week. The report's results could influence the monetary policy of the Federal Reserve (FED).
On the technical chart, the precious metal has broken out of the descending price channel and made adjustments to create new highs. Bullish factors are driven by the crucial support level at 2885 and the two EMA lines at 34 and 89. All expectations are focused on gold's long-term price appreciation because any signs of US economic slowdown will support calls for Fed rate cuts and provide support for OANDA:XAUUSD .

EUR/USD 1.0600 target hit and cleared. Possible Danger Ahead...Mid week update on the EUR/USD trade: The target has been hit out of the descending broadening pattern and a 343 pip gain at 1.06220 has been locked in.
The EUR/USD made a very strong bullish move today which enabled an exit in the trade however, I am now keeping a very close eye on the possible bearish opportunity coming up if price begins trading around 1.07000 at that upper trend-line.
Both the MACD and the RSI are displaying a continuation divergence (otherwise known as a "Hidden" divergence") and that could spell very bad news for the bulls.
I have done some analysis on the weekly and monthly chart and it further gives me a reason that the bears could be lurking around the corner. I will include that analysis in my next weekly pre market preview video.
For the previous analysis on the EUR/USD and Stock Market down move, refer to my previous video posted.
Update you all soon.
Good Luck & Trade Safe.

Gold price today: Strong rebound!Dear traders!
At around 6 AM on March 4, the spot gold price stood at $2,894 per ounce, marking a $36 increase from the previous day's opening price of $2,858 per ounce.
The primary reason for this rise is the increased risk aversion among investors, driving higher demand for safe-haven assets like gold amid escalating geopolitical tensions. Over the weekend, a heated exchange between U.S. President Donald Trump and Ukrainian President Volodymyr Zelensky raised concerns that efforts to end the Ukraine-Russia military conflict could reach an impasse.
Additionally, U.S. trade tariffs on Mexico, Canada, and China take effect today, March 4, sparking fears of potential financial market instability. This uncertainty has pushed many investors toward gold as a wealth preservation asset.
Meanwhile, a sudden decline in the U.S. dollar has made gold more attractive to investors holding other currencies. As a result, today's gold price outlook remains positive. Keep an eye on the $2,892 resistance level, as a breakout above this point could signal further upside momentum.
What are your thoughts?

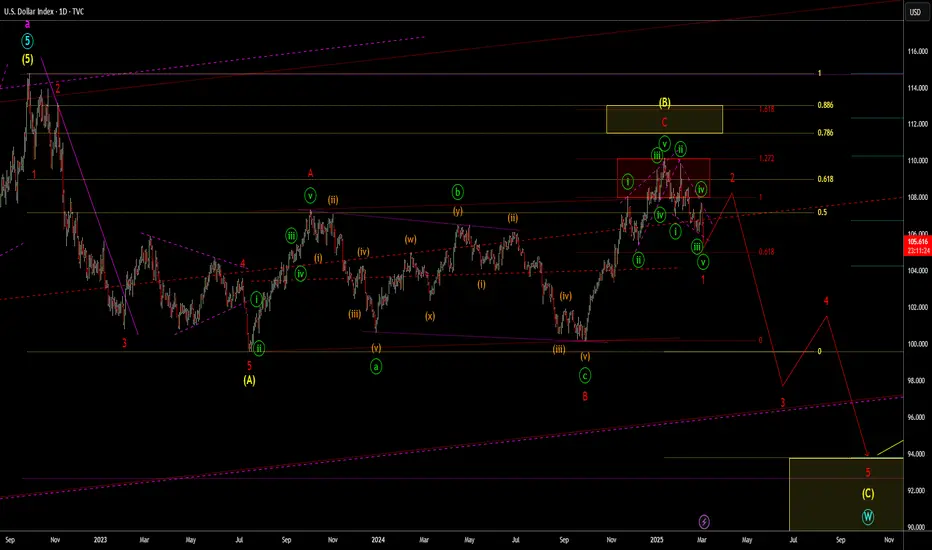
DXY Dollar Index OutlookThis is my current Elliott Wave count for the DXY Dollar index. I have a couple of variations which I will share but this one sees a decline starting with a leading diagonal in red wave 1 which is close to completion. May see a pull back in red 2 before a strong move lower in 3. The alternative is a nesting 1,2,1,2. If that's the case then a strong decline could continue from here.
Wed 5th Mar 2025 XAG/USD Daily Forex Chart Buy SetupGood morning fellow traders. On my Daily Forex charts using the High Probability & Divergence trading methods from my books, I have identified a new trade setup this morning. As usual, you can read my notes on the chart for my thoughts on this setup. The trade being a XAG/USD Buy. Enjoy the day all. Cheers. Jim

Crude Oil / WTI short cheap and good time to bounceVolatility on WTI has been very strong on past years but is narrowing. Especially in past months we can see a seemingly tightening volatility in prices. And we all know what that means right ?!
Correct, a breakout will follow. The questions is only in which direction. A good risk ration is achievable since we are very close to a bounce level / support (green line) and far away from the next resistance (red line). Commodity markets tend to be mean reverting and whenever commodities are cheap it makes sense to but them. Boom and bust cycles. But this is rather a long term strategy.
In any case, breakdown as below:
Entry:
Ideally we would average down the long position down to 67.28 and potentially below, in case price tests areas below.
Exit:
Ideally we would exit at TP slightly before 80 USD to avoid the resistance and the magical strength of full numbers. Something like 79.4 USD should work.
If price moves against us close at SL or once daily candle break below the support and closes.
In such case we could even consider a short position but with tight TP as fundamental dont point towards much lower prices.
Conclusion:
An easy trade can be entered with good risk reward ratio if executed correctly.
Disclaimer: This is non financial advice
let me know if any question.

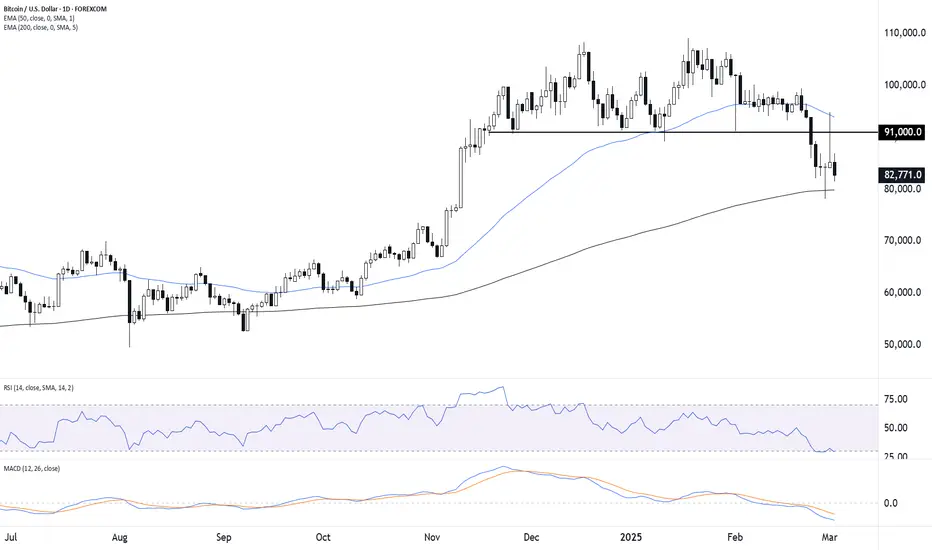
Bitcoin Loses Key Support – Is the Bull Trend in Trouble?Bitcoin has fallen sharply, breaking below the $91,000 support level, which previously acted as a major floor for the uptrend. The cryptocurrency is now testing the 200-EMA ($79,897) as it struggles to find buying interest.
🔍 Technical Breakdown:
📉 Major Breakdown – The loss of $91,000 has turned sentiment bearish.
📉 200-EMA as Last Defense – Holding above $80,000 is critical to avoid deeper losses.
📉 RSI at 29.30 – Bitcoin is entering oversold territory, suggesting a potential relief bounce.
📉 MACD Bearish – The indicator remains deeply negative, confirming ongoing selling momentum.
📌 Key Levels to Watch:
🔹 $80,000-$79,000 – Crucial support zone; a breakdown here could trigger further selling.
🔹 $91,000 – Now resistance; bulls must reclaim this level to restore confidence.
🔹 $100,000+ – Long-term bullish outlook remains intact above this mark.
💡 Trading Outlook:
🔻 Bearish Case: A sustained break below $80,000 could accelerate downside pressure, targeting $72,500 (61.8% Fib retracement).
🔺 Bullish Case: If Bitcoin holds above the 200-EMA, a relief bounce toward $91,000 is possible, but buyers need to reclaim it to shift momentum.
Bitcoin's long-term trend is still bullish, but the recent breakdown raises concerns about further downside risk. Can bulls defend $80,000, or is this the start of a deeper correction?
USD/CHF Breaks Key Support – Bears Taking Control?The USD/CHF pair has decisively broken below its 200-EMA (0.8887) and key horizontal support (0.8915), signaling a potential shift in momentum toward further downside. After failing to hold above 0.90, sellers have stepped in, dragging price action lower.
🔍 Technical Overview:
✅ Support Break – The loss of 0.8915 puts 0.88 in focus.
✅ 200-EMA Breached – A significant bearish technical development.
✅ RSI at 37.52 – Momentum is weak but not yet oversold.
✅ MACD Bearish – The bearish crossover remains intact, confirming downward pressure.
📌 Key Levels to Watch:
🔹 0.8915 – Broken support, now resistance; bears defending it strongly.
🔹 0.8800 – Next major support level; a break below could accelerate selling.
🔹 0.9000 – Bullish recovery only valid above this level.
💡 Trading Outlook:
🔻 Bearish case: As long as USD/CHF remains below 0.8915, bears are in control. If 0.88 breaks, it could open the door toward 0.87.
🔺 Bullish case: Buyers need to reclaim 0.8915 and the 200-EMA to shift momentum back in their favor.
With the USD showing weakness, CHF bulls could push further downside. Is this the start of a new downtrend, or will buyers step in at 0.88? 🚨

USD/CAD Bulls in Control, Eyeing 1.48 Resistance?USD/CAD has been riding a well-defined ascending channel since mid-February, pushing toward 1.45 after bouncing off its 50-EMA support. The pair remains in a firm uptrend, with bulls showing resilience despite intraday pullbacks.
🔍 Technical Overview:
✅ Trending Higher – Price action remains inside the rising channel.
✅ Support Holding Strong – The 50-EMA (1.4366) has acted as dynamic support.
✅ Momentum Intact – RSI at 64 is bullish but not yet overbought.
✅ MACD Slightly Flat – Suggesting momentum is steady but not accelerating significantly.
📌 Key Levels to Watch:
🔹 1.4500-1.4520 – Immediate resistance; a breakout could push toward 1.48.
🔹 1.4360-1.4400 – Key support zone, aligned with trendline & 50-EMA.
🔹 1.4800 – Major resistance from early February; bulls need a breakout for a larger move.
💡 Trading Outlook:
🔺 Bullish case: A clean breakout above 1.4520 could fuel a run toward 1.48, especially if broad USD strength continues.
🔻 Bearish case: A close below 1.4360 would break the channel, signaling a possible pullback toward 1.42.
Bulls remain in charge for now, but the rally needs follow-through to sustain the upside momentum. Keep an eye on that 1.45 handle!
What’s your next move—ride the trend or wait for a pullback?

EURGBP Potential UpsidesHey Traders, in today's trading session we are monitoring EURGBP for a buying opportunity around 0.82500 zone, EURGBP is trading in an uptrend and currently is in a correction phase in which it is approaching the trend at 0.82500 support and resistance area.
Trade safe, Joe.

NASDAQ Potential DownsidesHey Traders, in today's trading session we are monitoring NAS100 for a selling opportunity around 20700 zone, NASDAQ is trading in a downtrend and currently is in a correction phase in which it is approaching the trend at 20700 support and resistance area.
Trade safe, Joe.

NZDUSD Potential DownsidesHey Traders, in today's trading session we are monitoring NZDUSD for a selling opportunity around 0.56400 zone, NZDUSD is trading in a downtrend and currently is in a correction phase in which it is approaching the trend at 0.56400 support and resistance area.
Trade safe, Joe.

GBPUSD Potential DownsidesHey traders, in today's trading session we are monitoring GBPUSD for a selling opportunity around 1.27400 zone, GBPUSD is trading in a downtrend and currently is in a correction phase in which it is approaching the trend at 1.27400 support and resistance area.
Trade safe, Joe.

Gold Going To ATH!Gold Market Update:
The gold price has successfully broken above the bearish Falling Volume Gap (FVG) previously identified on the chart. This technical development suggests a potential bullish reversal.
Near-Term Outlook:
The market is expected to retest the $2912-$2915 level, which will provide confirmation for a buy signal. A successful retest and close above this level will prompt a buy recommendation, targeting the all-time high (ATH) liquidity level.
Alternative Scenario:
Conversely, if the gold price closes below the $2912-$2915 level, a bearish outlook will prevail, and investors should prepare for potential downside momentum.

CADCHF Buy Trade Idea!CADCHF buy trade can be taken above the mentioned area as it's break higher high on 4hrs to target mentioned in the chart.
Manage your risk according to your account size!

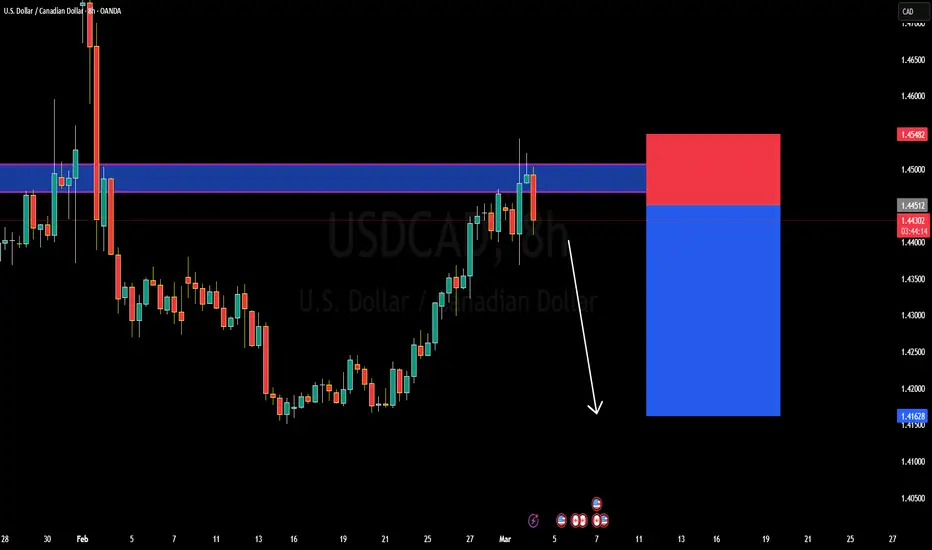
Why USDCAD Dropping? Technical and fundamentalsUSDCAD is currently trading around 1.44200, facing strong resistance at this level. The pair has tested this resistance multiple times and is showing signs of rejection, indicating a potential bearish reversal. If sellers gain control, we could see a downward move toward the 1.42200 target. This setup aligns with key technical patterns, suggesting that the rejection from resistance could drive further downside momentum.
From a technical perspective, the resistance level at 1.44200 has proven to be a strong barrier for buyers, leading to repeated pullbacks. If price fails to break above this zone, bearish pressure is likely to increase. A confirmed rejection with a strong bearish candlestick formation could provide further confirmation of a downtrend, making this a high-probability short setup.
Fundamentally, USDCAD’s movement is influenced by the strength of the US dollar and oil prices, as Canada’s economy is heavily linked to crude oil. Any rebound in oil prices could strengthen the Canadian dollar, adding to the bearish case for USDCAD. Additionally, market expectations regarding Federal Reserve interest rate policy and economic data releases could play a crucial role in shaping the pair’s next move.
In summary, USDCAD is facing significant resistance at 1.44200, with clear rejection signals indicating potential downside toward 1.42200. Traders should watch for further bearish confirmations while considering fundamental drivers like oil price fluctuations and central bank policies to validate the trade setup.