EUR/USD: Bearish reversal signal!EUR/USD is showing signs of a bearish reversal around 1.04900, completing a Harmonic pattern.
Strategy:
Sell below 1.04800
Stop loss: 1.05039
Take profit: 1.04240
Wait for bearish confirmation before entering!
Technical Analysis

EURNZD: Massive Breakout 🇪🇺🇳🇿
EURNZD violated a huge resistance cluster and closed above that.
The next key level is 1.8765.
I will look for a pullback/little correction to buy then, expecting a rise.
❤️Please, support my work with like, thank you!❤️
I am part of Trade Nation's Influencer program and receive a monthly fee for using their TradingView charts in my analysis.

Xag/Usd Short Idea I was anticipating price to get to 31.847 yesterday but it didn't. Maybe my point of interest is going to get triggered today.
Anticipating a nice rejection in that zone then I'll short silver down to clear some liquidities resting below.
Kindly boost if you find this insightful 🫴

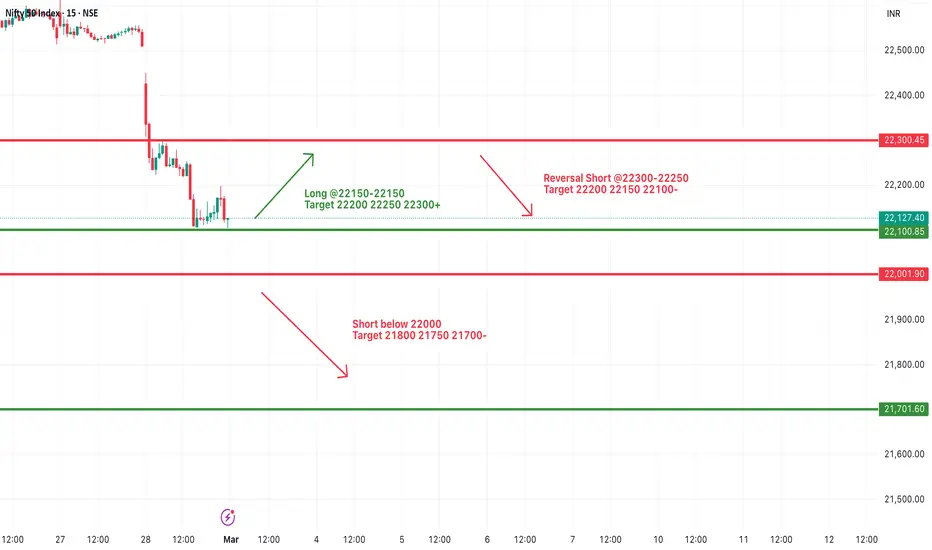
#NIFTY Intraday Support and Resistance Levels - 04/03/2025Gap down opening expected in nifty near the 22050 level. After opening if nifty sustain above 22050 level then only expected upside movement in index. Upside 22300 level will act as a strong resistance for today's session. Major downside fall expected in nifty in case it's starts trading below 22000 level. This downside can goes upto 21700 level.

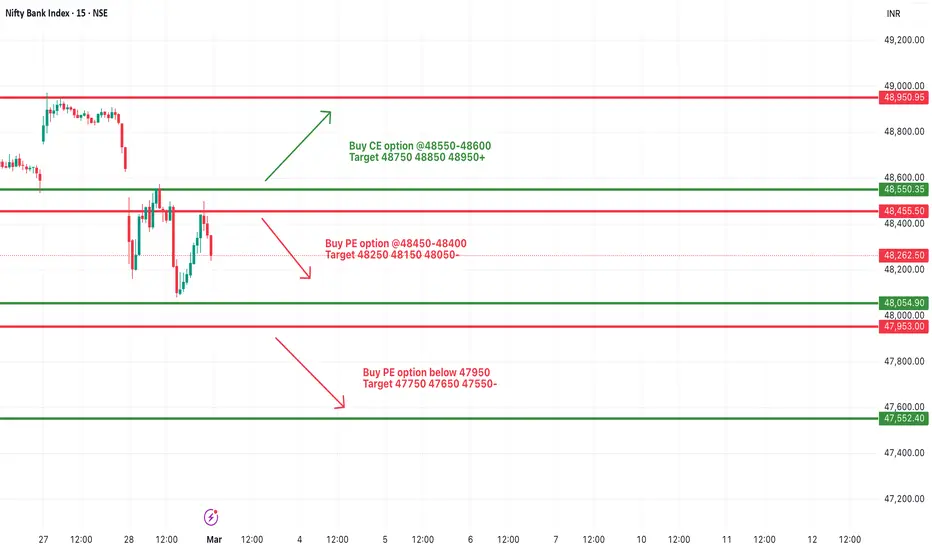
[INTRADAY] #BANKNIFTY PE & CE Levels(04/03/2025)Today will be slightly gap down opening expected in market. After opening important level for banknifty is 48050. If it is sustain above this level then expected upside rally upto the 48450 level. Major downside expected below 47950. This downside can be possible of 400-500+ points in index. Upside 48450 level will act as a strong resistance for today's session.

Nightly $SPY / $SPX Scenarios for March 4, 2025 🔮🔮
🌍 Market-Moving News 🌍:
🇺🇸📈 Implementation of U.S. Tariffs 📈: Effective today, the United States has imposed a 25% tariff on imports from Canada and Mexico, and a 10% tariff on imports from China. These measures aim to address trade imbalances and protect domestic industries.
🇺🇸🏛️ Presidential Address to Congress 🏛️: President Donald Trump is scheduled to deliver his first address to Congress since his re-election, where he is expected to discuss the newly implemented tariffs and their anticipated impact on the U.S. economy.
investopedia.com
📊 Key Data Releases 📊:
📅 Tuesday, March 4:
🏛️ Treasury Auctions 🏛️:
8-Week Bill Auction (6:00 AM ET): The U.S. Department of the Treasury will auction 8-week bills, providing insights into short-term government borrowing costs.
17-Week Bill Auction (10:00 AM ET): A 17-week bill auction will also take place, offering additional perspective on investor demand for U.S. debt instruments.
4-Week Bill Auction (10:00 AM ET): The Treasury will auction 4-week bills, contributing to the understanding of immediate-term borrowing conditions.
⚠️ Disclaimer: This information is for educational and informational purposes only and should not be construed as financial advice. Always consult with a professional financial advisor before making investment decisions.⚠️
📌 #trading #stockmarket #economy #news #trendtao #charting #technicalanalysis

TradeCityPro | BIGTIMEUSDT Final Downtrend?👋 Welcome to TradeCityPro Channel!
Let's analyze and review the new gaming coin BIGTIME and see what the market is going to be like. I feel like we're going to see the final downtrend.
🌐 Bitcoin Overview
Before starting today's altcoin analysis, let's look at Bitcoin on the 1-hour timeframe. Since yesterday, Bitcoin experienced a correction, which was necessary for the market, and it pulled back to the 102135 range. The next trigger for a long position will be a breakout above 104714.
Yesterday's correction, coupled with an increase in Bitcoin dominance, caused noticeable declines in some altcoins. This highlights the importance of monitoring BTC pairs in your checklist these days.
📊 Weekly Timeframe
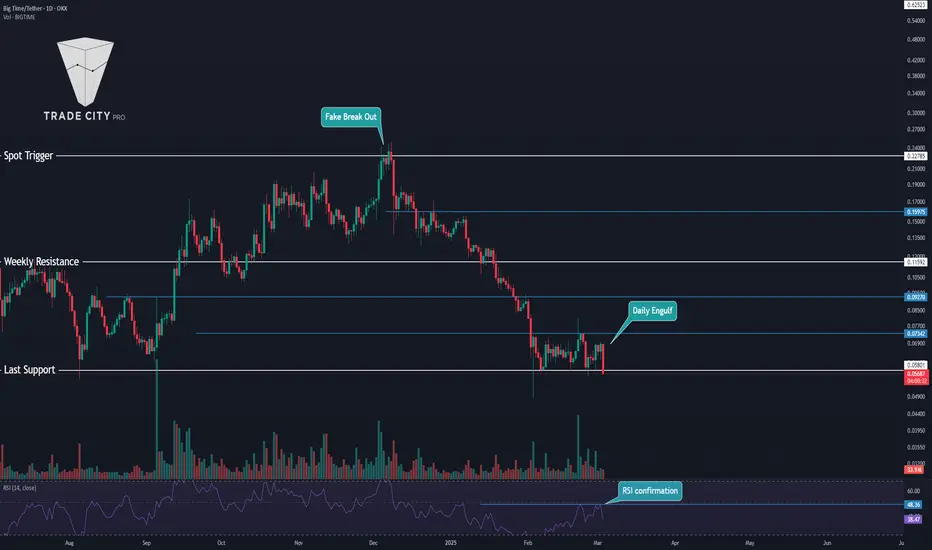
This coin is not in an interesting situation on the weekly time frame and after being rejected from the resistance of 0.22109, it is continuing its downward trend and is recording a lower high and low
If the weekly candle closes like this and we lose the support of 0.06479, the declines will continue and if you are holding this coin, I suggest you exit temporarily and if it enters again, you will simply enter with a smaller number of this coin and your number of Tethers will be preserved
They are not really in good conditions for buying right now, but if the support is faked, we can get a trigger from them, but normally the best trigger is after the failure of 0.22109, but I repeat, the fake of this support can form a new trend!
📈 Daily Timeframe
The situation is the same on the weekly time frame and the probability of a fall is higher than ever, and after the rejection of this important resistance at 0.22785, we have experienced a 75% drop so far!
After this drop, we went into the range box between 0.05801 and 0.07342, and it is natural to suffer a little until our RSI rejected the middle line of 50, which again increased the probability of a fall.
Also, today's daily candle is very important, and if it closes like this, we are engulfing a few of our previous candles and the probability of a support floor breakdown is higher than ever, so you can open a short position and exit the spot, and your second entry for the spot breakdown will be 0.09270!
📝 Final Thoughts
Stay calm, trade wisely, and let's capture the market's best opportunities!
This analysis reflects our opinions and is not financial advice.
Share your thoughts in the comments, and don’t forget to share this analysis with your friends!
Falling Resistance Trendline Breakout on 2 hr Timeframe.Hello everyone, i hope you all will be doing good in your life and your Trading as well. Today i have analysed gold chart and found it has given breakout of falling resistance trendline, i am expecting momentum for upside in this. Probability is high it should travel towards our target area. The volume has been increasing, suggesting strong buying interest, and the RSI at 62.32 is in the bullish zone, confirming the upward momentum. Additionally, the MACD crossover adds further confidence to this bullish setup. The ideal entry point is when the price breaks above the resistance at 2,955.16 . Set the stop loss just below the support level at 2,860.96 to manage risk. For targets, consider aiming for 2,965.00 , 2,975.00 , and 2,985.00 , with the final target around 2,995.00 . If the breakout holds, this setup could present a strong uptrend continuation.
Disclaimer:- This analysis is for educational purposes only. Please trade responsibly and consult a financial advisor before making any decisions.
If you found this analysis helpful, don’t forget to like, follow, and share your thoughts in the comments below! Your support keeps me motivated to share more insights. Let’s grow and learn together—happy trading!

Coffee Futures Outlook: Potential Corrections Ahead After HistorCoffee futures have experienced a strong upward movement, breaking their all-time high and unlocking Fibonacci-based mirroring and projection targets. However, the manner in which the price reached this level—overextended and distanced from its moving averages—combined with last month’s candlestick signaling selling pressure, suggests a high probability of corrective movements in the coming months. Should a pullback occur, it will be crucial to monitor how the price reacts upon testing the 20-period moving average.

Solana Reverses Downtrend: Trump's View on Crypto and What Next.Solana Breaks Downtrend Line: Trump’s Crypto Stance and Key Resistance at $180
Solana has recently broken the downtrend line on its daily timeframe, which has garnered significant attention in the crypto market. This shift in momentum comes amidst former President Donald Trump’s comments on cryptocurrencies, where he named XRP, Solana, and Cardano as potential candidates for a U.S. crypto reserve. His statements have sparked renewed interest in these assets, pushing their value upward.
Currently, Solana is facing resistance at the $180.00 level. For traders looking to enter a long position, it’s crucial to wait for a breakout above this key resistance. Confirming the breakout would require the price to close above the $180 level in a 4-hour timeframe. Until then, caution is advised, as the market continues to test this critical threshold.
Traders should monitor the situation closely for any signs of a breakout or rejection at the $180 level. If Solana manages to close above this level, it could signal the next phase of its upward momentum, with potential for further gains. However, patience is essential to ensure the breakout is confirmed before entering any long positions.

Update gold today!Dear traders!
During the Asian session on Monday, gold is attracting some buyers, aiming for the $2,900 level. Geopolitical uncertainty surrounding the Russia-Ukraine conflict continues to support the precious metal while putting pressure on the US dollar, further aiding gold’s short-term recovery.
However, from a technical perspective, gold remains below the EMA 34 and EMA 89, indicating that the bearish trend is still in control. The key resistance zone at $2,892 - $2,895 could be a crucial area where sellers re-enter the market. If gold fails to break above this level, we may see a renewed downward move, reinforcing the dominance of the bears.

EURUSD: The downtrend remains intact!Dear traders!
Currently, EURUSD is pausing its three-day losing streak, trading around 1.0417 during the Asian session on Monday. The pair's recovery is driven by a weaker US dollar, following the release of the January Personal Consumption Expenditures (PCE) inflation data on Friday, which aligned with forecasts and eased concerns over an unexpected inflation spike in the US.
However, the upside remains challenging, as the downtrend channel is still intact, and there are no significant reversal signals from the EMA 34 and 89. If the resistance levels within the channel hold firmly under bearish pressure, the downward trajectory is expected to persist, potentially pushing EURUSD towards 1.0363 (gap-filling level) and even lower, towards the lower boundary of the trend channel, as indicated on the chart.

Gold price today: The decline continues!Dear traders! What do you think about OANDA:XAUUSD – Buy or Sell?
Yesterday, gold continued its downward trend, dropping $27 from its highest point in the previous session at $2,885 per ounce. On March 1, gold closed the week negatively at $2,858 per ounce.
The main reason for this sharp decline in gold prices was the strengthening US dollar. The USD Index surged to 107.66, its highest level in the past 10 days, as financial markets grew concerned over the US administration's aggressive trade policies.
Specifically, former President Donald Trump confirmed a 25% tariff on imports from Mexico and Canada, effective March 4. Additionally, he announced an extra 10% tariff on Chinese goods. This policy has fueled uncertainty in the market, pushing investors toward the USD as a safe-haven asset, which has negatively impacted gold.

#NIFTY Intraday Support and Resistance Levels - 03/03/2025Gap up opening expected nifty near 22300 level. After opening expected reversal from this level. Downside 22000-22100 zone will act as a strong support for nifty. Any strong further bearish rally only expected below 22000 level. In case nifty gives breakdown of this level can leads major downside upto 21700.
[INTRADAY] #BANKNIFTY PE & CE Levels(03/03/2025)Today will be gap up opening expected in index near 48500 level. After opening expected reversal from this level for further downside in market. Major downside expected if banknifty starts trading below 47950 level this downside rally can goes upto 47550 level. Any bullish rally only expected if banknifty starts trading and sustain above 48550 level.
Weekly $SPY / $SPX Scenarios for March 3 – March 7, 2025🔮 Weekly AMEX:SPY / SP:SPX Scenarios for March 3 – March 7, 2025 🔮
🌍 Market-Moving News 🌍:
🇺🇸📊 Anticipated U.S. Jobs Report 📊: The Bureau of Labor Statistics will release the February employment report on Friday, March 7. Economists expect an increase of approximately 133,000 nonfarm payrolls, with the unemployment rate holding steady at 4%.
🇪🇺💶 ECB Interest Rate Decision 💶: The European Central Bank is scheduled to announce its monetary policy decision on Thursday, March 6. Markets anticipate a 0.25% rate cut, which would adjust the deposit facility rate to 2.5%.
🇨🇳📈 China's Economic Targets 📈: During the National People's Congress, China is expected to set its economic growth target at around 5% for the year. The government may introduce measures to boost consumption and support growth amid global economic uncertainties.
📊 Key Data Releases 📊:
📅 Monday, March 3:
🏭 ISM Manufacturing PMI (10:00 AM ET) 🏭: This index measures the health of the U.S. manufacturing sector. A reading above 50 indicates expansion, while below 50 signifies contraction.
📅 Wednesday, March 5:
🏢 ISM Services PMI (10:00 AM ET) 🏢: This index assesses the performance of the U.S. services sector, with readings above 50 indicating expansion.
Trading Economics
📅 Thursday, March 6:
📉 Initial Jobless Claims (8:30 AM ET) 📉: Weekly data indicating the number of individuals filing for unemployment benefits for the first time.
📦 Factory Orders (10:00 AM ET) 📦: This report details the dollar level of new orders for both durable and non-durable goods, providing insight into manufacturing demand.
📅 Friday, March 7:
👷♂️ Nonfarm Payrolls (8:30 AM ET) 👷♂️: A key indicator of employment trends, reflecting the number of jobs added or lost in the economy, excluding the farming sector.
📈 Unemployment Rate (8:30 AM ET) 📈: The percentage of the total workforce that is unemployed and actively seeking employment during the previous month.
💵 Average Hourly Earnings (8:30 AM ET) 💵: This metric indicates the month-over-month change in wages, providing insight into consumer income trends.
⚠️ Disclaimer: This information is for educational and informational purposes only and should not be construed as financial advice. Always consult with a professional financial advisor before making investment decisions.⚠️
📌 #trading #stockmarket #economy #news #trendtao #charting #technicalanalysis

Mon 3rd Mar 2025 BTC/USD Daily Forex Chart Buy SetupGood morning fellow traders. On my Daily Forex charts using the High Probability & Divergence trading methods from my books, I have identified a new trade setup this morning. As usual, you can read my notes on the chart for my thoughts on this setup. The trade being a BTC/USD Buy. Enjoy the day all. Cheers. Jim

Bitcoin - Weekly Forecast - Technical Analysis & Trading Ideas!Midterm forecast:
73777.00 is a major support, while this level is not broken, the Midterm wave will be uptrend.
Technical analysis:
A trough is formed in daily chart at 78181.05 on 02/28/2025, so more gains to resistance(s) 98489.63, 101430.12, 105431.17 and more heights is expected.
BITSTAMP:BTCUSD
Take Profits:
94200.00
98489.63
101430.12
105431.17
109932.89
115000.00
120000.00
125000.00
130000.00
134142.91
__________________________________________________________________
❤️ If you find this helpful and want more FREE forecasts in TradingView,
. . . . . Please show your support back,
. . . . . . . . Hit the 👍 BOOST button,
. . . . . . . . . . . Drop some feedback below in the comment!
🙏 Your Support is appreciated!
Let us know how you see this opportunity and forecast.
Have a successful week,
ForecastCity Support Team

CADJPY Buy Trade IdeaCADJPY buy trade can be taken above the mentioned area as it's break higher high on 4hrs to target mentioned in the chart.
Manage your risk according to your account size!

USDJPY Buy TradeUSDJPY buy trade can be taken below the mentioned area as it's break higher high on 4hrs to target mentioned in the chart.
Manage your risk according to your account size!

EURUSD: Bearish Outlook For Next Week Explained 🇪🇺🇺🇸
With the Friday's turmoil in the White House,
EURUSD went down sharply.
The price broke and closed below a significant daily support.
It is a strong event that increases the probabilities that the market
will continue going lower.
Next support will be 1.032
❤️Please, support my work with like, thank you!❤️

BTC DOMINANCE 19 MAY ALTCOIN SEASONN !!!I expect BTC dominance to break downward by May 19. I believe dominance will touch 64% and then decline. We are very close to ALTCOIN SEASON—buckle up and keep an eye on the chart!
BOOOOMMM

DOT Reaching Oversold Levels – Buy the Dip?DOT/USDT is currently trading within a well-defined range, with a key support zone around $3.50 - $4.00 and a major resistance zone near $10 - $11. The price has bounced multiple times from support and faced repeated rejections at resistance, highlighting a strong consolidation phase.
The Stochastic RSI is oversold, indicating that a potential reversal from support could be in play. If buyers step in at this level, DOT may attempt another move toward the resistance zone.
DYOR, NFA
