GOLD(XAUUSD) -Weekly forecast,Technical Analysis & Trading Ideas💡 GOLD ( OANDA:XAUUSD )
💡 Daily Timeframe:
As forecasted last week, gold started its decline when it hit the red channel line.
This decline will continue, but the support area of 2789.95 to 2772.38 could trigger a rebound.
So, given the long-term uptrend, we can use this area as a long-term BUY ZONE.
💡 H4 Timeframe:
The uptrend is broken, and price is in an impulse wave.
The bearish wave is expected to continue as long as the price is below the strong resistance at 2893.51
💡 H1 Timeframe:
2879.11 support is broken now. It will act as a Resistance now!
Forecast:
Correction wave toward the Sell Zone
Another Downward Impulse wave toward Lower TPs
SL: Above 2893.51
__________________________________________________________________
❤️ If you find this helpful and want more FREE forecasts in TradingView,
. . . . . . . . Hit the 'BOOST' button 👍
. . . . . . . . . . . Drop some feedback in the comments below! (e.g., What did you find most useful? How can we improve?)
🙏 Your support is appreciated!
Now, it's your turn!
Be sure to leave a comment; let us know how you see this opportunity and forecast.
Have a successful week,
ForecastCity Support Team
Technical Analysis

#VRUSDT continues its uptrend📈 LONG BYBIT:VRUSDT.P from $0.011718
🛡 Stop Loss: $0.011470
⏱ 1H Timeframe
⚡ Action Plan:
✅ BYBIT:VRUSDT.P price broke the resistance level and is consolidating above it, confirming a bullish scenario.
✅ The asset is trading above the POC (Point of Control) at $0.00862, indicating buyer dominance.
✅ Increasing volume on the breakout confirms the strength of the upward movement.
🎯 Target TP Levels:
💎 TP 1: $0.012110
📢 A breakout above $0.011718 will confirm the continuation of the uptrend.
📢 POC $0.00862 remains a key support zone.
📢 Rising volume at the breakout suggests a high probability of reaching target levels.
📢 Partial take-profit at TP1 ($0.012110) helps minimize risks in case of a pullback.
🚀 BYBIT:VRUSDT.P continues its uptrend – watch for upward movement and secure profits at TP!

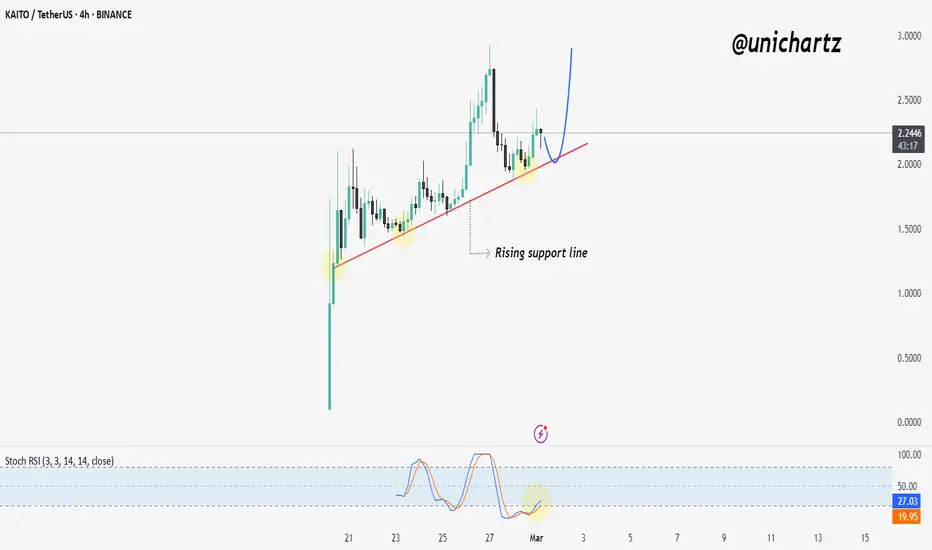
KAITO Holding Rising Support – Is a Big Move Coming?$KAITO/USDT is respecting a rising support line, with price bouncing multiple times from this level. The current retest suggests a potential bullish continuation, especially with the Stochastic RSI in the oversold zone, indicating a possible reversal.
If the trendline holds, we may see a strong upward move, targeting previous highs around $2.50 - $3.00. However, a break below the support could invalidate the bullish outlook.
DYOR, NFA
How to Find Best Supply and Demand Zones/Areas in Forex & Gold
In this article, I will show you the strongest supply and demand zones.
These zones are called confluence zones.
I will teach you to identify these areas properly and explain how to apply it in Forex and Gold trading.
Let's start with a short but important theory.
In technical analysis, there are 2 types of supports and resistances.
Horizontal structures are supports and resistance that are based on horizontal key levels.
Vertical structures are supports and resistance that are based on trend lines.
A confluence supply or demand zone, will be the area of the intersection between a horizontal and vertical structures.
Look at GBPJPY pair. I underlined a significant horizontal support and a rising trend line - a vertical support.
We see a clear crossing of both structures.
The trend line and a horizontal support will compose a narrow, contracting area. It will be a confluence demand zone.
Within, with a high probability, a high volume of buying orders will concentrate, and a strong bullish movement will initiate after its test.
Above is one more example of a powerful demand zone.
It was spotted on a Gold chart.
Now let's discuss the supply zone.
There are 2 strong structures on GBPNZD: a vertical resistance - a falling trend line and a horizontal resistance.
These 2 resistances will constitute a confluence supply zone.
That is a powerful resistance cluster that will concentrate the selling orders. Chances will be high to see a strong bearish movement from that.
There is a strong supply zone on CHFJPY that is based on the intersection of a wide horizontal resistance and a falling trend line.
Supply and demand zones that we discussed are very significant. Very often, strong bullish and bearish waves will initiate from these clusters.
Your ability to recognize these zones will help you to make accurate predictions and identify a safe point to open a trading position from
❤️Please, support my work with like, thank you!❤️

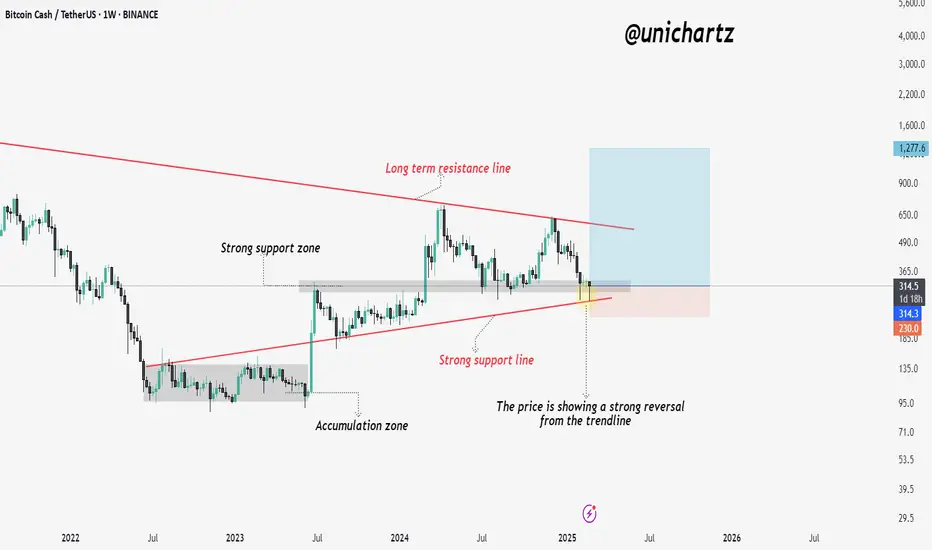
Bitcoin Cash at Critical Trendline – Next Big Move?Bitcoin Cash (BCH/USDT) is currently showing signs of a strong reversal after testing a key support zone and the ascending trendline. This level has acted as critical support in previous price cycles, making it an important area to watch.
The price has rebounded from the strong support line, which aligns with the accumulation zone from early 2023. Additionally, BCH remains within a long-term descending channel, with the upper resistance line acting as a ceiling for previous bullish moves.
MINA ANALYSIS📊 ##MINA Analysis
✅There is a formation of Descending triangle pattern on weekly chart. Also #MINA is trading around its all time low level. If the price sustains here and give a bullish move then we could expect a bullish move otherwise we would see more dip.
👀Current Price: $0.3220
⚡️What to do ?
👀Keep an eye on ##MINA price action and volume. We can trade according to the chart and make some profits⚡️⚡️
##MINA #Cryptocurrency #TechnicalAnalysis #DYOR

BTCUSD: Bearish Pattern Meets Bullish Liquidity – What’s Next?
📉 Bearish Outlook on LTF
On the 12H timeframe, a Head & Shoulders pattern is in play, with a projected target of $59,117.99 . This level aligns perfectly with the liquidity zone on the 4D chart, making it a key area of interest.
📈 Bullish Outlook on HTF
If buyers step in at this liquidity zone ($58,890.48) , BTC could see a second retest of the higher timeframe range before potentially reclaiming bullish momentum toward $146,750.87 .
🔍 Smart Money Perspective:
- A breakdown to GETTEX:59K confirms the Head & Shoulders pattern.
- A strong reversal from liquidity could turn this move into a second retest , fueling a long-term uptrend.
🎯 What’s Next?
Are we seeing a bearish continuation or the foundation for a massive reversal? Share your thoughts below!

Gold price update: Sharp decline from all-time high!Dear friends!
Global gold prices have fallen to their lowest level in over a week, driven by the strengthening U.S. dollar. Investors are closely watching key inflation data, which could provide important clues about the Federal Reserve’s monetary policy. Meanwhile, the U.S. dollar has risen by 0.2%, pushing the USD Index (.DXY) further away from its 11-week low. This appreciation makes gold more expensive for investors holding other currencies.
On the other hand, U.S. President Donald Trump has raised hopes of a one-month delay in imposing higher tariffs on imports from Mexico and Canada, while also proposing a 25% tariff on European automobiles and goods. This uncertainty has driven investors toward the U.S. dollar, adding further pressure on gold prices, which were already facing profit-taking pressure after reaching record highs.

EURUSD: Bearish Wave Continues to Dominate!EURUSD continued its downward trajectory on Thursday, losing nearly 0.9% and slipping below the key 1.0400 support level for the first time in nearly two weeks. The decline was driven by strong USD buying pressure across the market.
The U.S. Dollar Index (DXY) reclaimed the 107.00 level, reaching a fresh six-day high, supported by a modest uptick in both U.S. and German bond yields. The dollar’s strength reflects ongoing concerns over U.S. tariffs and fresh doubts about the health of the U.S. economy, following weaker-than-expected economic data in recent days. These factors have weighed heavily on EURUSD.
From a technical perspective, the pair has broken below an ascending trendline, confirming a shift in momentum towards the downside. This reinforces the bearish outlook, as no clear bottom formation has been established yet. If EURUSD stages a recovery, it is likely to encounter resistance near the confluence zone of the EMA 34, EMA 89, and the newly formed resistance area, which could trigger renewed selling pressure. For now, the bearish bias remains intact, with further downside potential unless a decisive recovery above the resistance zone materializes.

GBPUSD: The trend of discounts prevails?Hello everyone, great to have you back for today's discussion on GBPUSD!
Currently, GBPUSD has extended its decline, trading below 1.2600 as market pressure intensifies. Risk sentiment has worsened following a series of U.S. economic data releases, which indicate weakness in the overall U.S. economy while also signaling a persistent rise in core inflationary pressures.
From a technical standpoint, the pair has broken below the ascending trendline, confirming a bearish breakout. The bearish momentum remains strong, with no clear signs of a bottom forming yet. If GBPUSD stages a corrective pullback, it is likely to face resistance around the 0.5-0.618 Fibonacci retracement zone, which aligns with the confluence of EMA 34, EMA 89, and the newly established resistance area. This setup could reinforce selling pressure, making it a key level to watch.

EURUSD Potential DownsidesHey Traders, in the coming week we are monitoring EURUSD for a selling opportunity around 1.04200 zone, EURUSD is trading in a downtrend and currently is in a correction phase in which it is approaching the trend at 1.04200 support and resistance area.
Trade safe, Joe.

GBPUSD Breakout and Potential RetraceHey Traders, in the coming week we are monitoring GBPUSD for a selling opportunity around 1.26500 zone, GBPUSD was trading in an uptrend and successfully managed to break it out. Currently is in a correction phase in which it is approaching the retrace area at 1.26500 support and resistance area.
Trade safe, Joe.

AUDJPY Trade IdeaAUDJPY sell trade can be taken below the mentioned area to target mentioned in the chart.
Manage your risk according to your account size!

ETH ANALYSIS🚀#ETH Analysis :
🔮As we can see in the chart of #ETH that there is a formation of Descending Channel Pattern in #ETH. As we know crypto market is bearish then we could expect more bearish move in alt coins then after that a bullish move could be expected
🔰Current Price: $2229
⚡️What to do ?
👀Keep an eye on #ETH price action. We can trade according to the chart and make some profits⚡️⚡️
#ETH #Cryptocurrency #TechnicalAnalysis #DYOR

Trump Pump. Trump Dump. Trading Family,
We had our Trump pump. Now, we are seeing a Trump dump. Tariffs and other geopolitical events are causing market uncertainty. Let's take a look at our charts to find out how much more pain we are in for. And, a positive sign. Smaller cap altcoins and many memecoins appear to be holding strong!
✌️ Stew

GBPUSDGBPUSD Breakout from the massive range and now has tested its previous Lower High as a Deep Pullback
I am anticipating it as a short entry with the RR of 1:3

GOLD → False breakdown before further declineOANDA:XAUUSD updating lows within the changing local trend structure. The price is currently testing the liquidity zone at 2852, with a potential rebound before further downside movement.
Gold registered its lowest level in two weeks, dropping below $2,900 in Asia on Friday, breaking an eight-week bullish streak. The metal remains under pressure from the stronger U.S. dollar, influenced by Trump's tariff policies and U.S. economic conditions. Trump confirmed that tariffs on Canada and Mexico will take effect as scheduled on March 4 and also threatened to impose a 25% tariff on European Union imports, along with an additional 10% on Chinese goods. Additionally, weak U.S. GDP data (2.3% in Q4) and rising jobless claims have further supported the dollar. Traders are now awaiting the U.S. PCE Price Index to assess the Fed's interest rate outlook and its impact on gold.
A false breakdown at 2852 could trigger a retracement toward the 0.618 Fibonacci imbalance zone at 2877 or the 0.5 level at 2885 before resuming the decline. Given both weak fundamental and technical conditions, gold may attempt to retest its recent lows.
Best regards, Bentradegold!

CRUDE OIL (WTI): Nice Setup to Sell
WTI OIL looks bearish after a test of a key daily horizontal resistance.
A formation of a head & shoulders pattern on that and a violation of its neckline
indicate a highly probable intraday bearish movement.
The price will reach at least 69.3 level soon.
❤️Please, support my work with like, thank you!❤️

USDCAD: Back to Bullish Trend 🇺🇸🇨🇦
USDCAD is going to continue rising after a confirmed breakout
of a significant daily resistance.
Goals: 1.45 / 1.46
❤️Please, support my work with like, thank you!❤️

Gold breaks out of consolidation, facing bearish pressureGold has officially exited its previous consolidation phase, experiencing a sharp decline from the $2,950 region and reaching a low near $2,878. The breakdown of the rising wedge pattern has triggered increased selling pressure, confirming a shift in momentum towards the downside.
Currently, gold is making a slight recovery, trading around $2,919. However, the bearish trend remains dominant, leaving the price vulnerable to further downside moves. If gold fails to reclaim the $2,930 - $2,940 zone, the downward momentum may persist, targeting $2,905 as the first support level, with a potential extension toward $2,879.
Wishing you successful trades!

Nightly $SPY / $SPX Scenarios for 2.28.2025 🔮 🔮
🌍 Market-Moving News 🌍:
🇺🇸📈 PCE Inflation Data Release 📈: The Federal Reserve's preferred inflation measure, the Personal Consumption Expenditures (PCE) Price Index, is set to be released. Economists predict a 0.3% rise in January and a 2.5% year-over-year growth. This data will provide insights into inflation trends and potential monetary policy adjustments.
🇺🇸🛒 Consumer Spending Trends 🛒: Personal income and spending data for January will be released, offering a glimpse into consumer behavior amid ongoing economic uncertainties. Analysts anticipate a 0.4% increase in personal income and a 0.1% rise in personal spending.
📊 Key Data Releases 📊:
📅 Friday, Feb 28:
💰 Personal Income and Outlays (8:30 AM ET) 💰: Reports on personal income, consumer spending, and the PCE Price Index for January.
🏠 Pending Home Sales Index (10:00 AM ET) 🏠: Measures housing contract activity, providing insights into the real estate market's health.
📌 #trading #stockmarket #tomorrow #news #trendtao #charting #technicalanalysis

Fri 28th Feb 2025 USD/SGD Daily Forex Chart Buy SetupGood morning fellow traders. On my Daily Forex charts using the High Probability & Divergence trading methods from my books, I have identified a new trade setup this morning. As usual, you can read my notes on the chart for my thoughts on this setup. The trade being a USD/SGD Buy. Enjoy the day all. Cheers. Jim

Fri 28th Feb 2025 GBP/USD Daily Forex Chart Sell SetupGood morning fellow traders. On my Daily Forex charts using the High Probability & Divergence trading methods from my books, I have identified a new trade setup this morning. As usual, you can read my notes on the chart for my thoughts on this setup. The trade being a GBP/USD Sell. Enjoy the day all. Cheers. Jim
