EURUSD: Strong preference for selling strategy!Dear friends!
EURUSD continues to sustain losses below 1.0500 during the early trading hours on Thursday. The pair is under pressure due to the recovery of the US dollar. Meanwhile, the Euro (EUR) weakens following former US President Donald Trump's threat to impose a 25% tariff on the European Union. This development has prevented EURUSD from making significant gains, keeping it limited below the 1.052 resistance level, marked by two recent peaks.
In the short term, EURUSD remains well-supported by bulls around the key support zone of 1.0462. However, this upward move appears to be a temporary consolidation before a potential strong decline, as indicated by the unchanged EMA 34 and 89 levels and a shift in momentum towards a bearish trend. My primary strategy focuses on selling, aiming for further downside if the support level is broken and a new resistance is established.
Wishing you successful trades and profitable opportunities!
Technical Analysis

GBPUSD: Rising within the uptrend channel!Dear traders!
GBPUSD is currently moving within a clear ascending channel, maintaining its bullish trend on the 1-hourchart.
Looking ahead, if the market conditions remain unchanged, we should consider buy positions in line with the trend. Pay close attention to the psychological resistance level at 1.2700, where GBPUSD may gain further momentum or break through to reach higher targets.
Wishing you successful and enjoyable trading!

GBPUSD Daily, H4,H1 Forecasts, Technical Analysis & Trading Idea💡 Daily Timeframe:
FX:GBPUSD has been in a Range Bound recently. It touched and rejected from 1.2700 major resistance today.
A peak is formed in daily chart at 1.27150 on 02/26/2025, so more losses to support(s) 1.25107, 1.23609, 1.22589 and minimum to Major Support (1.20981) is expected.
💡 Four-hour Timeframe:
The uptrend is broken, and price is in an impulse wave.
The bearish wave is expected to continue as long as the price is below the strong resistance at 1.2715
💡 One-hour Timeframe:
1.2640 support is broken now. It will act as a Resistance now!
A strong bearish divergence has also formed in the RSI.
Forecast:
Correction wave toward the Sell Zone
Another Downward Impulse wave toward Lower TPs
SL: Above 1.2715

#TRUMPUSDT – Bearish Scenario, Breakout Down📉 SHORT BYBIT:TRUMPUSDT.P from $12.278
🛡 Stop Loss: $12.599
⏱ 1H Timeframe
⚡ Trade Plan:
✅ The BYBIT:TRUMPUSDT.P price has formed a Bearish Flag and broke its lower boundary, confirming a bearish scenario.
✅ The asset is trading below POC (Point of Control) at $12.978, indicating strong seller dominance.
✅ Increasing volume on the breakdown further confirms the strength of the downward move.
🎯 TP Targets:
💎 TP 1: $12.100
🔥 TP 2: $11.900
⚡ TP 3: $11.785
📢 A close below $12.278 would confirm further downside movement.
📢 POC at $12.978 is a strong resistance level that the price failed to break.
📢 Increasing volume on the drop supports the bearish outlook.
📢 Securing partial profits at TP1 ($12.100) is a smart risk-management strategy.
🚨 BYBIT:TRUMPUSDT.P remains in a downtrend – monitoring for continuation and securing profits at TP levels!

#SHELLUSDT – Bullish Scenario, Expecting a Breakout📈 LONG BYBIT:SHELLUSDT.P from $0.7000
🛡 Stop Loss: $0.6671
⏱ 1H Timeframe
⚡ Trade Plan:
✅ The BYBIT:SHELLUSDT.P price is showing strong momentum after breaking out of a consolidation zone.
✅ The asset has broken above $0.6957 and is holding above this level, signaling a potential continuation of the uptrend.
✅ Increasing volume confirms buyer activity.
🎯 TP Targets:
💎 TP 1: $0.7350
🔥 TP 2: $0.7700
📢 Holding above $0.7000 would confirm further bullish movement.
📢 POC at $0.4671 is far below the current price, indicating a trend shift.
📢 Increasing volume supports the bullish case.
📢 Securing partial profits at TP1 ($0.7350) is a smart risk-management strategy.
🚀 BYBIT:SHELLUSDT.P remains in an uptrend – monitoring for continuation and securing profits at TP levels!

TradeCityPro | LTCUSDT Let's go for spot buying?👋 Welcome to TradeCityPro Channel!
Let's go together to analyze and review Litecoin analysis, one of the oldest coins in the market, and let's go to update the triggers of the previous analysis!
🌐 Overview Bitcoin
Before starting today's altcoin analysis, let's look at Bitcoin on the 1-hour timeframe. Since yesterday, Bitcoin experienced a correction, which was necessary for the market, and it pulled back to the 102135 range. The next trigger for a long position will be a breakout above 104714.
Yesterday's correction, coupled with an increase in Bitcoin dominance, caused noticeable declines in some altcoins. This highlights the importance of monitoring BTC pairs in your checklist these days.
📊 Weekly Timeframe
On the weekly time frame, it is one of the coins that is in a good position compared to the coins and has had the least correction in recent declines and is in this position due to the possibility of ETF approval
There is no need to complicate things in this time frame and after the break of 136.45, we will buy and be above 98.44. This trigger is valid and we do not have much of an exit trigger for the conditions of these days on this chart and for now it is better to continue holding
📈 Daily Timeframe
On the daily time frame, we are also in a good position and we had a good return after the recent market decline due to the Bybit hack and Trump's tariffs and this is a good thing!
After breaking the 75.01 level and exiting the daily box and breaking its ceiling, we moved up to the resistance of 136.45 and are now fluctuating between the 98.44 to 136.45 boxes.
We also had a curve line in this time frame that was a good support for this event and every time we hit it, we made a good move upwards, but after its failure, it can be said that the upward trend moved into the range and went to form a new structure.
To buy spot after the 136.45 trigger is broken, we can buy for spot with a stop loss of 98.44 and as long as we are above 114.38, the 136.45 trigger is very important for us and it shows us more the strength of buyers and in case of a 98.44 break, we will go for 89 and 80 and we will have a price correction.
📝 Final Thoughts
Stay calm, trade wisely, and let's capture the market's best opportunities!
This analysis reflects our opinions and is not financial advice.
Share your thoughts in the comments, and don’t forget to share this analysis with your friends!

#TAOUSDT – Fast Trade, Monitoring Price Action📉 SHORT BYBIT:TAOUSDT.P from $340.00
🛡 Stop Loss: $354.55
⏱ 1H Timeframe
⚡ Trade Plan:
✅ The BYBIT:TAOUSDT.P price is forming a downtrend after breaking a Falling Wedge pattern.
✅ The asset is trading below POC (Point of Control) at $363.85, confirming seller dominance. ✅ After forming a double bottom (Bottom 1 & Bottom 2), the price tested resistance but failed to hold above it.
🎯 TP Targets:
💎 TP 1: $334.00
🔥 TP 2: $328.00
⚡ TP 3: $321.00
📢 This is a fast trade – it's crucial to monitor the coin's behavior and quickly adjust take-profits.
📢 A close below $340.00 would confirm further downside movement.
📢 POC at $363.85 is a key volume area where sellers are in control.
📢 Increasing volume on the drop supports the bearish outlook.
📢 Taking partial profits at TP1 ($334.00) is a smart risk-management strategy.
🚨 BYBIT:TAOUSDT.P remains in a downtrend – monitoring for confirmation and securing profits at TP levels!

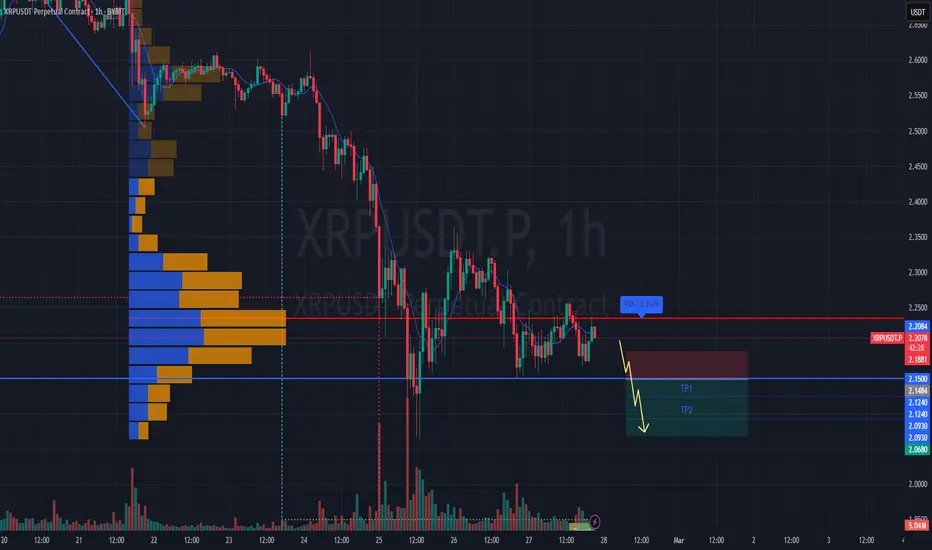
#XRPUSDT – Bearish Scenario, Expecting a Breakdown📉 SHORT BYBIT:XRPUSDT.P from $2.1484
🛡 Stop Loss: $2.1881
⏱ 1H Timeframe
⚡ Trade Plan:
✅ The BYBIT:XRPUSDT.P price is consolidating below POC (Point of Control) at $2.2119, indicating strong seller dominance.
✅ Attempts to push higher have been quickly rejected, suggesting buyer weakness.
✅ If the current support breaks, a strong downward move is likely.
🎯 TP Targets:
💎 TP 1: $2.1240
🔥 TP 2: $2.0930
⚡ TP 3: $2.0680
📢 A close below $2.1484 would confirm further downside movement.
📢 POC at $2.2119 is a major volume area, now acting as resistance.
📢 Increasing volume on the drop supports the bearish outlook.
📢 Taking partial profits at TP1 ($2.1240) is a smart risk-management strategy.
🚨 BYBIT:XRPUSDT.P remains under selling pressure – monitoring for confirmation and securing profits at TP levels!
#CAKEUSDT – Bearish Scenario, Expecting a Breakdown📉 SHORT BYBIT:CAKEUSDT.P from $2.030
🛡 Stop Loss: $2.058
⏱ 1H Timeframe
⚡ Trade Plan:
✅ The BYBIT:CAKEUSDT.P price previously formed a Falling Wedge pattern and three bottoms (Bottom 1, Bottom 2, Bottom 3), followed by a bounce.
✅ However, the asset is trading below POC (Point of Control) at $2.504, which acts as strong resistance. If the price fails to hold above the current levels, a downward continuation is likely.
🎯 TP Targets:
💎 TP 1: $2.008
🔥 TP 2: $1.986
⚡ TP 3: $1.970
📢 A close below $2.030 would confirm further downside movement.
📢 POC at $2.504 is a key volume area acting as resistance.
📢 Increasing volume on the decline signals strong seller activity.
📢 Taking partial profits at TP1 ($2.008) is a smart risk-management strategy.
🚨 BYBIT:CAKEUSDT.P remains under selling pressure – monitoring for confirmation and securing profits at TP levels!

NASDAQ Potential UpsidesHey Traders, in today's trading session we are monitoring NAS100 for a buying opportunity around 20650 zone, NASDAQ is trading in an uptrend and currently is in a correction phase in which it is approaching the trend at 20650 support and resistance area.
Trade safe, Joe.

EURGBP Potential DownsidesHey Traders, in today's trading session we are monitoring EURGBP for a selling opportunity around 0.82900 zone, EURGBP is trading in a downtrend and currently is in a correction phase in which it is approaching the trend at 0.82900 support and resistance area.
Trade safe, Joe.

USDCHF Potential UpsidesHey Traders, in today's trading session we are monitoring USDCHF for a buying opportunity around 0.89000 zone, USDCHF is trading in an uptrend and currently is in a correction phase in which it is approaching the trend at 0.89000 support and resistance area.
Trade safe, Joe.

Ford 1D Investment Aggressive CounterTrend TradAggressive CounterTrend Trade
- short impulse
+ exhaustion volume
+ 1/2 correction
Calculated affordable stop limit
Take profit:
1/3 to 1/2 Month Trend
1/3 to Month T2
1/3 to Year 1/2
Sell F Limit at $14.95 (Good 'til Canceled)
Sell F Limit at $11.57 (Good 'til Canceled)
Sell F Limit at $10.21 (Good 'til Canceled)
Monthly CounterTrend
"- short impulse
+ 1/2 correction
- unvolumed T1
+ support level
+ reverse volume approach
+ volumed manipulation"
Yearly Trend
"+ long impulse
+ volumed T2 level
+ volumed 2Sp+
+ weak test"

USDCHF -Weekly forecast, Technical Analysis & Trading IdeasMidterm forecast:
0.89147 is a major support, while this level is not broken, the Midterm wave will be uptrend.
Technical analysis:
The ascending flag taking shape suggests we will soon see another leg higher.
A trough is formed in daily chart at 0.89115 on 02/25/2025, so more gains to resistance(s) 0.90367, 0.91497, 0.92218 and more heights is expected.
__________________________________________________________________
❤️ If you find this helpful and want more FREE forecasts in TradingView,
. . . . . . . . Hit the 'BOOST' button 👍
. . . . . . . . . . . Drop some feedback in the comments below! (e.g., What did you find most useful? How can we improve?)
🙏 Your support is appreciated!
Now, it's your turn!
Be sure to leave a comment; let us know how you see this opportunity and forecast.
Have a successful week,
ForecastCity Support Team

CRUDE OIL (WTI): Waiting For a Signal to Buy
WTI Crude Oil is stuck on a major rising trend line on a daily.
To buy the market with a confirmation, I am waiting for a bullish
breakout of an intraday 4H resistance.
4H candle close above 69.3 will be a strong bullish signal.
A bullish continuation will be expected at least to 69.9 level then.
❤️Please, support my work with like, thank you!❤️

BTC/USDT Technical Analysis – Rounding Top Breakdown 🔹 Asset: Bitcoin (BTC/USDT Perpetual Futures)
🔹 Timeframe: 1D (Daily)
🔹 Exchange: MEXC
📊 Market Overview:
Bitcoin has formed a rounding top pattern, a classic bearish reversal structure, leading to a strong downtrend. The price has recently broken below key support levels, indicating further downside pressure.
📉 Key Technical Factors:
✅ Rounding Top Formation: The gradual loss of bullish momentum followed by an aggressive sell-off confirms a trend reversal.
✅ Accelerating Downtrend: Angled resistance lines highlight the declining bullish strength, with negative slope angles reinforcing downward momentum.
✅ Critical Support Zone: BTC is currently testing a key support area (~$74,000 - $72,000). A breakdown below this level could accelerate the decline.
📌 Potential Trade Setups:
Bearish Scenario: If BTC breaks below the $74,000 support zone, we could see further downside towards $70,000 or even $65,000 in the short term.
Bullish Reversal: A strong bounce from the current support level with increased volume could invalidate the bearish outlook, pushing BTC back toward $90,000+ resistance.
🔥 Conclusion:
Bitcoin's structure is bearish, with the rounding top pattern playing out as expected. Traders should watch for a confirmed support breakdown or bounce to determine the next move.
🔔 Manage risk and stay updated for further developments! 🚀

DOT/USDT Technical Analysis – Potential Breakout Ahead🔹 Asset: Polkadot (DOT/USDT)
🔹 Timeframe: 1D (Daily)
🔹 Exchange: Bybit
📊 Market Overview:
DOT/USDT has been trading within a well-defined descending parallel channel, indicating a prolonged downtrend. However, recent price action suggests a potential trend reversal fueled by bullish signals.
📈 Key Technical Factors:
✅ Break of Structure (BOS): The price has started to break key structural levels, signaling an early shift in momentum.
✅ Strong Hammer Candle Formation: A bullish hammer appeared at the lower boundary of the channel, indicating buying pressure and potential bottoming out.
✅ Mini & Major Change of Character (ChoCH): A breakout above the mini ChoCH ($6.00) would confirm an early bullish reversal, while a move above the major ChoCH ($7.00) would solidify the bullish trend.
🎯 Potential Trade Setup:
Bullish Scenario: If DOT/USDT breaks out of the descending channel and successfully flips resistance into support (~$6.00), it could push towards $7.00 - $9.00 in the coming weeks.
Bearish Scenario: If the price fails to break out and gets rejected at resistance, we may see a retest of the lower levels (~$4.00 - $4.50) before a stronger move.
🔥 Conclusion:
DOT/USDT is showing promising signs of a trend reversal, but confirmation is needed above key levels. Watch for breakout confirmation and volume surge to support the bullish momentum.
🔔 Stay updated & manage risk accordingly! 🚀
#DOT #Polkadot #Crypto #Trading #TechnicalAnalysis

EURUSD: Uptrend still prevails!Dear traders!
Yesterday, EUR/USD experienced an impressive short-term rebound, briefly reaching the key resistance level of 1.052. However, lacking further momentum, the pair quickly retreated and stabilized within the day's range.
Looking ahead, as long as the ascending channel remains intact and its internal support levels hold firm, buyers are likely to continue their attempt to break through the next key resistance at the upper boundary of the channel.
Wishing you a successful trading day with plenty of profits!

GBPNZD: Bullish Pattern & Breakout 🇬🇧🇳🇿
GBPNZD formed a bullish accumulation pattern on a daily.
Its neckline was broken with a high momentum bullish candle yesterday.
The next strong resistance is 2.236.
It will most likely be the next goal for the buyers.
❤️Please, support my work with like, thank you!❤️

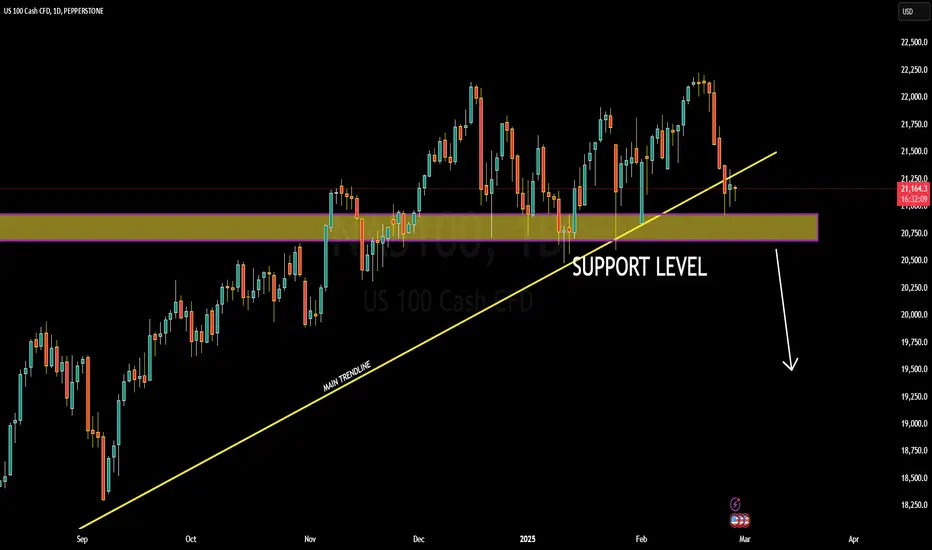
NAS100 at Critical SupportNAS100 is currently trading at 21,150, having completed a falling wedge breakout and now holding at a key support level. The falling wedge is typically a bullish pattern, but in this case, price action suggests a crucial test of support. If this level fails to hold, NAS100 could see significant downside momentum, potentially targeting the 19,000 level.
Technically, a breakdown below this support could confirm a bearish continuation, triggering a strong sell-off. Traders should watch for increased selling pressure and a sustained move below the support zone, which could accelerate bearish momentum. If the support holds, however, NAS100 could attempt a recovery, making this a decisive level to monitor.
Fundamentally, NAS100 remains under pressure due to concerns over Federal Reserve policy, interest rate expectations, and broader market sentiment. Any signs of prolonged high rates or weak earnings from major tech companies could fuel further downside pressure. Additionally, rising bond yields and a stronger US dollar may continue to weigh on the index.
In summary, NAS100 is at a critical support level after a falling wedge breakout, with the potential for a sharp drop if the support breaks. Traders should closely monitor price action, volume, and macroeconomic developments to confirm the next move. A break below this level could open the door for further downside toward 19,000.
XAUUSD: Buy or sell?Gold continues to decline for the second day, trading around $2,913 per ounce, as the market pauses ahead of key inflation data and uncertainty surrounding Trump’s tariff policies. Despite the drop, strong buyer interest at lower levels signals stability, while expectations of further Federal Reserve rate cuts continue to support the metal.If buyers defend key levels, a short-term rebound may occur.

GBPUSD: Buy or sell?Dear traders,
Recently, GBPUSD has struggled to sustain its new high at 1.269, experiencing a slight downward correction while still holding relatively stable at elevated levels. The primary driver behind this decline is the renewed demand for the U.S. dollar, fueled by rising U.S. Treasury yields and the House of Representatives’ approval of the Republican Budget Plan, which has negatively impacted the pair.
As a result, GBPUSD is likely to undergo a short-term corrective move against the trend, seeking new support levels before resuming its upward trajectory.

#TRUMPUSDT – Bearish Scenario, Expecting a Downward Breakout📉 SHORT BYBIT:TRUMPUSDT.P from $12.492
🛡 Stop Loss: $12.785
⏱️ 1H Timeframe
⚡️ Trade Plan:
✅ The BYBIT:TRUMPUSDT.P price continues to decline after a recent sharp drop.
✅ The chart shows that the asset is consolidating below POC (Point of Control) at $13.105, indicating seller dominance.
✅ The price is testing a support level, and a breakdown could trigger a stronger bearish move.
🎯 TP Targets:
💎 TP 1: $12.305
🔥 TP 2: $12.110
⚡️ TP 3: $11.966
📢 A close below $12.492 would confirm the downward move.
📢 POC at $13.105 is a key volume area that now acts as resistance.
📢 Increasing volume on the decline supports the bearish trend.
📢 Securing partial profits at TP1 ($12.305) is a risk-management strategy.
🚨 BYBIT:TRUMPUSDT.P remains under pressure – monitoring for a confirmed breakdown and securing profits at TP levels!
