BTCUSDT (W1)🔍 Market Structure
For many months, the uptrend has been in a channel – clear higher highs and higher lows.
A breakout from the uptrend channel → indicates a change in market structure (BOS) to weekly.
The current move is a correction after a downward impulse, not a new uptrend.
➡️ HTF Bias: BEARISH / Corrective
🧱 Key Levels
🟢 Resistance (now resistance)
98,000 – 100,000 → former support, currently flipping to resistance
109,000 → strong weekly supply / EQ of the previous range
~125,000 → upper band of the old channel (unrealistic without a change in structure)
🔴 Support
85,400 → current reaction zone (local demand)
74,300 → key weekly demand, a very important level
Below: ~68–70k (another HTF zone – not marked, but logical)
📉 Price Action
Strong, impulsive bearish candle + long lower wick → liquidations + panic sell
No strong upward momentum after the rebound → weak demand
Current move = bear flag / bear range
➡️ This does NOT look like the end of the correction.
📊 Volume
High volume on the decline → distribution
Declining volume on the bounce → no real buyers
➡️ Classic pattern: dump → weak bounce → continuation
📈 Indicators
Stochastic RSI (W1)
In the oversold zone, but:
No strong bullish cross + no price impulse
➡️ May grind low for many weeks
CHOP
Falling → market preparing for a bigger move
Direction still more down than up
🧠 Scenarios
🟥 Baseline scenario (most likely)
Rejection 98-100k
Return to 85k
Test 74k
Only then the decision is made: bounce vs. Deeper bear market
🟩 Alternative scenario (less likely)
Weekly close above 100k
Retest of 98k as support
Only then can we consider 109k
❗ Key takeaways
❌ This is not a good time to go long on HTF
❌ The current rebound is a pullback, not a reversal
✅ Shorts only on retests of resistance
✅ Spot DCA only makes sense at 74k ±
Trend Analysis

Btcusd We hv price going to our direction and am still expecting more bullish movement expecting price to get to 100k

NZDCHF REVERSALTechnically:
NZDCHF printed bullish divergence on daily
NZDCHF broke its last lower high and printed higher high
NZDCHF broke bearish trendline
NZDCHF retraced to 0.618 fib level

NZDJPY CONTINUATIONTechnically:
NZDJPY bullish on Daily and 4H
NZDJPY retraced to 0.618 fib level
NZDJPY printing higher high and higher low on daily and 4H
NZDJPY shows still bullish becouse no bearish divergence printed yet
NZDJPY retraced to their demand zone

PUMPUSDT UPDATEPUMP
UPDATE
PUMP Technical Setup
Pattern: Falling Wedge Pattern
Current Price: $0.00226
Target Price: $0.00500 USDT
Target % Gain: 121.24%
Technical Analysis: PUMP is breaking out of a falling wedge pattern on the 1D chart, indicating bullish potential. Price has recently shown strength near the wedge resistance, and a breakout above that level with increasing volume could validate continuation toward the projected target zone near $0.00500. The measured move from the pattern points to extended upside if momentum persists.
Time Frame: 1D
Risk Management Tip: Always use proper risk management.

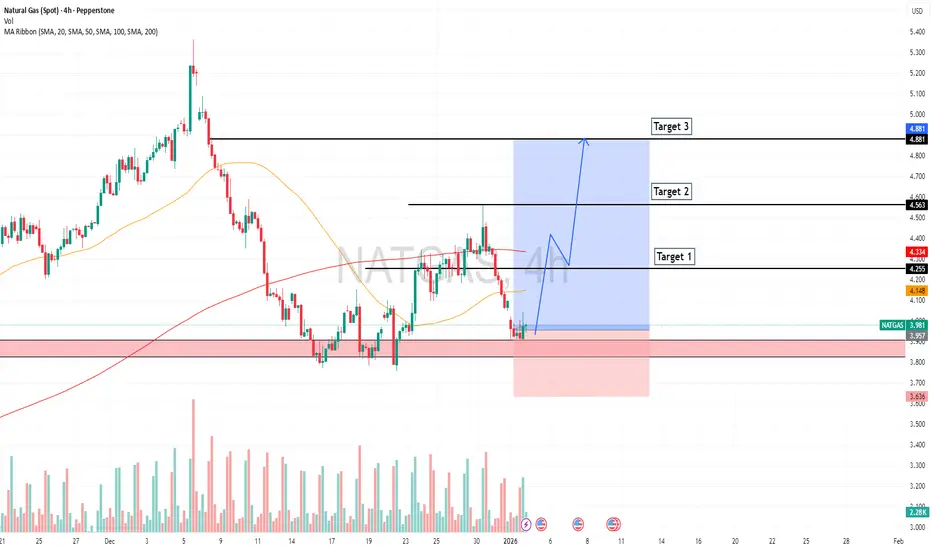
The Natural Gas Will Jump from a Support LevelHello Traders
In This Chart Natural Gas HOURLY Forex Forecast By FOREX PLANET
today Natural Gas analysis 👆
🟢This Chart includes_ (Natural Gas market update)
🟢What is The Next Opportunity on Natural Gas Market
🟢how to Enter to the Valid Entry With Assurance Profit
This CHART is For Trader's that Want to Improve Their Technical Analysis Skills and Their Trading By Understanding How To Analyze The Market Using Multiple Timeframes and Understanding The Bigger Picture on the Charts
Gold will focus on the 4270 support level.
On Friday, I provided a trading strategy in the TradingView community and public groups recommending selling on rallies near 4400-4405. The price reached a high of 4402 during the U.S. trading session before facing selling pressure and declining to around 4310. Following my strategy, our partnered clients executed short positions at 4400, and traders who adhered to the plan secured substantial profits.
I. Market Review and Developments
On Friday (January 2), spot gold experienced a rally followed by a decline. During the Asian and European sessions, prices edged higher, reaching an intraday high of 4402.3 USD/ounce early in the U.S. session before falling to around 4309.9 USD/ounce. It ultimately closed at 4332 USD/ounce, displaying clear signs of "buy the rumor, sell the news" pressure.
Key Market Developments:
CME Margin Hike: The CME Group raised margin requirements for gold, silver, and other metal futures, dampening short-term speculative buying.
Profit-Taking Pressure: Following significant prior gains, some investors opted to take profits or rebalance their portfolios.
Geopolitical Risk Support: Long-term safe-haven demand remains, but its short-term price-driving force has weakened marginally.
II. Technical Analysis: Range-Bound Pattern Persists
Current Structure:
Broad Trading Range: 4270 – 4405 USD/ounce
Key Resistance: 4400-4405 (recent double-top pressure; a breakout is needed for a bullish reversal)
Near-Term Resistance: 4365-4370 (primary rebound resistance for Monday)
Key Support: 4270-4275 (lower boundary of the range; a break below could open further downside)
1-Hour Chart Signals:
Friday's rally and subsequent decline confirm strong selling pressure above 4400.
The closing price of 4332 lies in the lower-middle part of the range, indicating short-term weak consolidation.
III. Trading Strategy for Monday (January 5)
Core Approach:
Prioritize selling on rallies, with buying on dips as a secondary strategy. Closely monitor potential breakouts at the range boundaries.
Strategy 1: Short Position (Primary Strategy)
Entry Zone: 4360 – 4370 USD/ounce
Stop Loss: 4380 – 4385 USD/ounce (Invalidated if price breaks above 4405)
Targets:
First Target: 4330 – 4300
Second Target: 4270 (hold if breached)
Rationale: Technical failure to break prior highs, combined with the CME margin hike curbing speculation, makes the resistance zone an ideal area for short entries.
Strategy 2: Long Position (Secondary Strategy)
Entry Zone: 4270 – 4275 USD/ounce
Stop Loss: 4260 – 4265 USD/ounce (a break below opens further downside)
Targets:
First Target: 4300 – 4330
Second Target: 4350 (requires a break above 4365 to confirm strength)
Rationale: Strong support at the range's lower boundary offers a potential bounce opportunity upon stabilization.
IV. Risk Management and Operational Notes
Position Sizing: Limit individual trades to ≤10% of capital to avoid overexposure in ranging markets.
Stop-Loss Discipline: Strictly enforce 8-10 USD stops; avoid averaging losses.
Key Levels to Watch:
If 4405 is breached, pause short positions and wait for higher levels to re-enter.
If 4270 is broken, prices may decline toward 4230 – 4200; consider following the downtrend.
Timing: Monitor rebound strength during Asian/European hours on Monday; stay alert for data or event-driven volatility during the U.S. session.
V. Medium-to-Long-Term Outlook (2026–2027)
Drivers: Geopolitical tensions, a weaker USD, and central bank gold purchases remain core long-term supports.
Risks: After doubling in two years, the rally may slow. Should macroeconomic conditions improve, a 5% – 20% pullback is possible.
Critical Levels: A break above 4405 could open the path to 4500 – 5000; a drop below 4200 raises the risk of a deeper correction.
Wishing you a wonderful weekend! We extend our sincere gratitude for your continued support and trust.
Looking back on our journey, we have walked side by side—supporting each other through challenges and celebrating triumphs together. Every commitment you've made represents invaluable trust, and every collaboration exemplifies the power of mutual success. The year 2025 brought both achievements and learnings, yet we remain guided by the professional ethos of "staying grounded in victory and resilient in setbacks." We are constantly refining our strategies, strengthening our foundations, and preparing to unlock even greater possibilities.
As a new chapter begins, our team of senior gold investment analysts remains unwavering in our dedication—approaching every opportunity with responsibility, precision, and an unwavering commitment to creating exceptional value for you. Let's stride forward together. May your investment journey be steady and rewarding, your ventures thrive, and your wealth grow exponentially!
Here's to a prosperous and successful new year!

DOGEUSDT UPDATE#DOGE
UPDATE
DOGE Technical Setup
Pattern: Falling Wedge Pattern
Current Price: 0.1237
Target Price: 0.1490
Target % Gain: 121.32%
Technical Analysis: DOGE is breaking out of a falling wedge pattern on the 1D chart, indicating bullish potential. Price is trading near the lower boundary of the wedge and has started to curl upward, suggesting a possible breakout. A confirmed move above the descending resistance trendline could open the path toward the projected upside target zone shown on the chart.
Time Frame: 1D
Risk Management Tip: Always use proper risk management.

TURBO Impulse Followed by Healthy RetracementTURBO printed a strong impulsive move to the upside after a base formation, clearly shifting short-term momentum bullish. Following this expansion, price entered a corrective phase and is now retracing into a well-defined demand zone aligned with Fibonacci retracement levels.
This pullback is so far constructive rather than bearish. As long as price holds above the highlighted demand region, the structure supports continuation toward the previous high and potentially into the upper resistance zone near zero point zero zero two two.
If the demand zone fails to hold, the retracement could extend deeper toward the lower support area around zero point zero zero one six, delaying continuation and resetting structure.
This setup is based on impulse and retracement behavior, demand reaction, and Fibonacci confluence. Confirmation from the demand zone will determine the next directional leg.

#AVAX/USDT : The Calm Before the Squeeze Storm#AVAX
The price is moving in a descending channel on the 1-hour timeframe. It has reached the lower boundary and is heading towards breaking above it, with a retest of the upper boundary expected.
We have a downtrend on the RSI indicator, which has reached near the lower boundary, and an upward rebound is expected.
There is a key support zone in green at 12.80. The price has bounced from this zone multiple times and is expected to bounce again.
We have a trend towards stability above the 100-period moving average, as we are moving close to it, which supports the upward movement.
Entry price: 13.22
First target: 13.38
Second target: 13.74
Third target: 14.11
Don't forget a simple principle: money management.
Place your stop-loss below the support zone in green.
For any questions, please leave a comment.
Thank you.

GBPUSD Range Based Point of InterestQuick Summary
GBPUSD price action is currently unclear, Two key levels stand out at 1.34015 and 1.35020
Both levels showed strong reactions with large wicks from FVG
These areas will be treated as points of interest with targeting the opposite level
Full Analysis
At the moment GBPUSD price action is somewhat confusing and lacks a clear directional bias
The market has highlighted two very important levels that deserve attention
The first level is the low at 1.34015
The second level is the high at 1.35020
At both of these areas price reacted strongly and formed large wicks with immediate rejection from FVG
This behavior indicates that both zones contain significant liquidity and strong participation from both buyers and sellers
Because of these two levels will act as main points of interest, The plan is to remain patient and wait for price to reach either one of them
If price reaches one of these zones a trade will be considered targeting the opposite level
This approach allows trading within a clearly defined range while respecting the strong reactions already shown by the market.

WDC: The "Vault" of the AI Era (Parabolic Channel Breakout)Everyone is obsessed with the "Brains" of AI ( NASDAQ:NVDA , NASDAQ:AMD ), but almost no one is talking about the "Memory." Where does all that data live? Western Digital ( NASDAQ:WDC ).
While the market chases hype, NASDAQ:WDC has quietly entered a Weekly Parabolic Channel. Here is the structural and fundamental breakdown of why this trend is far from over.
1️⃣ THE STRUCTURE:
Respect the Channel 📈 Look at the Weekly Chart (attached). This is textbook "Institutional Accumulation."
The Geometry: Price is strictly respecting a high-velocity Ascending Channel (Blue Zone). Every touch of the bottom trendline has been bought aggressively.
The Breakout: We are currently pressing against the $188 All-Time Highs (Green Line). A weekly close above this level puts us in "Blue Sky Territory" (Price Discovery), where there is zero overhead resistance.
2️⃣ THE FUNDAMENTALS:
The "Beat" Rhythm 📊 Price action is truth, but earnings are the fuel.
Consistency:
Looking at the last 3 quarters (Oct '25, Apr '25), WDC has consistently beaten EPS estimates (Standardized 3.069 vs Estimate 1.589 in Oct).
The Reality: Wall Street keeps underestimating the demand for High-Performance Storage in Data Centers. As long as they keep beating, this trend has a fundamental floor.
3️⃣ THE MACRO:
The "Digital Gold" Correlation 🥇 You asked about metals? Here is the connection. We are seeing Gold and Silver rally, signaling a "Hard Asset" cycle.
The Twist: In the digital economy, Data Storage IS the Hard Asset.
Input Costs:
While rising silver/gold prices increase manufacturing costs for hard drives (connectors/platters), WDC has massive pricing power right now because demand for storage exceeds supply. They pass those costs on. This isn't a bug; it's a feature.
🎯 THE VERDICT:
Trend is King We are seeing a convergence of Technical Strength (Channel Breakout) + Fundamental Growth (Earnings Beats).
Bull Case: A clean break of $188 opens the door to $200+. The trend remains your friend as long as we stay inside the Blue Channel.
Bear Risk: If we fail here, watch for a rotation back to the "Channel Median" line.
👇 Discussion:
Do you see WDC as a "Hardware Play" or an "AI Infrastructure Play"? Let me know below.

NEAR - spot, long term.BINANCE:NEARUSDT.P
Throughout 2025, the coin remained within its range.
I consider exiting the range a deviation, and we will get the same deviation on the other side of the range.
Good luck with your trading! Use your risk management strategy.
The ideal entry point will be: $1.4 and $1.25.
The targets on the chart are a minimum of $3.2.

DXY SHORTDXY has shifted character. It is approaching HTF supply and we can have sell trade from there.

DOT: locally long ideaThe dot looks long, both locally and structurally. We need to eliminate the accumulated long-term liquidity, and then we can take off. That's the idea! It's not a setup. If we create this model, we're in. If we fail, we'll just skip it!
BINANCE:DOTUSDT.P

BITCOIN BULLS WILL DOMINATE THE MARKET|LONG
BITCOIN SIGNAL
Trade Direction: long
Entry Level: 87,599.76
Target Level: 90,106.43
Stop Loss: 85,916.50
RISK PROFILE
Risk level: medium
Suggested risk: 1%
Timeframe: 1h
Disclosure: I am part of Trade Nation's Influencer program and receive a monthly fee for using their TradingView charts in my analysis.
✅LIKE AND COMMENT MY IDEAS✅


Nividia get tiredTried to break this long channel but looks like it’s getting tired , also a little H&S forming. As soon it’s break the red line, short will be placed.

Is NFLX a good Buy ?Why Netflix Could Rise From Here:
1. Growth Is Still Strong
Netflix remains a dominant force in global streaming, with broad international reach, strong revenue growth, and major content hits that continue to draw subscribers and engagement. Even as the stock has fallen, the company still delivered very strong revenue and earnings performance and has diversified into interactive and live content that could push monetization higher.
2. Warner Bros Acquisition Could Create a Massive Content Moat:
Netflix’s proposed acquisition of Warner Bros. Discovery’s studio and streaming assets would be one of the biggest media consolidations ever. The deal, if approved, would bring iconic franchises (DC Universe, HBO shows, etc.) onto Netflix’s platform and greatly expand its content library and production capabilities. That could translate into stronger subscriber retention, more premium content, and long-term growth.
3. Strategic Shift Into Broader Entertainment Beyond Streaming:
By acquiring Warner Bros., Netflix would extend into movies, TV production, distribution rights, and intellectual property monetization (games, merchandise, licensing). In theory, this diversification could boost long-term earnings and justify a higher valuation multiple if investors believe Netflix is no longer just a streaming platform but a full-stack entertainment powerhouse.
4. Valuation Could Look Attractive After the Sell-Off:
A significant drop in the share price can sometimes reset expectations and make the stock more compelling to long-term investors, especially if the core business (subscriber growth, ARPU, margins) remains solid or improves. Some analysts already see the valuation as more reasonable, with the risk/reward tilting back in favor of buyers rather than sellers.
Why Netflix Could Still Fall Further:
1.Regulatory & Antitrust Scrutiny Around the Warner Deal:
A key reason NFLX shares have been under pressure is regulatory risk, U.S. lawmakers, antitrust authorities, and even the President have publicly questioned the Netflix-Warner Bros. deal as potentially creating too much market power in streaming. This kind of scrutiny can delay or block the deal entirely, and uncertainty alone can keep selling pressure on the stock.
2. Competition From Paramount and Others:
Paramount Skydance isn’t just sitting on the sidelines, it’s mounted a hostile bid for Warner Bros., pushing a higher cash offer and arguing its combination would face fewer regulatory hurdles. This bidding war introduces further uncertainty for Netflix and may inflate costs and integration risk, which can hurt investor confidence.
3. Market Fears Around Monopoly and Content Control:
Critics argue that combining Netflix’s global subscriber base with Warner Bros.’ huge content library could stifle competition in the streaming market, leading to fewer choices and higher prices for consumers. If regulators take this view seriously, possibly even forcing concessions or blocking the deal altogether, the expected synergies could evaporate, weighing heavily on NFLX’s stock.
4. Broader Streaming Competition and Saturation:
Even without the Warner deal, Netflix faces tough competition from Disney+, Amazon Prime Video, Apple TV+, YouTube, and others for viewers’ time and advertising revenue. If subscriber growth slows or churn increases, future revenue growth could disappoint investors, a key reason sentiment has soured.
5. Execution Risk Around Integration and Costs:
Large acquisitions bring integration risk, execution complexity, and debt or dilution concerns. If Netflix overpays, struggles to integrate Warner Bros. content strategy, or fails to expand profits from the combined entity, investors could punish the stock further, epecially if near-term guidance weakens.
Disclaimer:
This analysis is for informational and educational purposes only and does not constitute financial advice, investment recommendation, or an offer to buy or sell any securities. Stock prices, valuations, and performance metrics are subject to change and may be outdated. Always conduct your own due diligence and consult with a licensed financial advisor before making investment decisions. The information presented may contain inaccuracies and should not be solely relied upon for financial decisions. I am not personally liable for your own losses; this is not financial advice.

XRPUSDT – Trade ideaXRP has printed a market structure shift (MSS) and is consolidating above key support.
Price is currently pulling back into a local demand zone after a rejection from range highs.
Bias
As long as price holds above demand, a bounce and continuation higher remains likely.
This area offers a clean high RR long opportunity if buyers step in.
Invalidation
Acceptance below demand invalidates the bullish setup.
Let price do the work.

MON READY FOR COMEBACK🔥 Fortune AI Radar — TSXV:MON
Fresh activity detected on TSXV:MON today.
Data suggests increasing market interest & buyers stepping in.
Technicals currently lean bullish, with momentum trending upward.
Whales showing hints of accumulation and hype rising among traders.

CHILLGUY WAKING UP🔥 Fortune AI Radar — CRYPTOCAP:CHILLGUY
Fresh activity detected on CRYPTOCAP:CHILLGUY today.
Data suggests increasing market interest & buyers stepping in.
Technicals currently lean bullish, with momentum trending upward.
Whales showing hints of accumulation and hype rising among traders.

If the breakout holds, we fly!HOSE:CRV just broke the downtrend.
This is how big moves usually start. 👀
If the breakout holds, we fly. 🚀
