BTC Major Buy. If we dont hold 82k, its going to 44k.Huge yearly level to hold. I am betting on a insane pump off this level. Keep an eye out for it.
Trend Analysis

ETHUSDT.P - November 20, 2025ETHUSD is displaying a series of lower highs beneath a well-defined descending trendline, showing persistent bearish momentum and a clear downtrend. Price repeatedly failed to break resistance around 3,100, leading to sharp declines back toward support near 2,900. Recent price action shows a corrective rally met strong resistance as momentum faded. Overall, the trend remains bearish unless price can decisively breach the descending resistance line and establish higher highs.

XRP HOLIDAY SALE!The overall crypto market has been sliding off recent highs since late September. This was after crypto markets created gap structures on the October 10th sell off. The gap left on XRP was priced in near $1.99-$1.98. We have just reached this liquidity zone. I expect fear to boost and bears to be trapped as the crypto season approaches the holidays, this should be an early Black Friday sale to new highs toward $4 and higher.
Happy Thanksgiving and Early Christmas
-This is not financial advice, R2C.

TradeCityPro | Bitcoin Daily Analysis #225👋 Welcome to TradeCity Pro!
Let’s jump into today’s Bitcoin analysis. After the pullback to 93,555, Bitcoin has moved into a ranging phase.
⌛️ 1-Hour Timeframe
Yesterday, after reaching its support zone, Bitcoin made a corrective upward move and pulled back to 93,555.
💡 Right now, after completing that pullback, the price has dropped back down to 90,489 and has shown a reaction to this level.
✔️ As you can see, selling volume has been increasing during this move, and we haven’t seen any significant buying volume enter the market yet.
✨ Today’s trigger for opening a position is the break of 90,489.This is a suitable trigger for a short position, and breaking it could be the start of the next bearish leg.
⭐ If the move toward 90,489 comes with increasing volume, we can even enter earlier using a candle setup, before the full break happens.
📊 For a long position, it’s still too early.We first need to see the price stabilize above 93,555, and only then we can look for long triggers.
❌ Disclaimer ❌
Trading futures is highly risky and dangerous. If you're not an expert, these triggers may not be suitable for you. You should first learn risk and capital management. You can also use the educational content from this channel.
Finally, these triggers reflect my personal opinions on price action, and the market may move completely against this analysis. So, do your own research before opening any position.

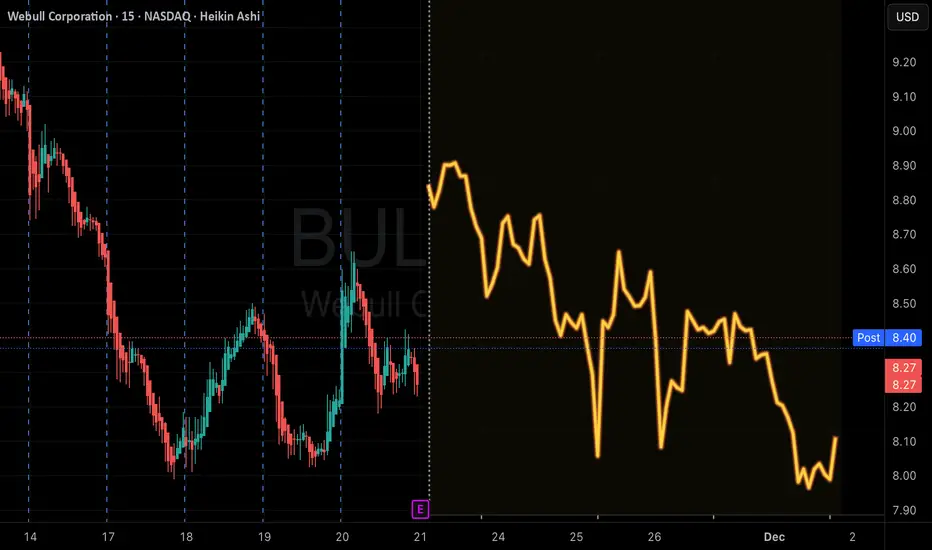
QuantSignals V3 High-Probability SetupBULL QuantSignals V3 Earnings — Simple & Clear Breakdown (2025-11-20)
Direction: BUY PUTS
Confidence: 60% (Low–Moderate)
Expiry: 2025-11-21
Strike: $8.50
Entry: ~$0.56
Target 1: $0.85
Stop Loss: $0.35
📉 Why PUTS Instead of CALLS?
Although the Earnings Model initially flagged BUY CALLS, Katy AI’s full intraday prediction overrides it:
Katy AI shows a bearish trend with a target of $8.14 (-2.63%)
78 data points → 71% show downward pressure
Predicts intraday lows around $8.03 (-3.86%) on expiry day
This makes PUTS the higher-edge setup.
📊 Key Analysis (Simplified)
Technical
Current Price: $8.36
RSI: 21.4 (oversold but still weak)
MACD, ROC, and EMAs → bearish
Resistance: $8.48
Support: $8.00
News / Fundamentals
EPS estimate: $0.03
Revenue: +140% YoY
Crypto trading relaunch could help later — but not enough to offset short-term weakness
Flow
PCR: 0.60 (normally bullish)
BUT heavy put flow spotted at $35 strike → indicates institutional hedging
IV extremely high at 271% → expect volatility
⚡ Trade Setup (Simple Version)
PUTS — $8.50 Strike — Exp 11/21
Entry: $0.54–$0.58
PT1: $0.85
PT2: $1.10
Stop: $0.35
Position Size: 2% (Low conviction)
⚠️ Risk Notes
Confidence only 60%
Oversold levels can bounce
Volume is only 0.3× average
Earnings = high volatility → manage size tightly
📌 Compliance
Educational analysis for QS Premium members only.
Not financial advice.
Opportunities for market growth at the end of the yearToday we have reached a new major bifurcation point in the middle of the quarter, which I have focused on. For individual coins, starting in the middle of this week, the probability of a bullish quarterly candle reversal with large growth waves will increase, similar to RESOLV and TNSR. Such reversals will be facilitated by a slowdown in the fall of ETH with attempts to change the trend before the end of the year.
So far, the bearish influence has prevailed in the market, with the opening of most major periods below key resistances and stable sales until the middle of the quarter to consolidate below 3,500, which I will indicate in the latest review. The ultimate goal of the bears in this quarter is to test the range of 2500-2750, with an attempt to close the annual candle in it under a negative scenario, and against the background of consolidation below 3500, this goal is still relevant. By the end of the month, we may still see new sales impulses to break through 2750, but with increasing buying activity at the end of each week, against which individual coins will try to grow. The second half of the quarter for ETH opened below 3,250, which gives a signal for sales below 3,000 up to 2,500, but an opening above 3,100 is a technical signal for growth up to 3,500-4,100. The attempt to reverse the quarterly candle is also facilitated by its opening above 4,100.
And so, under an optimistic scenario and a stable transition to a reversal of the quarterly candle in the second half of the week, purchases can be expected until the end of the week, with the aim of opening a new week above 3250, which will ensure continued growth until the end of the month and the possibility of opening a new month with a growth signal before the end of the year. With less volatility, there is a chance of opening a new week below 3,100, which could lead to a reversal next week.
As I wrote in a review at the beginning of October, BTC opened the quarter negatively, with a pullback signal down to 90-100 k, which the bears successfully worked out. There is a large medium-term support in the 85-90k zone, from which a pullback is likely. In addition to the growth of the altcoin index and the growth of ETH/BTC, which I expect at the turn of the quarter, the slowdown in the decline of BTC will also cease to put pressure on the market and allow individual coins to show major reversals.
Brent may once again have quite a big impact on the markets. If today and tomorrow the price fixes above $ 64 and, moreover, above $ 65, then the probability of growth of the crypt will prevail until the close of the week. In the event of US manipulation and a sudden new wave of brent sales below $62.5 today or tomorrow, there will be a chance for an ETH reversal before the weekend. Given the released data on stocks in the United States, the probability of a positive scenario prevails. All markets are connected, and no matter how absurd it may seem at first glance, it was the background manipulation of the commodity price that allowed the bears to break through key supports on ETH more than once, both on October 10 at 4,100, and at the subsequent 3,500, 3,250 and 3,100. By superimposing the dynamics of brent in the second half of the week on the dynamics of ETH by the weekend, you can see a chain reaction. That is why by the second half of October, I predicted a drop down to 3,500 by the end of the week, in the event of a drawdown of brent to $ 60.
Against the background of a slowdown in the fall of ETH and attempts to reverse the quarter, it is possible to make regular toppings for individual coins. First of all, it is worth paying attention to TURTLE and MITO, which have strong technical signals for growth up to 0.21-25 in the medium term. So the potential is the ground for dynamics similar to RESOLV. VIC BMT HOOK CHESS also has slightly weaker technical signals for growth, which I am also considering working with in the first place. On an attempt to reverse the quarter, there is a high probability of their growth to 50-70%, at least with the aim of breaking the last monthly candle. In the case of a stable ETH reversal, growth impulses of up to 200%+ can be expected.
Similarly, growth waves of up to 40-50% may show weaker instruments that do not have obvious signals, but are in an extremely oversold zone, such as QUICK COS FIO DATA. In my opinion, these tools are candidates for the assignment of the monitoring tag, given the dynamics, and therefore I recommend using a small position when working with them.
In addition to the positive note towards the end of the year that has appeared at the moment, I would like to focus on the overall negative dynamics of the market, which may continue at the beginning of the year. The current likely pullback on the quarterly and annual candles is still a temporary phenomenon and gives opportunities to coins that have technical growth signals left earlier. Most of the market, after attempts to roll back the tops at the turn of the year, is likely to continue falling until the second quarter. That is, coins without obvious growth signals, especially those with large capitalization, may remain flat until January or February without significant purchases followed by a major break.

DeGRAM | EURUSD is preparing to fall below $1.15📊 Technical Analysis
● EUR/USD continues to reject the long-term descending resistance line, with the latest swing high failing near 1.1650 and confirming bearish structure.
● Price is forming lower highs and is now retesting 1.1530 from below. A breakdown toward 1.1474 and 1.1407 is likely if the pair stays under resistance.
💡 Fundamental Analysis
● USD strengthens as markets price in fewer Fed cuts after resilient U.S. data, pressuring the euro.
✨ Summary
Resistance: 1.1530–1.1576. Downside targets: 1.1474 → 1.1407. Short-term bearish bias below trendline.
-------------------
Share your opinion in the comments and support the idea with a like. Thanks for your support!

XAU/USD – Inverse H&S Forming, Gold Eyes Bullish Reversal🔍 Market Context
Early today, Gold dropped nearly 70 points, but immediately rebounded strongly from 4040, signaling aggressive BUY interest and a clear rejection of downside continuation.
On the H2 chart, XAU/USD is shaping a clean Inverse Head & Shoulders pattern — a classic reversal structure that often precedes a strong bullish expansion.
The macro layer for today is packed with high-impact catalysts:
📌 Key Data & Events – 20 Nov
Speech by U.S. President Donald Trump
Barkin (2027 FOMC voter) speaks on economic outlook
Federal Reserve FOMC Meeting Minutes
Williams (permanent FOMC voter) speech
U.S. Unemployment Rate
Non-Farm Payrolls (NFP)
Initial Jobless Claims
➡️ A heavy news lineup capable of triggering high volatility and validating (or rejecting) the reversal pattern.
📊 Technical Analysis – MMF View
Gold bounced sharply from BUY ZONE 4044–4046 with strong volume.
The market structure is creating a complete Inverse H&S formation.
The Neckline Zone 4101–4111 is the key breakout level — clearing this zone opens the door for a full bullish reversal.
Trendline compression + liquidity sweeps show buyers gaining control.
Strategy for today: BUY bias. SELL only for quick scalps.
🎯 MMF Daily Trading Plan
BUY (Priority Setup – Swing / Intraday)
Buy 4046–4048
SL: 4039
TP: 4060 → 4085 → 4100 → 4125
✔️ BUY aligns with the reversal pattern + fresh liquidity shift.
SELL (Scalping Only)
Sell 4146–4148
SL: 4154
TP: 4132 → 4120 → 4110
✔️ SELL only if price taps liquidity at upper supply and rejects clearly.
⚠️ Key Levels to Watch
4101 – 4111 – 4142 → liquidity clusters + breakout confirmation
4029 → major support in case volatility spikes from news
🧠 MMFLOW TRADING Outlook
If Gold holds its corrective pullback and breaks above the Neckline (4101–4111), we may see a strong continuation toward:
4146 → 4187 → 4210+
The Inverse H&S on H2 is a powerful bullish setup — smart positioning favors building long exposure and holding into high-impact events.

OLD (XAUUSD) – Bearish Correction Setupimeframe: 15M
Market Structure:
Price has broken below the trendline and is now retesting previous demand turned supply. Structure shifting bearish with liquidity targets below
Key Levels
Supply Zone (Short Trigger): 4062–4069
Invalidation/SL: Above 4077
First Target: 4030
Final Target: 4002–4008 liquidity zone
Trade Idea – Short Setup
Price is expected to pull back into the yellow mitigation zone, then reject and continue the downside move.
Entry:
🔻 Sell @ 4062–4069 (Mitigation Zone)
SL: 4077
TP1: 4030
TP2: 4008
TP3: 4002 (Full Target)
Bias:
📉 Bearish until price closes back above 4077
Structure favors downside after liquidity sweep + trendline break + supply retest.
Notes:
This idea is based on liquidity grab + BOS + retest.
Wait for bearish confirmation inside the zone for safer execution.
This is not a financial advice

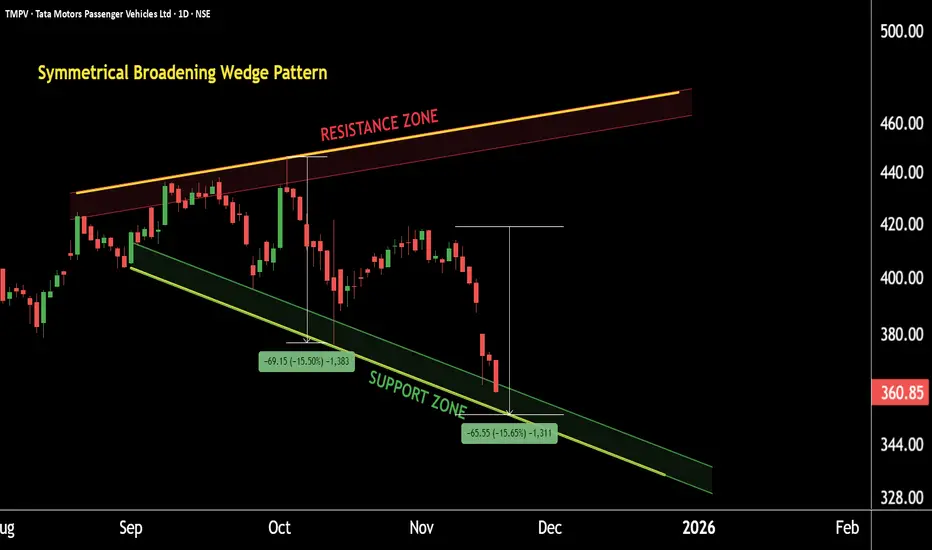
Tata Motors PV: A Big Pattern is Taking ShapeThis is the daily timeframe chart of TMPV.
TMPV is forming a Symmetrical Broadening Wedge Pattern with a key support zone near the 345–350 range.
The stock is also developing an AB=CD harmonic pattern within the broader structure, and the CD leg is completing near the same 350 support zone.
If the price continues to sustain above this support region, we may see higher levels like 400 and pattern price in TMPV in the coming sessions.
Thank you.
Bullish reversal for the Aussie?The price has bounced off the pivot, which is a pullback support, and could rise to the 1st resistance, which has been identified as an overlap resistance.
Pivot: 0.6468
1st Support: 0.6444
1st Resistance: 0.6512
Disclaimer:
The opinions given above constitute general market commentary and do not constitute the opinion or advice of IC Markets or any form of personal or investment advice.
Any opinions, news, research, analyses, prices, other information, or links to third-party sites contained on this website are provided on an "as-is" basis, are intended to be informative only, and are not advice, a recommendation, research, a record of our trading prices, an offer of, or solicitation for, a transaction in any financial instrument and thus should not be treated as such. The information provided does not involve any specific investment objectives, financial situation, or needs of any specific person who may receive it. Please be aware that past performance is not a reliable indicator of future performance and/or results. Past performance or forward-looking scenarios based upon the reasonable beliefs of the third-party provider are not a guarantee of future performance. Actual results may differ materially from those anticipated in forward-looking or past performance statements. IC Markets makes no representation or warranty and assumes no liability as to the accuracy or completeness of the information provided, nor any loss arising from any investment based on a recommendation, forecast, or any information supplied by any third party.

Eurusd 15m shortBearish on eu. Potential fractal abc. We should be on a larger down wave now. Good luck.

NVDA LongBroader Market Structure
NVDA has been in a short-term bullish corrective structure after forming a BOS at $179.91, which marked the end of the prior bearish leg. Since that break, price has been forming higher lows and higher highs on the intraday structure. However, the most recent swing into the $194–$195 supply produced a sharp rejection, showing that the bullish structure is still counter-trend relative to the larger bearish swing from the $202–$205 highs. No new CHoCH has printed yet, but the aggressive selloff from $195 signals a potential short-term shift in control back toward sellers unless demand holds.
Supply & Demand Zones
The upper supply zone at $194–$195 remains strong; price dropped sharply from this level with long-bodied bearish candles, showing active institutional selling and low willingness from buyers to absorb orders. The deeper supply above, between $199–$202, is an even stronger zone because it originated the major downside impulse that broke structure.
On the buy side, the demand at $185–$183 previously showed clear strength—buyers stepped in aggressively and pushed price upward with momentum—which tells us the zone still carries validity. The lower demand between $181–$178 is even more important, as it’s the origin of the BOS at $179.91 and represents the last confirmed defensive line for bulls.
Price Action Within the Marked Region
Price is currently falling from the $195 rejection and heading toward the $185–$183 demand you marked. Candles show increasing wick size on the way down, suggesting early signs of selling exhaustion but not yet a reversal. As price enters this demand, we should see either absorption or continuation. If buyers defend the zone as they did previously, a corrective bounce toward $192–$194 is likely. If demand fails, price will unwind quickly into the deeper $181–$178 liquidity pocket.
Expectation, Bias & Invalidation
Trade bias: short-term bullish, expecting price to dip into demand and bounce into the lower supply.
Expected direction: a pullback into $185–$183, followed by a rally into $192–$194.
Invalidation: a clean close below $183, which would signal sellers have regained full control and shift the outlook to bearish continuation toward $181–$178.
Momentum & Candle Behavior
Momentum currently favors sellers, given the fast drop from supply, but the decline is becoming more controlled—suggesting momentum is fading as price approaches demand. No confirming reversal candles have appeared yet; we will need to see a long-wick rejection, engulfing candle, or clear absorption footprint at demand to confirm the bounce scenario.

Toncoin (TON): Last Chance | Now or NeverTON is dropping into a key support area, and this is the zone where we finally want to see buyers step in. No confirmation yet, but the reaction around this zone will decide the next move.
If buyers manage to hold this level and give us a clean BOS, then the buy area becomes valid and we look for continuation back toward the upper targets. Until then, patience — let the structure confirm first.
Swallow Academy

DeGRAM | SOLUSD held the $130 support level📊 Technical Analysis
● SOL/USD has created a false break below the dynamic support line while defending the 135–145 demand zone, signaling seller exhaustion.
● Price is stabilizing inside a descending channel; a rebound toward 160 is likely if buyers push above the short-term triangle breakout area.
💡 Fundamental Analysis
● Solana sentiment improves as ecosystem inflows rise and on-chain activity stabilizes, supporting recovery potential.
✨ Summary
Support: 135–145. Targets: 155 → 160. Medium-term bullish bias above demand zone.
-------------------
Share your opinion in the comments and support the idea with a like. Thanks for your support!

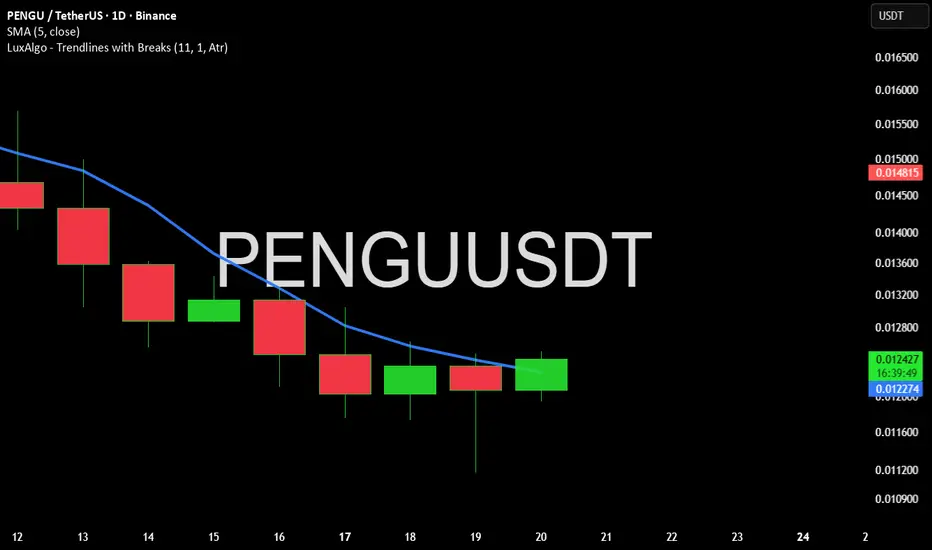
PENGU 0.012 i see bottom guys and i aped ina meme coin that was so popular among rich kids
perhaps i want to buy and brag it when it goes back to rick kids high price
ETHEREUM(ETH/USD): Consolidation – The Silence of VolatilityEven though ⚠️ETHEREUM is trading in a bearish trend since October, 📉
The pair has been in a deep consolidation, since the last 3 days 🗓️
The price is currently testing a strong horizontal support level where the price is consolidating. ↔️
Because the trend is strongly bearish, chances will be high to see
a further bearish continuation. 🐻
Your reliable confirmation will be a breakout and a 4H candle close below the underlined support. 🕯️
The next goal for the sellers will be 2840 🎯
Alternatively, the market may continue consolidating and trading within the range. 🔄

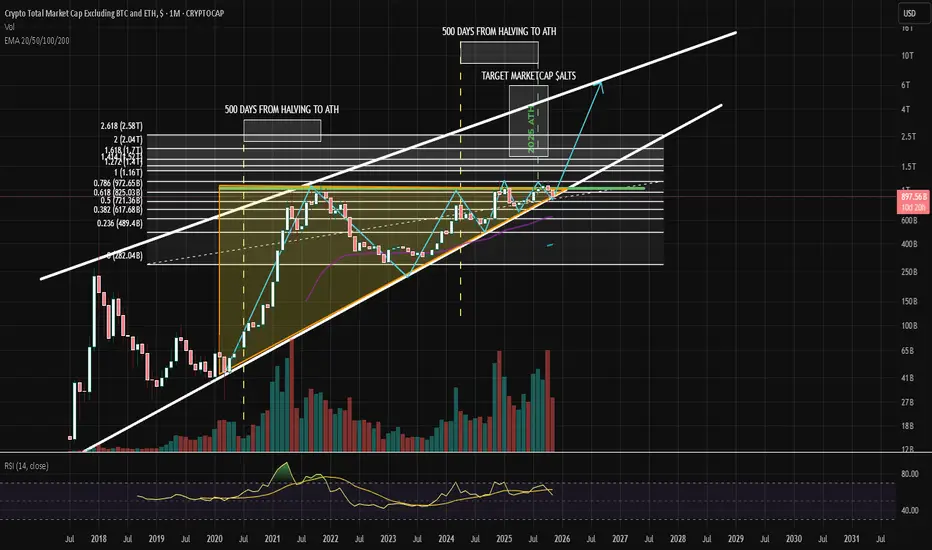
Potential Ascending Triangle - ALTCOINS Appears to be an ascending triangle forming on the weekly time frame. Is a breakout possible for Altcoins?
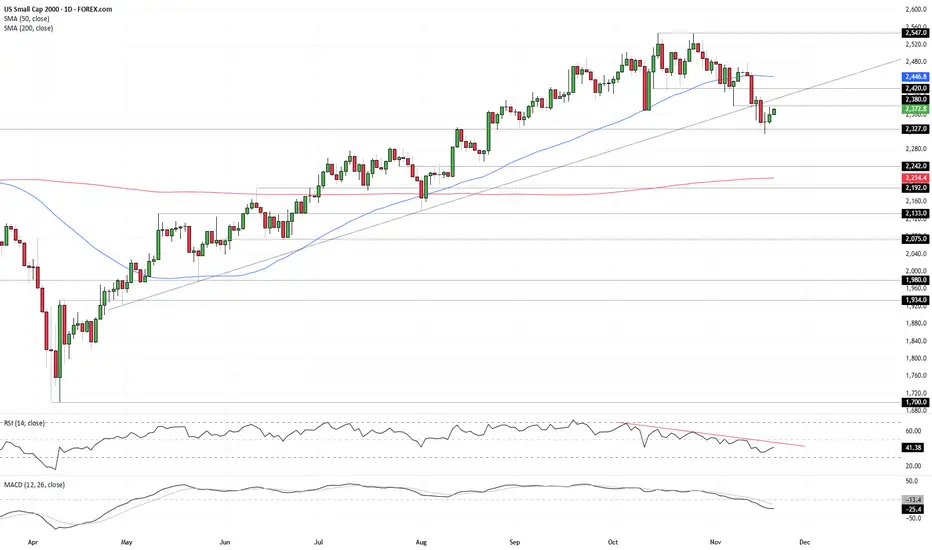
Momentum Weak Despite Nvidia BoostShould small-cap U.S. equities be rallying because AI giant Nvidia just delivered another blowout earnings update? Sure, risk sentiment has improved, and continued AI investment comes with some immediate broader economic benefits, but the move still comes across as a little suspect, especially with the prospect of near-term Fed rate cuts dwindling by the day. While the price signals for our small-cap contract are pointing to upside risks, momentum indicators are not confirming, suggesting selling into strength may be the way to play it, especially if we see a reversal pattern.
Looking at the daily chart, we see a clear morning star bullish reversal pattern printed this week, with follow-through buying after the Nvidia results. However, as was the case in the prior session, the price has been unable to take out 2380 so far, marking the low struck on November 7. It’s only a minor level, but it has seen price action on either side of it this month, making it relevant when assessing setups.
Despite the bullish price signal, RSI (14) and MACD remain firmly bearish. RSI continues to trend lower beneath 50, indicating downside pressure remains even if it’s weakened a touch in recent days. MACD also sits in negative territory, having already crossed the signal line from above in late October. It too is showing signs of turning, but for now the combined message remains one where selling into strength may be the better way to play it.
Should the price be unable to breach and hold above 2380, shorts could be considered beneath the level with a stop above for protection, targeting 2327 support initially. Should that and Tuesday’s low give way, 2275 or 2242 screen as other downside targets.
Of course, if the price can push above and hold 2380, longs could also be considered, allowing for a stop to be placed beneath to protect against reversal. Such a move may see momentum indicators tilt neutral rather than bearish. If that were to occur, the merits of long trades would be improved. 2400, where the price was capped prior to the latest leg lower, looks as an appropriate initial target, with the 50DMA the next after that.
Good luck!
DS
XAUUSD: Light Downtrend, Targeting Lower LevelsGold prices declined during the Asian trading session on Tuesday, continuing the recent downtrend. The weakening confidence in the Federal Reserve's potential rate cut in December has provided strong support for the US dollar , putting pressure on gold and other non-yielding assets. Furthermore, the caution ahead of the delayed September non-farm payroll report, expected to be released this week, is also benefiting the US dollar and driving gold prices lower.
On the chart, we can see that gold is currently moving within a mild downtrend, with a price structure forming a “cup and handle” pattern, setting up for a possible pullback. The resistance level at 4,120,000 USD is quite strong, and if the price fails to break this level, gold is likely to continue its decline toward the next support levels around 4,080,000 USD and 4,000,000 USD.
In particular, the support zone near 4,000,000 USD is a key area to watch, where prices may bounce if selling pressure is not too strong. However, given the current downtrend, the potential for further declines below 4,000,000 USD is highly probable.
Trade Strategy Recommendations:
Sell: If gold fails to break the resistance at 4,120,000 USD and continues to decline, consider opening a sell position with targets near 4,080,000 USD and 4,000,000 USD.
Buy Against the Trend: Consider short-term buy orders if gold rebounds from the 4,000,000 USD support zone, but only trade with low risk and within a short time frame.
Be sure to closely monitor the important resistance and support levels , particularly around 4,080,000 USD and 4,000,000 USD, to make accurate trading decisions.

IM BUYING THE DIP ON BITCOINIM BUYING THIS DIP ON #BITCOIN 📈
Following my plan, level by level!
Later Shorter are gonna be REKT in my opinion! 🔴
That 0.786 fib level daily, will likely act as bottom for tonight! 📈
#BTC price is also on key dem support + highly oversell (H1) & ichimoku.
I wont be surprise to see a bull trap & fake test of the previous levels.
89,000 - 90,000$ next 📈🎯 , Then dump toward 84k- ?
A retest of the 100k previous key support before to see another crash could also be a possibility!? 👀

NVDA: The Bubble Beneath the Brilliance A deep dive into Nvidia’s AI-fueled rally — and the cracks forming under the surface.
🐺 Hello Traders 🐺
Nvidia’s been the poster child of the AI revolution — no doubt about it.
But every time a narrative gets “too perfect,” I hit pause… and zoom out.
Because NVDA’s been here before.
And every time, the chart whispered the truth long before the headlines caught up.
So let’s ask the real question:
Not “Is Nvidia a great company?” — we already know it is.
But rather:
“Are we pricing in a future that might not arrive fast enough?”
That’s where things get interesting.
🔹 The Hidden Cost of the AI Boom
AI is revolutionary — but it’s also a cash furnace.
Training, inference, datacenters, energy, hardware… it all comes with a brutal price tag.
And if returns don’t scale fast enough, guess where the market cuts first?
Hardware.
Which puts NVDA right at the heart of the risk zone.
Great company ≠ infinite valuation.
🔹 NVDA’s History of Hype & Hangovers
Let’s zoom out and look at the cycles:
1️⃣ Dot-Com Era (2000–2002)
Nvidia rode the internet wave hard.
Then the bubble popped — and NVDA got crushed.
Narrative > fundamentals… until reality showed up.
2️⃣ 2006–2007 GPU Mania
Gaming hype sent NVDA vertical.
Then came 2008 — and wiped the slate clean.
3️⃣ 2015–2018: Growth Meets Hype
This one was different.
Real growth + real hype.
Drivers included:
- 4K gaming and esports explosion
- AI research adoption
- Tesla’s self-driving push
- Crypto mining boom
- Datacenter demand
- Explosive revenue and margin growth
Outcome? A solid run with a mini-bubble at the tail end — which corrected during the crypto winter.
4️⃣ 2018 Crypto Crash
Mining demand collapsed.
NVDA dropped over 50%.
5️⃣ 2023–2024 AI Supercycle
The biggest rally in NVDA’s history.
Parabolic. Vertical. Narrative-fueled.
But here’s the thing:
Every vertical move in history cools off when expectations outrun execution.
🔹 Why This Cycle Feels Fragile
This isn’t just hype — it’s built on massive capex from Big Tech.
But capex isn’t infinite.
And the ROI of AI? Still foggy.
Here’s what’s brewing beneath the surface:
- Monetization is early
- Margins could shrink
- Custom chips are rising
- Spending could slow
And when it does, NVDA feels it first.
That’s why calling this an “unstoppable cycle” is dangerous.
🔹 My Technical View
I treat parabolic charts with caution — always.
- Strong trend ≠ invincible
- Steeper slope = weaker base
- Euphoria = warning sign
- Breaks are rarely gentle
NVDA still looks bullish long-term…
But no parabolic trend lasts forever.
I’m watching:
The price is currently reacting very well to the parabolic curves. Every time it hits the top, a downtrend begins, and the price crashes hard before retesting the support curve!
If AI spending slows even a little, NVDA will be the first domino.
🔹 Final Takeaways
Nvidia isn’t in trouble.
It’s one of the strongest tech players on the planet.
But history doesn’t care about greatness — it cares about gravity.
And every time NVDA flew too close to the sun, it came back down hard.
This cycle checks all the bubble boxes:
- Parabolic price
- Euphoric narrative
- Crowded positioning
- Sky-high expectations
- Capex dependence
As long as the slope holds, momentum traders run the show.
But when it breaks… it breaks fast.
That’s the bubble beneath the brilliance.
🎯 Why This Post Matters
Because most traders only see the surface.
They chase hype.
They follow headlines.
But they ignore the deeper forces — the ones that actually move the chart.
This post is a reminder:
Stay sharp.
Stay skeptical.
And never treat any narrative — even AI — as invincible.
🐺 Discipline is rarely enjoyable, but almost always profitable 🐺
🐺 KIU_COIN 🐺
