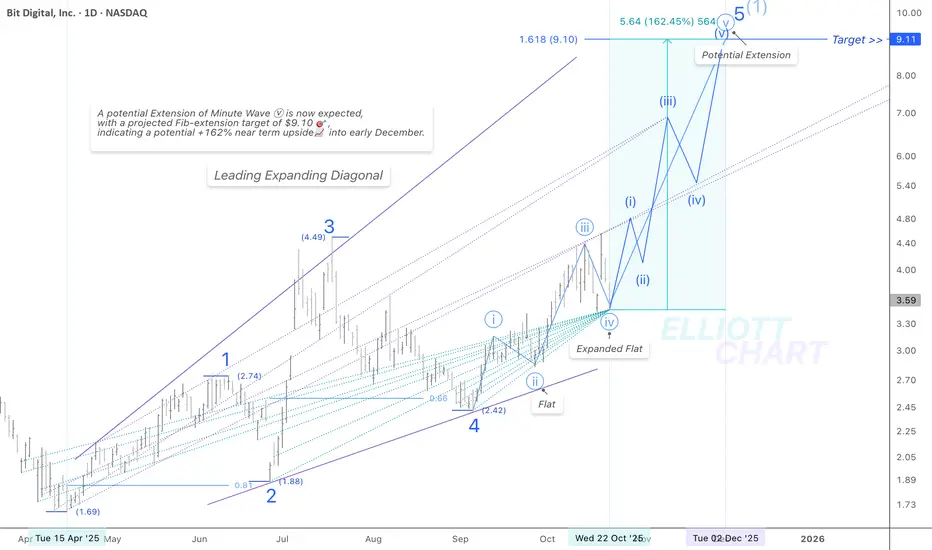
BTBT / DailyNASDAQ:BTBT — 📊 Technical Update (Daily)
As outlined in prior updates, the first corrective move within the ongoing advance of Minute Wave ⓥ found its support right at the apex of the equivalence lines✨— a key structural point within the Leading Diagonal of Intermediate Wave (1).
This reaction continues to support the case for a potential extension in Wave ⓥ of Minor Wave 5, suggesting the uptrend remains intact — with differing degrees of bullish structures still in play.
Breakout confirmation keeps the adjusted $9.10🎯 Fib target in play — +162%📈 upside potential into early December.
Wave Analysis: Based on the Bullish Alt. Scenario (Weekly Frame)
The entire advance since mid-April appears to be unfolding as Intermediate Wave (1) — potentially forming a Leading Expanding Diagonal, shaped like a happy shark!! 🌊🦈🌊🌊
This early structure may be laying the groundwork for much larger impulsive Intermediate advance within Primary Wave ⓷ (not visible on the daily timeframe).
The expanding diagonal signals a broader bullish shift, potentially anchoring a sustained long-term uptrend. Long-term structure continues to build — monitor closely for breakout confirmation and volume support.
🔖 For context, refer to the Weekly Bullish Alt. Scenario published on Oct. 1st.
#TradingView #StocksToWatch #MarketAnalysis #TechnicalAnalysis #ElliottWave #WaveAnalysis #TrendAnalysis #FibLevels #FinTwit #Investing #BTBT
#DataCenters #CryptoMining #AIStocks #HPC #ETH #Ethereum NASDAQ:BTBT CRYPTOCAP:ETH BITSTAMP:ETHUSD NYSE:AI
Trend Analysis
Nifty 50 - Strong Reversal zone - 26200-26850 Nifty 50- Strong Reversal zone - 26200- 26850- watch this zone for profit booking minimum book 80% and hold 20% SL to cost.
Weekly supply zone
Bearish Bat pattern

Voltas Ltd – Steady Recovery Setup After Multiple ShakeoutsVoltas Ltd – Steady Recovery Setup After Multiple Shakeouts
NSE:VOLTAS
📈 Pattern & Setup:
Voltas has been building a strong base for several months after a prolonged downtrend. The stock faced multiple shakeouts below 1400 levels, but each dip was followed by quick recoveries — a classic sign of accumulation.
The price has now reclaimed all key moving averages and is trading above the 200-day EMA for the first time in months. This transition from distribution to accumulation is being confirmed by steady volume expansion and higher pivot lows.
A breakout above 1465–1475 could trigger a sustained move toward 1800+.
📝 Trade Plan:
✍Entry: Above 1475 (breakout confirmation)
🚩Stop-Loss: 1400 (below recent pivot low)
🎯Targets:
Target 1 → 1630
Target 2 → 1835 (27% potential move)
💡 Pyramiding Strategy:
1. Enter with 60% position above 1475
2. Add remaining 40% above 1500 once volume confirms breakout
3. Trail stop-loss to 1430 once price sustains above 1580
Keep Learning. Keep Earning.
Let’s grow together 📚🎯
🔴Disclaimer:
This analysis is for educational purposes only. Not a buy/sell recommendation. Please do your own research or consult your financial advisor before trading.

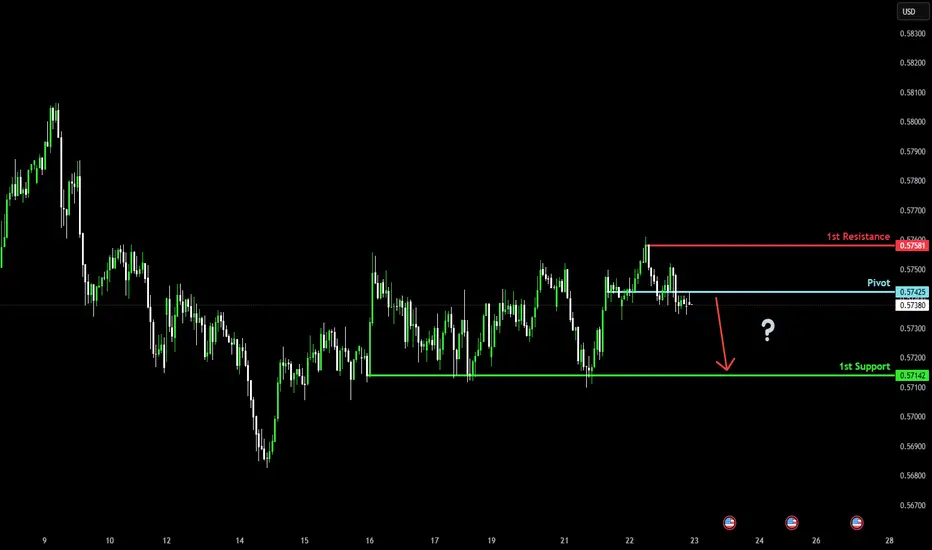
Bearish reversal?The kiwi (NZD/USD) is reacting off the pivot which is a pullback resistance, and could drop to the 1st support which is a multi-swing low support.
Pivot: 0.5742
1st Support: 0.5714
1st Resistance: 0.5758
Disclaimer:
The above opinions given constitute general market commentary, and do not constitute the opinion or advice of IC Markets or any form of personal or investment advice.
Any opinions, news, research, analyses, prices, other information, or links to third-party sites contained on this website are provided on an "as-is" basis, are intended only to be informative, is not an advice nor a recommendation, nor research, or a record of our trading prices, or an offer of, or solicitation for a transaction in any financial instrument and thus should not be treated as such. The information provided does not involve any specific investment objectives, financial situation and needs of any specific person who may receive it. Please be aware, that past performance is not a reliable indicator of future performance and/or results. Past Performance or Forward-looking scenarios based upon the reasonable beliefs of the third-party provider are not a guarantee of future performance. Actual results may differ materially from those anticipated in forward-looking or past performance statements. IC Markets makes no representation or warranty and assumes no liability as to the accuracy or completeness of the information provided, nor any loss arising from any investment based on a recommendation, forecast or any information supplied by any third-party.
Precious metals are not dead - Long at 5.13Despite what market headlines would have me believe, I am still a strong believer in precious metals here. De-dollaring by foreign countries, or at least hedging their dollars invested here is real and ongoing. Goods inflation is starting to re-enter the chat, and the rest of the market is feeling wobbly, to say the least. While I'm no buy and holder of this or any stock, those tailwinds are good ones to have. The stock is still solidly in an uptrend, and there is nearby support as well. Also, it has pulled back 25% already and rallied 5% intraday off its low to close above near term support. I like all of that.
The correction in gold, frankly, is a normal and healthy one in my opinion. Does it continue? Maybe. But I do think it's a bit of an overreaction here. Other precious metals are simply along for that ride. This stock has made me too much money too many times to ignore this opportunity at this level. In fact, I got in yesterday (and again at the close today at 5.13). I think there's a very real chance of a double digit percentage rebound from here.
If you doubt this, I get it. But I would look at those past ideas I've posted and how those turned out before you dig your heels in too hard against this one. But, markets only function when there are opposite viewpoints about the future price of a stock, so have at it if you're a bear here. If this takes a while to resolve, I am not at all opposed to tactically adding more if the opportunity is a good one, or taking profits for the same reason.
As always - this is intended as "edutainment" and my perspective on what I am or would be doing, not a recommendation for you to buy or sell. Act accordingly and invest at your own risk. DYOR and only make investments that make good financial sense for you in your current situation.

EUR/USD potential buy ideaTechnical indicators are showing a “Buy” bias on several platforms: for example, one review found that moving averages and momentum indicators together give a net “Buy” signal for EUR/USD.
The euro has held important support levels, suggesting a possible base for further upside: models suggest support around 1.1550–1.1600 and resistance around 1.1700–1.1760, implying room to move upward if support holds.
Over the past 12 months the euro has strengthened versus the dollar (up ~7.6% over a year) which gives a backdrop of euro-strength and maybe a momentum tailwind.
Trading Economics
Market sentiment appears to lean toward accumulation of the euro, as one summary shows an 88% “Buy” average among several indicators (albeit with “soft” strength) for this pair.
In a broader context, if the European Central Bank (ECB) holds steady or signals resilience while the Federal Reserve shows caution, this divergence in central-bank policy could benefit the euro relative to the dollar. (While not explicitly quantified in the sources, analysts cite such dynamics as part of the backdrop behind recent euro strength.)

ETH/USDTCRYPTOCAP:ETH might revisit the $3370 zone one final time before it’s ready for liftoff. That level would serve as a strong higher low before the next leg up. Once momentum shifts, I’m expecting around a 115% move toward the $7200 target, a key breakout level on the chart.

AVAX : Under the priceHello friends
well, technically, this currency has hit its resistance and formed a double top pattern, and here we have found good and strong support, which can be purchased in stages with capital and risk management, and moved with it to the specified target.
From this perspective, you should note that this currency is currently trading below its intrinsic value, and given that it is a good project, there is a good opportunity to buy it with this decline.
*Trade safely with us*

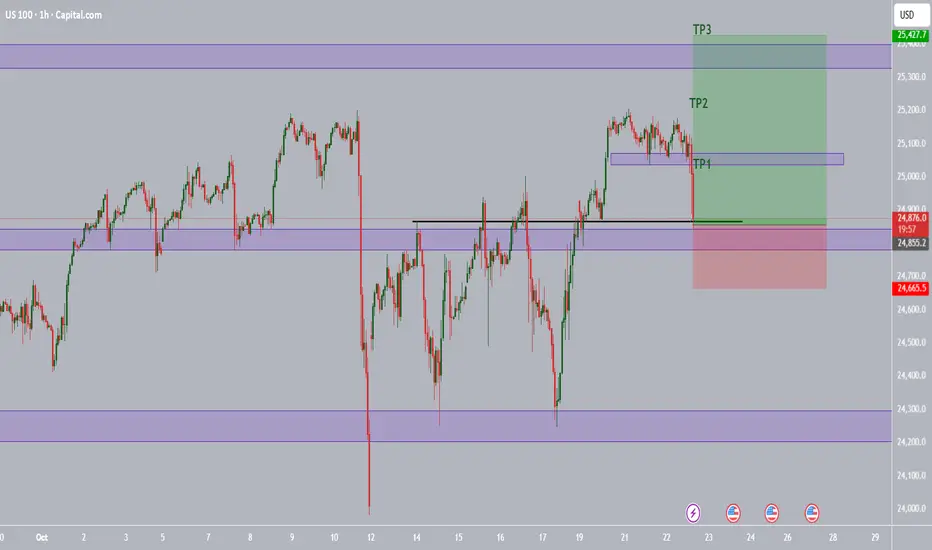
US100 - LONG POSSIBILITYPrice is curently at at crucial point since it's sitting on a broke previous resistence zone which have a very high chance of being use as a support zone. This is purely ideas purpose only and should not be used alone to take on a trade. Good profits traders.
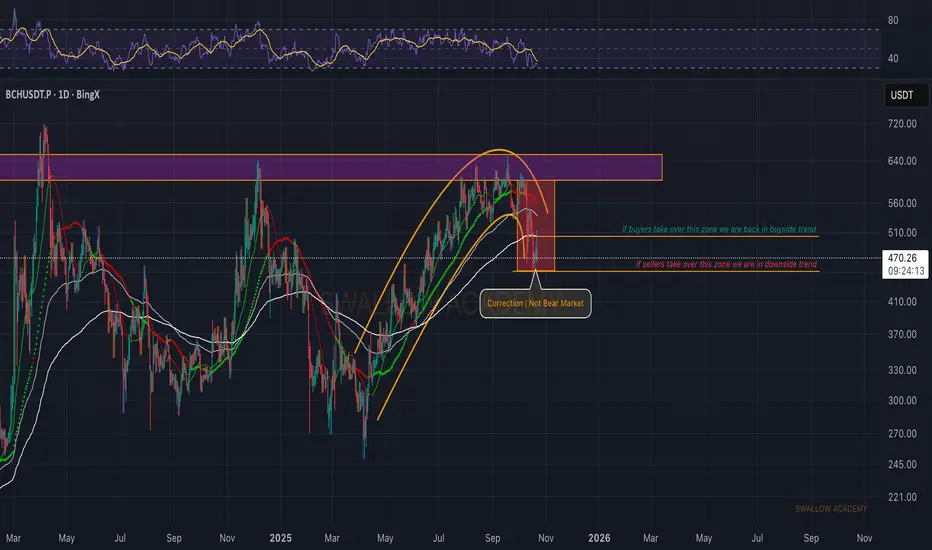
Bitcoin Cash (BCH): Waiting is Key | Might Be a Strong Push SoonAfter a strong upside movement, BCH faced a clean rejection from the resistance zone and is now hovering near the EMAs, slightly below them. Buyers are trying to stabilize, but the pressure remains visible.
The game plan is simple — we wait for either buyers to reclaim control above the EMAs, which would confirm continuation toward the upper zone, or for sellers to take over fully, which would confirm a deeper correction. Patience here is key.
Swallow Academy
GoldXAUUSD
- Change of Characteristics
- Strong Bullish Trend Line
- Completed " 12345 " Impulsive Waves and " ABC " Corrective Waves
- Order Block
- RSI - Divergence

USDJPY bullish breakout supported at 150.70The USDJPY remains in a bullish trend, with recent price action showing signs of a breakout within the broader sideways trend.
Support Zone: 150.70 – a key level from previous consolidation. Price is currently testing or approaching this level.
A bullish rebound from 150.70 would confirm ongoing upside momentum, with potential targets at:
152.60 – initial resistance
153.30 – psychological and structural level
153.80 – extended resistance on the longer-term chart
Bearish Scenario:
A confirmed break and daily close below 150.70 would weaken the bullish outlook and suggest deeper downside risk toward:
150.35 – minor support
149.95 – stronger support and potential demand zone
Outlook:
Bullish bias remains intact while the USDJPY holds above 150.70. A sustained break below this level could shift momentum to the downside in the short term.
This communication is for informational purposes only and should not be viewed as any form of recommendation as to a particular course of action or as investment advice. It is not intended as an offer or solicitation for the purchase or sale of any financial instrument or as an official confirmation of any transaction. Opinions, estimates and assumptions expressed herein are made as of the date of this communication and are subject to change without notice. This communication has been prepared based upon information, including market prices, data and other information, believed to be reliable; however, Trade Nation does not warrant its completeness or accuracy. All market prices and market data contained in or attached to this communication are indicative and subject to change without notice.

btc on buy reverse#BTCUSD we await price to drop below 107851 to buy, which will retrace back 110150.
Buy limit at 107851, target 109533-110150, stop loss 106900.
Below 106800 holds continuation on sell target 103k

Is Delta Air Lines Taking Off?Delta Air Lines has pressed into a tight range, but some traders may think it’s ready to start climbing.
The first pattern on today’s chart is the series of higher lows since the spring. DAL has stayed above that rising trendline and yesterday inched to its highest closing price since February 20. That combination may be viewed as evidence of an approaching breakout.
Second, the 50-day simple moving average (SMA) had a “golden cross” above the 200-day SMA in late August. That could suggest its long-term trend has gotten more bullish.
Third, the 8-day exponential moving average (EMA) is above the 21-day EMA. MACD is also rising. Those signals may reflect a bullish short-term trend.
TradeStation has, for decades, advanced the trading industry, providing access to stocks, options and futures. If you're born to trade, we could be for you. See our Overview for more.
Past performance, whether actual or indicated by historical tests of strategies, is no guarantee of future performance or success. There is a possibility that you may sustain a loss equal to or greater than your entire investment regardless of which asset class you trade (equities, options or futures); therefore, you should not invest or risk money that you cannot afford to lose. Online trading is not suitable for all investors. View the document titled Characteristics and Risks of Standardized Options at www.TradeStation.com . Before trading any asset class, customers must read the relevant risk disclosure statements on www.TradeStation.com . System access and trade placement and execution may be delayed or fail due to market volatility and volume, quote delays, system and software errors, Internet traffic, outages and other factors.
Securities and futures trading is offered to self-directed customers by TradeStation Securities, Inc., a broker-dealer registered with the Securities and Exchange Commission and a futures commission merchant licensed with the Commodity Futures Trading Commission). TradeStation Securities is a member of the Financial Industry Regulatory Authority, the National Futures Association, and a number of exchanges.
TradeStation Securities, Inc. and TradeStation Technologies, Inc. are each wholly owned subsidiaries of TradeStation Group, Inc., both operating, and providing products and services, under the TradeStation brand and trademark. When applying for, or purchasing, accounts, subscriptions, products and services, it is important that you know which company you will be dealing with. Visit www.TradeStation.com for further important information explaining what this means.

Nas100 Trade Set Up Oct 22 2025Price has swept PDH and a daily BSL with a closure under leaving lots of SSL levels and daily FVG that i will target for sells after BSL being swept on the 15m

Gold Intra-day Analysis 22-Oct-25
A quick short video on Gold after the strong profit taking we saw yesterday.
We are focusing on higher time frame areas in interest to watch for the price action as we reach them.
Disclaimer: easyMarkets Account on TradingView allows you to combine easyMarkets industry leading conditions, regulated trading and tight fixed spreads with TradingView's powerful social network for traders, advanced charting and analytics. Access no slippage on limit orders, tight fixed spreads, negative balance protection, no hidden fees or commission, and seamless integration.
Any opinions, news, research, analyses, prices, other information, or links to third-party sites contained on this website are provided on an "as-is" basis, are intended only to be informative, is not an advice nor a recommendation, nor research, or a record of our trading prices, or an offer of, or solicitation for a transaction in any financial instrument and thus should not be treated as such. The information provided does not involve any specific investment objectives, financial situation and needs of any specific person who may receive it. Please be aware, that past performance is not a reliable indicator of future performance and/or results. Past Performance or Forward-looking scenarios based upon the reasonable beliefs of the third-party provider are not a guarantee of future performance. Actual results may differ materially from those anticipated in forward-looking or past performance statements. easyMarkets makes no representation or warranty and assumes no liability as to the accuracy or completeness of the information provided, nor any loss arising from any investment based on a recommendation, forecast or any information supplied by any third-party.
Risk Warning: 74% of retail investor accounts lose money when trading CFDs with this provider. You should consider whether you can afford to take the high risk of losing your money. Please refer to our full risk disclaimer on our website.

TSLA: Fundamentals Are Collapsing While Valuation Stays in OrbitTesla is trading near multi-month highs… but the fundamentals tell a very different story.
EPS has dropped by 50%, revenue growth has almost stalled, and yet the stock still carries a Forward P/E of 164.
This combination — slowing growth and extreme valuation — looks like the definition of an institutional bubble setup.
🧮 Fundamental Context
Over the past few years, Tesla’s growth has slowed dramatically:
Revenue rose from 31B → 53B → 81B → 96B → 97B — barely any increase.
EPS climbed from 0.2 → 1.6 → 3.6 → 4.3 — and then fell by half.
Quarter-over-quarter metrics remain negative, with no visible recovery trend.
Meanwhile, the Forward P/E of 164 implies double-digit expansion ahead — which clearly isn’t happening.
The fundamentals simply do not justify this kind of valuation.
Right now, Tesla’s numbers resemble the early phase of a valuation compression cycle — where prices eventually catch up with reality.
📉 Technical Structure
Technically, Tesla has been moving in a broad sideways range, forming what looks like a long-term Wave 4 structure.
We’re currently inside the “B” leg, which could already be complete or near completion.
Once that wave ends, the next expected move is a Wave C decline.
Key levels to watch:
📍 Upper resistance zone: $400 – $550
📍 Primary cluster: around $250
📍 Support zone: $150 – $200
The chart shows clear volume concentration around $250 — once that level breaks, the next liquidity pocket sits between $150 and $200.
That’s where a potential bottoming cluster could form before the final upward leg.
⚠️ Market Outlook
While other FANG names maintain solid balance sheets and stable earnings, Tesla’s fundamentals are deteriorating sharply.
Yes, the stock may still see short-term pumps driven by sentiment or Musk’s fan base — but markets always return to fundamentals.
And those fundamentals are pointing downward.
📊 Summary
EPS and revenue both trending lower 📉
Forward P/E at 164 — completely disconnected from growth metrics
Technical range suggests potential decline toward $200–$150
Current price action likely part of a larger corrective structure
Long-term investors should exercise extreme caution ⚠️
Tesla isn’t a short-term “growth story” anymore — it’s a valuation risk story.
Until earnings stabilize and margins recover, this stock looks massively overpriced.

DXY Bullish move 99.00 (Readmore)...💹 #DXY Analysis (1H Timeframe) 💹
🟢 Bullish Momentum Building Up!
Price showing strong buying pressure from the key support zone at 99.00 📈
🎯 Technical Targets:
1️⃣ 99.300 – First target
2️⃣ 99.500 – Second target
📊 As long as price holds above 99.00, bullish bias remains intact.
#DXY #USDIndex #Forex #TechnicalAnalysis #PriceAction #TradingSetup 🚀

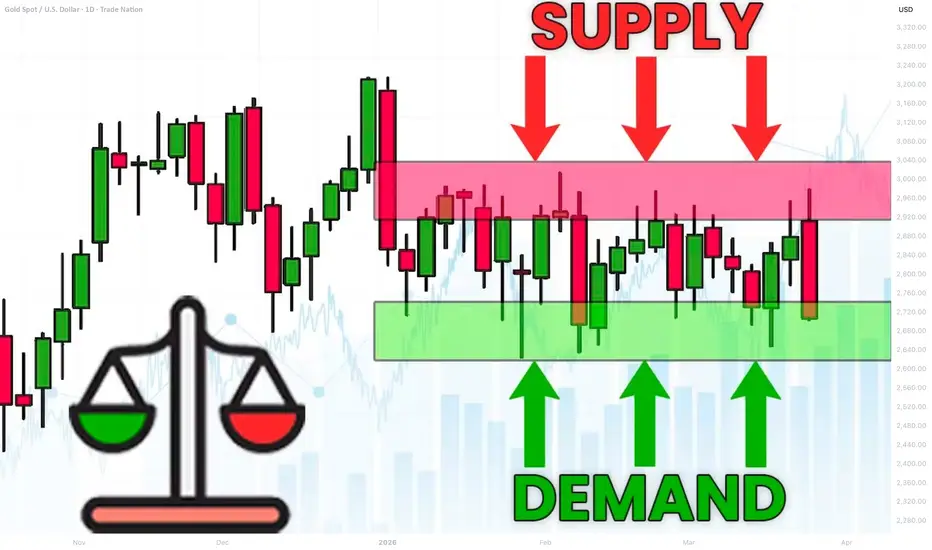
What is Equilibrium in SMC. Balance and Imbalance in Forex Gold
Equilibrium is one of the core elements for understanding market liquidity.
In this article, we will go through the essential basics of liquidity in Forex trading with Smart Money Concepts SMC.
You will learn the interconnections between supply and demand and I will explain how to easily identify balance and imbalance on any market.
Let's start our discussion with understanding how forex pairs move.
The price of an asset goes up if the market demand is stronger than the market supply. The excess of buying activity make the markets update the highs. In smart money concepts, such an event will also be called a buying imbalance.
Look at a strong bullish rally on Gold.
The price is going up because of a buying imbalance.
A strong buying activity creates a massive amount of buyers with unfilled orders.
To entice sellers to start selling, they must offer a higher-better price.
At the same time, if the price of an asset goes down , it means that the market supply is stronger than a demand. The excess of supply will make the markets update the lows. In smc, it will be called a selling imbalance.
That is exactly what is happening with GBPUSD forex pair.
A strong selling activity and the shortage of demand makes the price go down.
The excess of supply or demand on the market can not be eternal.
The lower the price becomes, the more buyers will start buying, and the more sellers will start closing their positions.
At some moment, the surplus of supply will be absorbed by the buyers.
That will be a moment when the market will find equilibrium , the balance between supply and demand.
A strong bearish imbalance on USDJPY made the price drop significantly.
The falling price made 3 things:
It attracted more buyers, because the lower the price the more profitable is buying USDJPY.
It discouraged some buyers from buying, considering that the price is already "too low".
It encouraged some buyers to close their positions in profit.
Because of that, USDJPY stopped falling and found a balance in supply and demand. That is what we call Equilibrium .
In a bull run, the higher the price will go, the more sellers will start selling.
At some moment, buying imbalance will be absorbed by the bears and supply & demand will eventually balance.
Such an event will be called the equilibrium .
EURGBP was rallying strongly.
The higher the price went, the more sellers started to sell, considering selling the pair more and more profitable.
And the same time, fewer buyers were buying and the more started to close their buy positions in profits.
At some moment, the entire excess of the market demand was absorbed by a supply. The market stopped growing and equilibrium was found.
One of the main characteristics of a market equilibrium is sideways price movement and a termination of a formation of new highs or new lows.
Usually, such a sideways price action will form a horizontal range.
That's a real example how a CAD JPY pair found an equilibrium after an extended bearish movement. A formation of a horizontal range confirmed a balance between a supply and a demand.
Please, note that these ranges will form on any time frame that you analyse.
The rule is that the higher is the time frame of the range, the stronger is the market equilibrium.
Above, I have 3 different charts:
USDJPY on a daily time frame, EURJPY on a 4H and GBPUSD on 15 minutes.
All the pairs found an equilibrium in horizontal ranges.
An equilibrium on USDJPY will signify intra week or even intra month balance,
while on EURJPY it will mean intraday/intra week balance.
On GBPUSD, it will signify intraday equilibrium.
Market equilibrium can not last forever.
Fundamentals news and changing market conditions, make the market participants constantly reassess a fair value of an asset.
A violation of the range and a breakout of one of its boundaries will be a trigger of an occurrence of an imbalance .
A bullish violation of the upper boundary of the range will signify a buying imbalance and a highly probable rise to the new highs.
While a bearish violation of the lower boundary of the range will mean a selling imbalance and a highly probable fall to the new lows.
Please, study how GBPCHF was moving for a week on an hourly time frame.
The periods of balance were changed by the periods of bullish or bearish imbalances, that found a new equilibrium on higher/lower price levels.
Understanding of basic principles of supply and demand in trading is essential for profitable trading smart money concepts.
Learn to recognize the periods of imbalance and equilibrium.
It will provide you the edge in understanding and trading any forex pair.
❤️Please, support my work with like, thank you!❤️
I am part of Trade Nation's Influencer program and receive a monthly fee for using their TradingView charts in my analysis.
Ethereum Buying OpportunityGold has seen a massive decline, and capital often seeks new strongholds during such shifts. With investors moving away from metals, crypto — particularly Ethereum — looks like an attractive alternative.
From a technical standpoint, ETH has experienced a healthy correction and is now forming a bullish wedge pattern, hinting at potential upside momentum. The structure suggests that accumulation is taking place before a possible breakout.
If the price breaks and holds above the upper trendline, a strong rally could follow, offering a potential 25% upside from current levels.
📈 Target zone: Around $4,713
💡 Setup bias: Bullish continuation after consolidation
Ethereum’s blend of solid fundamentals, renewed investor attention, and technical setup could make it one of the top assets to watch in the coming days.

SUIUSDT the 2$ support strong to pump price above 3$ againWe are now anticipating a potential resumption of the bullish trend. Our analysis identifies a significant resistance confluence at the $3.00 level, which aligns precisely with the ascending trendline established on the chart. For a confirmed bullish signal, we require a decisive price breakout, supported by strong volume, above this key technical level. Such a breakout would invalidate the current resistance structure and likely initiate a new phase of sustained upward momentum, paving the way for the asset to target higher resistance zones as projected in our analysis.
DISCLAIMER: ((trade based on your own decision))
<<press like👍 if you enjoy💚

Elliott Wave Analysis – XAUUSD (October 22, 2025)
🔹 1. Momentum
D1:
The D1 momentum is preparing to turn bullish, signaling the start of a new upward trend.
→ We can expect at least 3–5 consecutive bullish days ahead.
H4:
We need to wait for the H4 candle to close to confirm the reversal signal.
If confirmed, there’s a strong possibility that today will form an intraday uptrend.
H1:
H1 momentum has already turned upward, but it’s now in the overbought zone.
Therefore, the current rise won’t be strong, and a minor pullback is needed to bring momentum back to the oversold area — creating a foundation for a more stable bullish move.
________________________________________
🔹 2. Wave Structure
D1 Timeframe:
Yesterday saw a sharp decline, but D1 momentum is now preparing to reverse upward.
Counting the correction candles, we already have five candles, suggesting that the market may soon enter a new bullish phase lasting 3–5 days or more.
During this recovery phase, we need to monitor two key scenarios:
• If wave movements overlap and lack strength, and when D1 momentum returns to the overbought zone but price fails to break the previous high, then the Wave 4 (yellow) scenario is still in play.
• If price rises sharply and decisively, the recent correction might only be part of Wave 3 (yellow), meaning the bullish trend is continuing.
H4 Timeframe:
Yesterday’s structure was identified as a Flat correction, and it remains valid.
Price has retraced into the Wave 4 zone of the smaller degree structure, reaching the 2.0 Fibonacci extension of Wave A.
If Wave 5 (purple) is now developing, the ideal target would be around 4476.
However, if price rises with overlapping waves, this could instead represent a corrective move within Wave 4 (yellow), targeting the previous high zone between 4381 and 4476.
H1 Timeframe:
Within Wave W, there is a small Flat correction, where Wave C extended to twice the length of Wave A.
Now, Wave Y (blue) has also declined to 2× Wave W, suggesting weakening buying power.
Even so, in the short term, we still expect an intraday bullish move today.
→ The trading bias remains buy-side until H4 momentum reaches the overbought area and reverses.
________________________________________
🔹 3. Trading Plan
Buy Zone: 4101 – 4098
Stop Loss (SL): 4088
Take Profit 1 (TP1): 4190
________________________________________
🔹 4. Notes
Liquidity and resistance zones are already marked on the chart.
→ Wait for price to break and retest those areas to confirm a valid Buy setup.

Perfect prediction of BTC trend, today's retracement continuesWith the emergence of the double top structure, gold and silver investors have been taking profits, and market funds have continued to flow into crypto assets led by BTC and ETH.
Historically, BTC and the broader cryptocurrency market have risen after gold peaks, driven by capital rotation.
In his opening remarks at the Federal Reserve's first Payment Innovation Conference held today, Federal Reserve Governor Waller spoke highly of cryptocurrencies and the "DeFi industry." Waller noted that the conference aims to explore how blockchain and cryptocurrency can be integrated into mainstream finance.
At the same time, the Federal Reserve also indicated that it would create a new era in the payment field, and the DeFi industry would not be doubted or despised.
Waller also revealed that he has proposed setting up a new type of account at the central bank, which he called a "payment account." Waller said he has asked the Fed to consider this new type of account, which would make it easier for businesses to access the central bank's payment channels without having to have a full master account. This move has clearly increased market attention for cryptocurrencies.
In the subsequent BTC trading market, we can once again use 109500-108500 as short-term support, and go long on pullbacks to see rebounds. Pay attention to the 113000-115000 resistance zone above. If the momentum is maintained, it may move towards 120000.
BITSTAMP:BTCUSD BITSTAMP:BTCUSD
