Gold Price Analysis March 13⭐️Fundamental Analysis
Gold prices maintained a positive trend in early European trading on Thursday and remained near the all-time high reached on February 24. The chaotic implementation of US President Donald Trump's trade tariffs and their impact on the global economy continued to drive safe-haven flows into bullion for the third consecutive day.
Meanwhile, fears of a US recession, coupled with signs of a cooling labour market and falling inflation, will allow the Federal Reserve (Fed) to resume its rate-cutting cycle sooner than expected. This, in turn, kept the US dollar (USD) near its lowest level since October 16 touched on Friday and turned out to be another factor supporting non-yielding gold prices.
⭐️Technical Analysis
Gold is correcting to the immediate support zone of 2930 if the support zone is broken 2922 is the next support point before gold price moves to 2910. The resistance zone of 2950 is considered as a barrier before reaching ATH and the daily sell plan is noticed around 2970
Trend Analysis

XPD/USD "The Palladium" Metals Market Heist Plan🌟Hi! Hola! Ola! Bonjour! Hallo! Marhaba!🌟
Dear Money Makers & Robbers, 🤑 💰💸✈️
Based on 🔥Thief Trading style technical and fundamental analysis🔥, here is our master plan to heist the XPD/USD "The Palladium" Metals market. Please adhere to the strategy I've outlined in the chart, which emphasizes long entry. Our aim is the high-risk Red Zone. Risky level, overbought market, consolidation, trend reversal, trap at the level where traders and bearish robbers are stronger. 🏆💸Book Profits Be wealthy and safe trade.💪🏆🎉
Entry 📈 : "The heist is on! Buy above (960.00) then make your move - Bullish profits await!"
however I advise to placing the Buy Stop Orders above the breakout Level (or) placing the Buy limit orders within a 15 or 30 minute timeframe, Entry from the most Recent or Swing low or high level should be in retest.
Stop Loss 🛑:
Thief SL placed at the recent / nearest low level Using the 4H timeframe (930.00) swing trade basis.
SL is based on your risk of the trade, lot size and how many multiple orders you have to take.
Target 🎯: 1010.00 (or) Escape Before the Target
🧲Scalpers, take note 👀 : only scalp on the Long side. If you have a lot of money, you can go straight away; if not, you can join swing traders and carry out the robbery plan. Use trailing SL to safeguard your money 💰.
XPD/USD "The Palladium" Metals Market is currently experiencing a bullish trend,., driven by several key factors.
📰🗞️Read the Fundamental, Macro Economics, COT Report, Seasonal Factors, Intermarket Analysis, Sentimental Outlook, Future trend predict.
Before start the heist plan read it.👉👉👉
📌Keep in mind that these factors can change rapidly, and it's essential to stay up-to-date with market developments and adjust your analysis accordingly.
⚠️Trading Alert : News Releases and Position Management 📰 🗞️ 🚫🚏
As a reminder, news releases can have a significant impact on market prices and volatility. To minimize potential losses and protect your running positions,
we recommend the following:
Avoid taking new trades during news releases
Use trailing stop-loss orders to protect your running positions and lock in profits
💖Supporting our robbery plan 💥Hit the Boost Button💥 will enable us to effortlessly make and steal money 💰💵. Boost the strength of our robbery team. Every day in this market make money with ease by using the Thief Trading Style.🏆💪🤝❤️🎉🚀
I'll see you soon with another heist plan, so stay tuned 🤑🐱👤🤗🤩

TRUMP/USD Short Overviewhello friends good morning hope you are good this my analysis about TRUMP/USD .
TRUMP/USD is trading near $0.2956, with recent price action showing consolidation between an intraday low around $0.2867 and a high near $0.3002. Technically, the pair is holding above its short-term moving averages, with momentum indicators hinting at bullish potential while avoiding overbought conditions. From a fundamental perspective, positive community sentiment and evolving project utility are supporting the coin, even as broader market and regulatory uncertainties persist. This blend of technical strength and stable fundamentals suggests a cautiously optimistic outlook for traders.

Weekly Support is around 80000.Weekly Support is around 80000.
However, 72500 - 73000 is its previous
breakout level & probably a Best Buying Rage
(if it touches) which is also a Confluence area of
Trendline Support+Important Fib. level.
Bullish Divergence on Shorter Time Frame +
Weekly Support around 80000 (if Sustained)
may push the Price up towards 87000 &
then around 95000 - 96000.
Ultimate Resistance is around 110000.
Crossing this level may open new Highs
Targeting around 136000.
On Shorter Timeframe, 85000 - 86000 is
the Immediate Resistance & Support is
around 80000.

$2.36 to $6.54 Strong vertical move $CRVO$2.36 to $6.54 🚀 Strong vertical move on 4 Buy Alerts 🎯 NASDAQ:CRVO
By far beats trading NASDAQ:NVDA NASDAQ:TSLA even on their strongest day
it's trading at 137 million shares so far, at $6 per share that's $1 Billion USD exchaning hands and we still have power hour left.

Bitcoin in correction phaseWave 4 price is currently shoeing, with a target range of 72000-73000. Looking for a buy opportunity at 73000. Uptrend confirmation requires a close above 92000.Keeping a close eye on that 73000 level then. Gotta be quick on the trigger if it dips down there. Don't want to miss the boat if it bounces. Setting an alert for 73000 just to be sure. Still cautious though, that 92000 close is the real confirmation we're looking for. Until then, it's a calculated risk. Might even consider a tight stop-loss just below 72000 to manage potential downside if this wave 4 ain't finished correcting. Patience is key here, don't want to jump the gun. Waiting for that setup.

XAUUSD ProjectionAfter CPI News price didn't when to much to the down side, it gave us a good retracement after hitting the FVG that was left behind, the reaction was clear and smooth, breaking above the actual and past supply zones. With this scenario right now we're waiting to see price trying to go for past highs, we're really close to a new ATH may be hit tomorrow. Correction is going to be interesting to analyzing though.

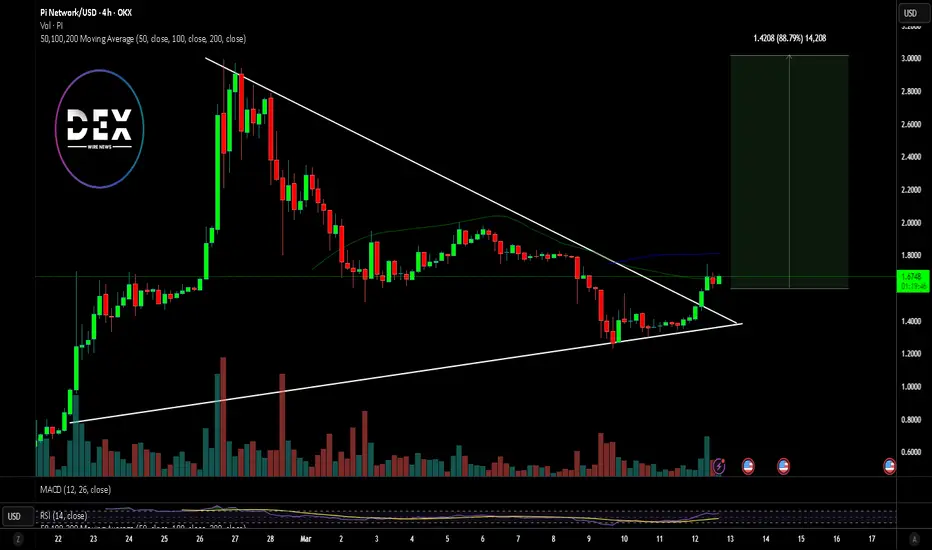
$PI Set for Massive Breakout Amidst Bullish Symmetrical TriangleThe long-awaited launch of NASDAQ:PI has ignited excitement in the crypto space. After six years of mining, Pi Coin finally hit the open market last month, and its price action suggests a potential major breakout. With a bullish symmetrical triangle pattern forming and key technical indicators aligning in its favor, NASDAQ:PI is gaining traction among investors and traders alike.
Technical Analysis
Pi Coin is currently trading at $1.66, having surged 22.75% in the last 24 hours. Its 24-hour trading volume stands at an impressive $811,256,445, indicating strong market interest.
Symmetrical Triangle Formation
A symmetrical triangle is often considered a continuation pattern, signaling a potential breakout in the direction of the prior trend. NASDAQ:PI recently broke out of this bullish formation, setting the stage for further upside movement.
The Relative Strength Index (RSI) sits at 62, suggesting increasing buying pressure. An RSI above 70 typically signals overbought conditions, but with room for growth, NASDAQ:PI is positioned for an extended bullish campaign. If buying pressure intensifies, NASDAQ:PI could soon breach the key psychological resistance at $2, with the next pivot point set at $3.
Market Capitalization and Trading Volume
NASDAQ:PI boasts a live market cap of $11.91 billion, with a circulating supply of 7.15 billion coins. Such a high ranking underscores the coin’s growing adoption and market confidence.
Conclusion: What’s Next for Pi Coin?
With strong technical indicators and a solid fundamental foundation, NASDAQ:PI appears well-positioned for continued growth. If the buying momentum sustains, breaking the $2 resistance could open the door for a push towards $3. Meanwhile, its unique approach to mining and real-world adoption potential make it an intriguing project for long-term investors.
I'm Bullish, but... MANA / USDTHi friends,
My latest post about MANA was bullish, and I did buy some of the blood we just had.
But this would be another coin that could drop 25% - 30% giving a great opportunity.
Keep an eye on BTC cause if it dumps, this will happen.
Trade thirsty!

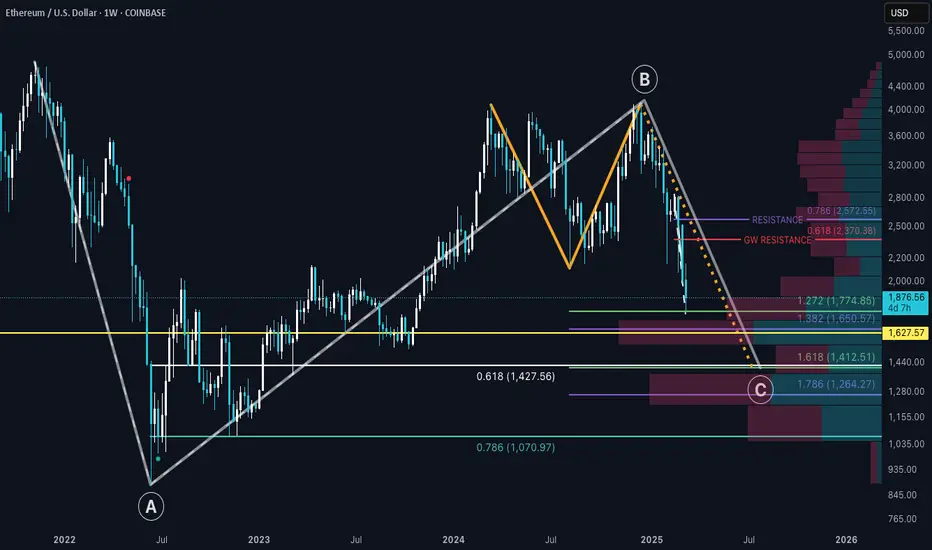
Will ETH Show Signs of Strength?ETH tagged the 1:1.272 pocket recently and bounced right off. This pocket is a major support area; given the HVN (High Volume Node) that rests in that zone.
This asset may start to show signs of strength compared to Bitcoin as we come closer to alt coin season (yes, I highly favor an alt coin season). But the question is when?
That transition could start during this correctional phase or shortly after. So trying to pinpoint the correctional bottom for ETH may be challenging.
As USDT.T has the potential to form higher local highs, I would imagine that ETH would print a lower low. There is a POC (Point of Control: Yellow Horizontal Line) that the lower low could hit @ $1627.57. If that is the case, this would suggest that ETH is indeed starting to show signs of strength compared to BTC.
If support breaks in that area, the next stop is the 1:1.618 pocket @ $1412.51. If this happens, I believe that anything lower than that support window (ending at the 1.786; $1264.27) would not be up for grabs. I'm going to label this scenario as "worst case"; The 1:1.618 GW correction.
When considering higher time frame 3 wave corrections (The gray ABC wave structure) a noticeably potential point of support is at the 1:0.618 of that larger ABC wave structure @ $1427.56.
So with these combined support structures in mind; I'm going to favor this area as the potential correctional bottom for ETH. I could be wrong, and ETH finds support at the POC horizontal ray, but only time can tell.
Good Luck Traders!
KAS looking for support. KAS has been dealing with a downtrend after a large distribution. Eventually, the trend will end; unfortunately, there are few signs of this. However, now is the time to put Kaspa on a watch list. The price hit a very good level of support and if the price can give us indications of a reversal it is time to get risk on.
Full TA: Link in the BIO

German $DAX ($EWG) Topping Out?Is the XETR:DAX topping out? Monthly RSI @ 80+ w/ weekly nosing over and daily bearish divergences observable. Index high from 3/6 coincided with the 261.8% Fibonacci extension of the 11/2021-10/2022 uptrend correction.
Confirmation short setup could materialize DAX closes below pivot low of the 1D uptrend (22226), bounces off of short-term demand (ex: 22142-21691, and trades into supply ≥ 22226. This scenario is speculative - the market needs to show its hand.
Presently, DAX is up > 1.5% alongside US stocks, which dipped into intermediate-term demand and benefited from softer-than-expected CPI prints. However, DAX (and domestic) bulls haven't proven anything yet. Unless buyers manage to push the DAX higher - initially above 22900 and secondarily through 23000-23200 - on accelerating momentum, risk remains to the downside (IMO). German stocks have been global relative strength leaders as of late, so if they do correct, other equity indexes may retreat in tandem.
Long-term charts for US indices ( SP:SPX , NASDAQ:NDX , TVC:RUT ) look more bearish vs. bullish (I still have some shorts on), though a near-term recovery is plausible. If domestic equities do trade lower, selling could materialize in Asian and European markets. Use LTF charts to monitor price action/manage risk and splice into shorts if German stocks AMEX:EWG start to crack.
My $0.02. Feedback welcome. Also, would appreciate any follows on X (more active there)!
Jon
X: @JHartCharts

$IWM - Trading Levels for March 12 2025
30min 35EMA still holding as resistance - 198 support.
196 bottom of the implied move, and a bear gap above.
Wow I really did that in no particular order, huh?
GL, y’all - I put an iron condor on this 194/196/206/207 at 1.97

Gold is reversing before reaching the round $3,000 mark.Gold is reversing before reaching the round $3,000 mark.
As you can see on the chart, we’ve hit the 227% Fibonacci level.
— Back in 2008, after testing this level, we went into a correction.
— I think we might see a similar scenario play out from here.
Dollar Index:
SP500/SPY:

UK100 about to drop again?good day traders, our past trades were a success and as you can see UK100 is repeating the same pattern again, meaning we are anticipating another drop, I won't explain much because it's simple and clear analysis that is self-explanatory. all I can say is wait for a candle rejection and enter

Head and Shoulders ( HnS)There is a visible head ans shoulders pattern, CPI can either invalidate it or validate it. 10 more minutes

TAOUSDT UPDATETAOUSDT is a cryptocurrency trading at $263.8. Its target price is $360.0, indicating a potential 45%+ gain. The pattern is a Bullish Falling Wedge, a reversal pattern signaling a trend change. This pattern suggests the downward trend may be ending. A breakout from the wedge could lead to a strong upward move. The Bullish Falling Wedge is a positive signal, indicating a potential price surge. Investors are optimistic about TAOUSDT's future performance. The current price may be a buying opportunity. Reaching the target price would result in significant returns. TAOUSDT is poised for a potential breakout and substantial gains.

AUDJPY The Target Is UP! BUY!
My dear friends,
My technical analysis for AUDJPY is below:
The market is trading on 92.761 pivot level.
Bias - Bullish
Technical Indicators: Both Super Trend & Pivot HL indicate a highly probable Bullish continuation.
Target - 93.288
About Used Indicators:
A pivot point is a technical analysis indicator, or calculations, used to determine the overall trend of the market over different time frames.
———————————
WISH YOU ALL LUCK

Eurousd technical analysis.This is a 1-hour candlestick chart of the EUR/USD (Euro/US Dollar) currency pair from OANDA, published on TradingView. The price at the time of the screenshot is 1.09141, with a decrease of -0.00053 (-0.05%).
Analysis of the Chart:
A purple rectangular zone is highlighted, indicating a support zone where price previously found demand.
A blue ascending trendline is drawn, showing an uptrend.
A blue arrow suggests a possible price movement scenario:
1. Price might retest the support zone and trendline.
2. A bounce is expected, leading to a further upward move.
Key Takeaways:
If the price holds the support zone, an upward continuation could occur.
If the price breaks below the support, it could indicate a bearish move.
Would you like a deeper technical analysis or potential trade ideas?

GOLD NEXT SELL POSSIBLE MOVEAs of March 12, 2025, gold (XAU/USD) is trading around $2,921.98, reflecting a 0.37% increase from the previous close.
Recent market dynamics have propelled gold prices to unprecedented levels, nearing $3,000 per ounce. This surge is largely attributed to economic uncertainties stemming from U.S. import tariffs and ongoing geopolitical tensions, prompting investors to seek refuge in gold as a safe-haven asset.
Technical analysis indicates that gold's bullish momentum remains robust. The Relative Strength Index (RSI) is above 70, signaling overbought conditions, which could precede a short-term correction. Key support levels to monitor during potential pullbacks include $2,790, $2,530, and $2,430.
Given these factors, initiating a long sell position may be premature. It's advisable to await clearer bearish signals, such as a break below established support levels or confirmation of a trend reversal, before considering a sell strategy.

Gold is Buying every dip as expectedAs discussed throughout my yesterday's session commentary: My position: Keep Buying every dip on Gold.
Fundamental analysis: Gold eventually honored the Fundamental side (Inflation cooling and Tariffs outcome) and is Trading on a Bullish pattern on the healthy Ascending Channel. Now this is largely uncharted territory on the Hourly 4 chart. Typically the Ascending Channel is a pattern of trend continuation, marking a Bottom and turning Bullish on Short-term even though that Weekly chart Resistance zone should get invalidated to the upside. However the larger time-frame of Weekly chart (#1W) remains Bullish, so again I need to pay attention of potential reversal points and Selling the Top as High (and safely) as I can. Gold was Technically Bearish but Fundamental side prevailed and the result is those Bullish candles which are visible on the charts. Strong Resistance is seen at #2,952.80 - #2,957.80 while first Support is priced at #2,942.80, which means as long as Support is intact, there are more probabilities for the uptrend continuation. It is important to note that below #2,942.80, there is only #2,927.80 - #2,932.80 to hold Gold from testing #2,910's but again I need to keep in mind that on these Fundamentally driven sessions, Gold can go as far as pressure pushes it so I will not attempt to Sell current Buying bias, only if strong Support gets invalidated.
My position: Keep in mind that Gold is on undisputed Bullish trend and use every opportunity to re-Buy Gold. If #2,957.80 gets invalidated, #3,000.80 benchmark is next extension.

EURUSD Analysis todayHello traders, this is a complete multiple timeframe analysis of this pair. We see could find significant trading opportunities as per analysis upon price action confirmation we may take this trade. Smash the like button if you find value in this analysis and drop a comment if you have any questions or let me know which pair to cover in my next analysis.

BTCUSDT TRIANGLE CHART PATTERN IS HEREHello Guys Here Is Chart Of BTCUSDT in 1-H AT
Entry Level: Buy Around 81000-80700
Support: Around $78000
Target Will Be : 88000
If BTC breaks below this level, the Triangle pattern is invalidated, and further downside could occur.
