GBPJPYThis is the Daily chart perspective on GBPJPY, where price rejected the weekly supply zone. A volume gap at the left of the chart and price is heading down to mitigate the imbalance at 200.317
Trend Analysis

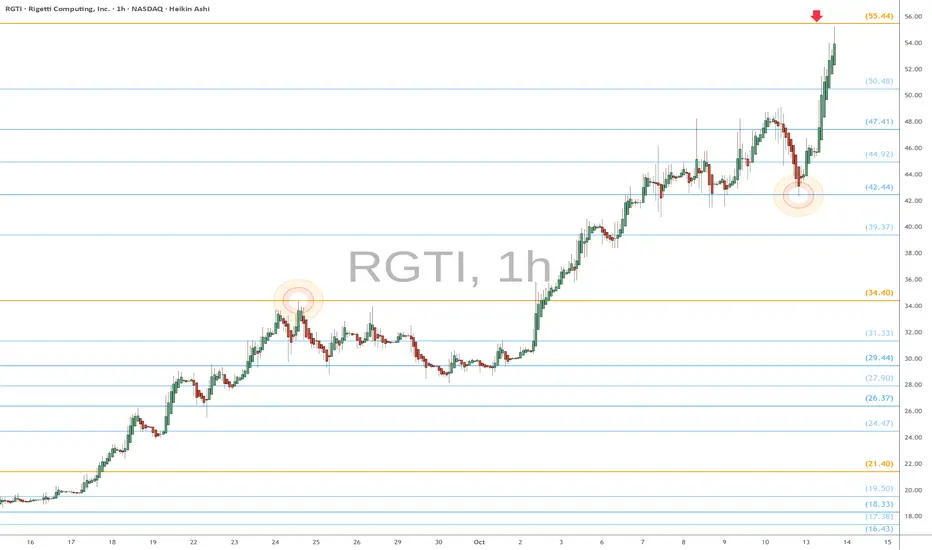
RGTI heads up at $55.44: Golden Genesis fib should give a DIPRGTI has been flying high for quite a while so far.
Now approaching a Golden Genesis fib at $55.44
Look for a Dip-to-Fib or Break-n-Retest incoming.
.
Previous Analysis that caught the BREAKOUT from $10
Hit BOOST and FOLLOW for more such PRECISE and TIMELY charts.
=========================================================
.
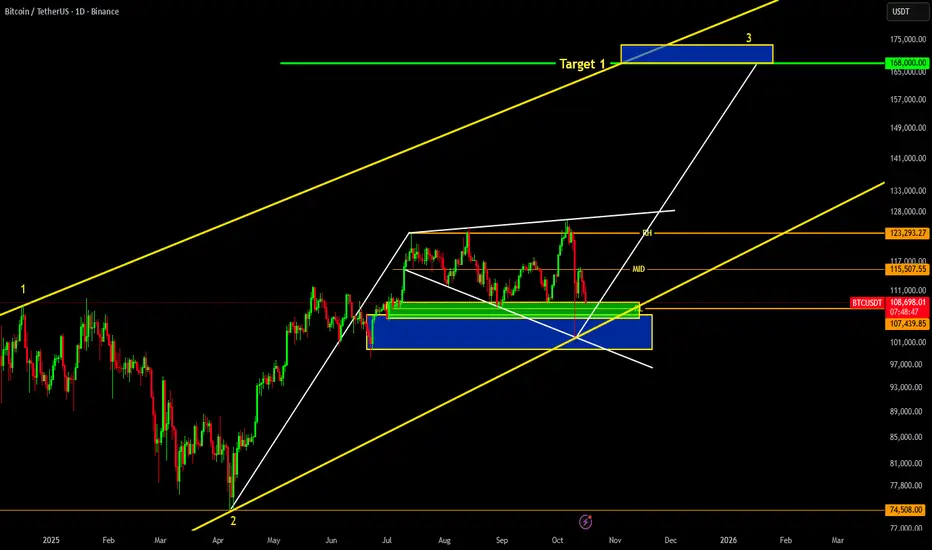
BTC IS ABOUT TO EXPLODE UPTO 168K!!!! BUY THE DIP ASAPThis is the only CRYPTOCAP:BTC chart you need to see. As we can see a proper expanding triangle is formed on major time frame, and this directly targets #btc to 168k. BUY THE DIP ASAP!!!
United Spirits Limited chart analysis: BUY Setup Entry: ₹1,359-1,365 (Current Level)
Target 1: ₹1,393-1,400
Target 2: ₹1,420-1,425
Target 3: ₹1,450+ (Extended)
Stop Loss: ₹1,338

TOTAL 2 ROAD MAPTotal 2 will start its upward move, but it will do so through a series of corrections along the way.

SILVER: The Market Is Looking Up! Long!
My dear friends,
Today we will analyse SILVER together☺️
The market is at an inflection zone and price has now reached an area around 51.058 where previous reversals or breakouts have occurred.And a price reaction that we are seeing on multiple timeframes here could signal the next move up so we can enter on confirmation, and target the next key level of 51.944.Stop-loss is recommended beyond the inflection zone.
❤️Sending you lots of Love and Hugs❤️

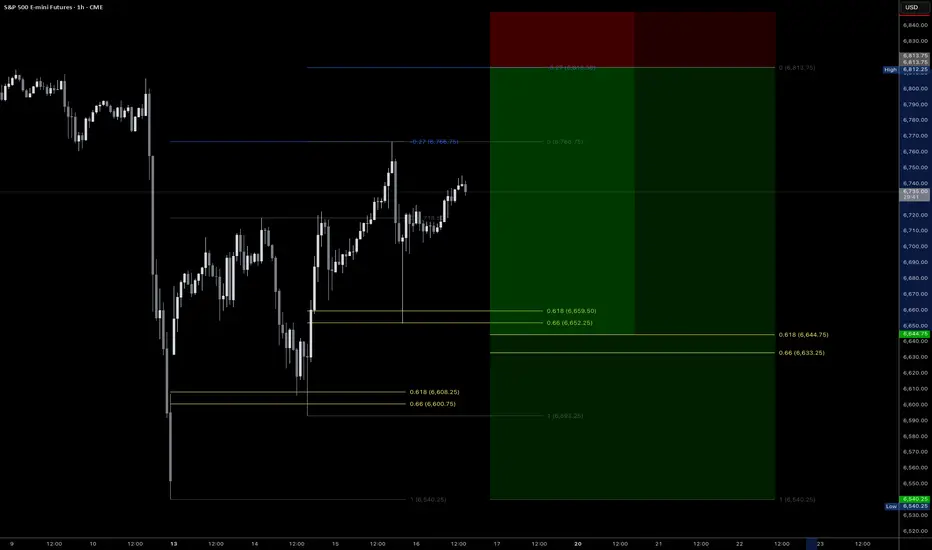
Watch out for 3 drives patternWith the last two retracements to the 0.618 and a perfect touch of the 0.272, we currently have an ideal setup for a potential three drives pattern.
If it hits the final 0.272, it will coincide with CME_MINI:ES1! reaching new all-time highs before reversing for a possible 150-point drop.
Let's see how it evolves.
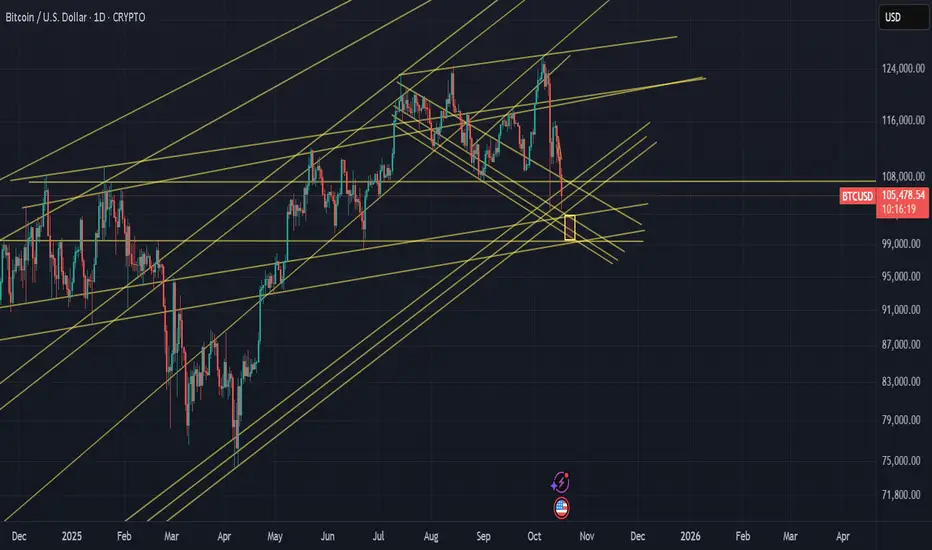
bear market startAccording to my analysis, Bitcoin will drop to the $70,000 range, and this drop is certain.


Opendoor Technologies Big Correction coming ?In this video I explore the recent explosion in the price of Opendoor Technologies .
Still along way off its All time highs but up some 2000% from the past few months alone
I analyse what could be a very key zone to build upon .
Tools used Fibs, VPR, VWAP, TPO Chart

Trendline Breakout and 1year high for NiftyNifty is at 1 year high at 25709 after making an yearly high of 25781.50. The trendline breakout has been achieved. All that we need for Nifty to grow from here is that the breakout should sustain. Also no negative news on Tariff front or any Geopolitical issue will be required for Nifty to forge its way ahead.
Supports For Nifty: Supports for Nifty are at 25378 (Important Fibonacci support), 24865 and 24333 (Strong Mother line support of 52 weeks.)
Resistances for Nifty are at: 25843, 26044 (Important Fibonacci resistance), 26277 (Previous All time high), 26529 (Fibonacci Golden ratio strong resistance) and finally 27470. After closing above 27470 doors for 28K will open directly.
To know more about Fibonacci retracement, Mother Father lines and my Mother, Father small Child theory, Fundamental analysis and how to draw charts or use Techno-Funda analysis do read my book the Happy Candles Way To Wealth Creation rated 4.8/5 on Amazon.
Things are looking good after a long time. Shadow of weekly candle is positive (Green). Hope some Geopolitical event or Tariff related news or weak earnings season does not spoil the chart again.
Disclaimer: The above information is provided for educational purpose, analysis and paper trading only. Please don't treat this as a buy or sell recommendation for the stock or index. The Techno-Funda analysis is based on data that is more than 3 months old. Supports and Resistances are determined by historic past peaks and Valley in the chart. Many other indicators and patterns like EMA, RSI, MACD, Volumes, Fibonacci, parallel channel etc. use historic data which is 3 months or older cyclical points. There is no guarantee they will work in future as markets are highly volatile and swings in prices are also due to macro and micro factors based on actions taken by the company as well as region and global events. Equity investment is subject to risks. I or my clients or family members might have positions in the stocks that we mention in our educational posts. We will not be responsible for any Profit or loss that may occur due to any financial decision taken based on any data provided in this message. Do consult your investment advisor before taking any financial decisions. Stop losses should be an important part of any investment in equity.

SOLANA Dream Buy ZoneSolana is currently forming a very interesting potential ABC corrective structure leading into the 1-1 trend based fibonacci extension being approx. $215. The end of this current Wave C is forming an ending diagonal nearing the apex.
According to Elliot Wave theory, ending diagonals (wedges) tend to occur when the existing directional trend is showing signs of exhaustion and requires a pricing reset/rebalance. This can occur as a very fast, sharp move downwards before continuing in the direction of the broader trend which remains to the upside.
What interests me is the several zones of confluence that line up just below $180, being the overall target of the wedge, as well as the location of both major VWAP's from the high and the low , that can act as major support zones for a bounce.
This drop could be fast and scary, likely to shakeout many traders and investors especially those on high leverage.
Ive set my alerts here at the zone for a major long trade that could sustain itself to new highs.

GOLD Actual Bullish Trend Analysis WAVE ANALYSIS / Gold reached the final zone of the substructure in the 4.23 projection, with this the wave 3 (W3) is completed and we should see a correction in the price when the bearish breakout is confirmed.

Don't you believe our team's analysis?Comrades, don't you believe in our team's analysis?😂
As we said 3 months ago about the first target, after the collision we expect a correction and after the correction we will move to the second target to the specified area.
Now this event is being completed bit by bit, what should you do now, after the heavy fall we had, Bitcoin made a candle with a long shadow, and this type of candle with a long shadow, the price moves again under the shadow with small candles and continues its trend again.
After the current fall, you can think about a step of buying.

ElDoradoFx PREMIUM – GOLD ANALYSIS (17/10/2025, US SESSION)Prepared by: ElDoradoFx Premium 2.0 Analyst Team
⸻
🧭 Market Overview
Gold has entered a corrective phase after failing to break and sustain above 4,379, the current weekly high. During the London session, price fell sharply to 4,305–4,313, testing the ascending trendline support and the Fibonacci Golden Zone from the latest bullish swing.
The daily chart remains bullish in structure, but intraday momentum has shifted bearish short-term, suggesting a potential retest deeper into support before a continuation to the upside.
⸻
📊 Technical Breakdown
1️⃣ Daily Chart (D1)
• Structure: Uptrend intact — higher highs & higher lows.
• RSI: 85.0 → Overbought, signaling possible cooling phase.
• Support Zone: 4,290–4,273 (near 38.2% retracement).
• Bias: Medium-term bullish; short-term correction.
2️⃣ 1-Hour Chart (H1)
• Price broke minor structure at 4,336 and tapped the lower channel.
• Currently consolidating around 4,313, forming potential base support.
• 50EMA flattening; momentum slowing.
• Bias: Neutral to bearish short-term until 4,336 is reclaimed.
3️⃣ 15M–5M Chart
• MACD bearish, histogram red — short-term selling pressure.
• RSI rebounding from oversold (33) — early signs of intraday support reaction.
• Liquidity below 4,300 remains uncollected — could attract a final sweep before reversal.
⸻
📐 FIBONACCI ANALYSIS (Last Swing: 4,273 → 4,379)
Level Price Confluence
38.2% 4,336 EMA50 / previous structure
50.0% 4,326 Key mid-range
61.8% 4,318 Trendline & intraday liquidity
📊 Fibonacci Golden Zone → 4,318–4,336
This remains the key reaction zone for re-entry confirmation or next leg down if broken.
⸻
🎯 HIGH-PROBABILITY TRADE SCENARIOS
✅ BUY SETUP (Primary Bias – After Confirmation)
• Break & Retest: Above 4,336, confirming buyers reclaim control.
• Retest Zone: 4,330–4,336
• Targets:
• TP1 → 4,350
• TP2 → 4,363
• TP3 → 4,379
• Stop-Loss: Below 4,318
(Re-entry within Golden Zone only if we see bullish engulfing / strong volume candle.)
⸻
⚠️ SELL SETUP (Active Short-Term Bias)
• Break & Retest: Below 4,305, confirming downside continuation.
• Retest Zone: 4,305–4,313
• Targets:
• TP1 → 4,290
• TP2 → 4,273
• TP3 → 4,250
• Stop-Loss: Above 4,336
(This would confirm Golden Zone break and shift momentum bearish toward 4,273.)
⸻
🚀 BREAKOUT BUY (Aggressive)
• Trigger: Break & retest above 4,379 (previous high).
• Retest Zone: 4,372–4,379
• Targets: 4,395 → 4,410 → 4,428
• Stop-Loss: Below 4,355
⸻
🕐 FUNDAMENTAL WATCH
• DXY: Hovering around 104.90 — slight rebound causing gold weakness.
• Bond Yields: Stable; no risk-off catalyst for new gold strength yet.
• Upcoming US Data: Michigan Consumer Sentiment — could add volatility later.
• Institutional Flow: Still net-long on gold, suggesting corrections are accumulation phases.
⸻
⚙️ KEY TECHNICAL LEVELS
Type Levels
Resistance 4,336 / 4,363 / 4,379
Support 4,318 / 4,305 / 4,273
Trendline Support 4,305 (critical for maintaining bullish structure)
⸻
🧾 Analyst Summary
Gold remains bullish overall, but short-term momentum has shifted bearish following repeated rejections from 4,379.
Current retracement into 4,318–4,305 is a critical decision zone — if this holds, expect recovery toward 4,350–4,379.
However, a clean break below 4,305 confirms a deeper pullback toward 4,273–4,250 before the next major wave higher.
⸻
📈 Bias: Bullish above 4,318 – Watch for re-entry confirmation.
📉 Alternative Bias: Bearish below 4,305 – Short toward 4,273.

EURUSD Retest and Drop Bears Eye 1.14 ZoneEURUSD has broken down from its rising structure, with sellers now taking control after weeks of grinding price action. The failed retest of broken support turned resistance highlights that momentum has shifted, and the focus is shifting toward deeper downside targets. With the US dollar supported by sticky inflation risks and geopolitical tensions, the euro’s ability to recover looks limited in the near term.
Current Bias
Bearish – sellers are in control after the channel breakdown, with momentum favoring further downside.
Key Fundamental Drivers
US Dollar Strength: Sticky US services inflation and Fed hesitancy on aggressive cuts keep USD supported.
Eurozone Weakness: German and broader Eurozone data show sluggish growth, keeping ECB cautious.
Geopolitics: Tariff risks and global uncertainty favor the USD as a safe haven.
Macro Context
Interest Rate Expectations: Fed easing path is slowing, with sticky inflation potentially stalling rate cuts. ECB remains cautious with inflation still above target but growth faltering.
Economic Growth Trends: US data still resilient compared to stagnating Eurozone activity.
Commodity Flows: Higher energy costs remain a drag on the euro area’s trade balance.
Geopolitics: Trade tariffs and political tensions in the US and EU support the dollar’s defensive bid.
Primary Risk to the Trend
A dovish Fed surprise or significantly stronger Eurozone inflation data could weaken USD and trigger a corrective euro rebound.
Most Critical Upcoming News/Event
US CPI and Fed speakers will be critical for rate expectations.
Eurozone PMIs and German inflation data will guide the ECB outlook.
Leader/Lagger Dynamics
EURUSD often acts as a leader for broader USD moves, setting tone across USD majors. However, it currently behaves more like a lagger to Fed policy and US inflation dynamics, following rather than driving.
Key Levels
Support Levels:
1.1540 (near-term support)
1.1410–1.1400 (major downside target)
Resistance Levels:
1.1695 (broken support turned resistance)
1.1800 (upper rejection zone if retrace extends)
Stop Loss (SL): 1.1799
Take Profit (TP): 1.1400
Summary: Bias and Watchpoints
EURUSD bias is firmly bearish after breaking below its rising channel and rejecting resistance on the retest. With USD strength underpinned by sticky inflation risks and geopolitical tensions, sellers will likely remain in control unless the Fed pivots more dovishly. The key levels to watch are resistance at 1.1695 and 1.1800, with downside targets at 1.1540 and 1.1400. My trade plan favors short setups with SL around 1.1799 and TP at 1.1400, aligning technical breakdown with fundamentals. Unless Eurozone data surprises to the upside or the Fed softens tone, momentum stays with the bears.

BTCI’ll be convinced the bearish setup on CRYPTOCAP:BTC is invalidated once we’re trading above $113K. That’s the key level confirming strength and signaling the next leg of the bull cycle.

ETH Bearish for Now: Watch the Yellow Zone CloselyKey zones for Ethereum have been identified, but the highlighted yellow zone holds greater importance and stronger liquidity attraction. For now, ETH remains bearish — let’s see how it reacts to these levels

Cybertech - long term investment idea - latest update Cybertech - long term investment idea - latest update. More details on the chart.

Prestige Ready for the Next RallyPrestige Estates Projects Ltd is one of India’s most diversified real estate developers with a strong footprint across residential, commercial, retail, and hospitality segments. The company continues to benefit from robust housing demand and consistent project execution.
Reported record sales of ₹18,144 Cr in the first half of FY26 — already surpassing FY25 full-year performance.
Strategic partnerships with ADIA and Kotak AIF have strengthened liquidity and expanded development capabilities.
Growing urban housing demand continues to support both sales and pricing momentum.
While the company’s growth is strong, valuations remain premium and debt levels are on the higher side. Profit margins (6–9%) and return ratios (ROE/ROCE of 4–8%) show stability but leave room for improvement.
Key takeaways:
Strong revenue growth and diversified portfolio.
Moderate profitability with rising operational efficiency.
Elevated debt levels but supported by consistent project inflows.
High valuation, indicating strong market expectations.
Minimal dividend payout as profits are reinvested for expansion.
Overall, Prestige remains a growth-driven real estate leader, but it requires sustained execution to justify current valuations.
Technical Analysis
Pattern: Double Bottom Breakout
The chart shows a clear double bottom formation between August and October 2025, signaling a potential trend reversal after a prolonged consolidation phase. The breakout above the neckline around ₹1,690 – ₹1,700 confirms bullish momentum.
Strong volume confirmation during breakout supports continuation.
A pullback toward ₹1,553 – ₹1,589 could act as an ideal retest zone.
Upside targets are placed at ₹1,755, ₹1,920, and ₹2,085.
Sustaining above ₹1,700 will keep the bullish momentum intact.
Breakdown below ₹1,550 will negate the bullish structure.
Summary View
The stock has shifted into a bullish phase both technically and sentimentally. Fundamentals show consistent performance, while the breakout pattern supports upside potential in the short to medium term.
Trend: Bullish breakout above neckline
Momentum: Positive
Fundamentals: Improving with strong sales momentum
Ideal Entry Zone: ₹1,550 – ₹1,590 (retest area)
Targets: ₹1,755 / ₹1,920 / ₹2,085
Risk Zone: Below ₹1,550
Conclusion
Prestige Estates Projects Ltd demonstrates a solid blend of fundamental strength and technical confirmation. The recent double bottom breakout suggests renewed investor interest and potential for further upside. However, given the premium valuation and sector cyclicality, accumulating on dips near ₹1,580–₹1,600 may offer a better risk–reward opportunity for positional traders and investors.
If momentum sustains above ₹1,700, the stock could head toward the ₹1,920–₹2,085 zone in the coming weeks.
Disclaimer: tinyurl.com

Trading balanceThe price of the asset has rebounded from the balance zone. With the prospect of growth into the resistance zone.

XAUUSD – Strong Uptrend Holding Firm, Eyes on 4350–4400XAUUSD – Strong Uptrend Holding Firm, Eyes on 4350–4400 Breakout Zone
Gold continues its aggressive bullish structure, forming consecutive higher lows and respecting the dynamic trendline support (pink). The price has recently retested the trendline near 4340–4350, showing early signs of consolidation before a possible continuation toward new highs.
Key Technical Outlook
Support Zones:
4315–4325 (short-term intraday demand)
4250–4270 (previous structure base & 0.382 Fibonacci area)
Resistance Zones:
4375–4400 (psychological round number + trendline top)
4430–4450 (potential extension target if breakout confirms)
Indicator & Price Behavior
The EMA structure remains aligned in bullish sequence with no crossover signals of weakness. RSI stays above 60, indicating healthy momentum though slightly overbought—suggesting a minor pullback could provide better long entries.
Trading Strategy
Primary Plan (Buy-the-Dip):
Wait for a retracement toward 4320–4330, combine with bullish confirmation (RSI bounce or candle rejection) → Target 4380–4400.
Stop-loss: below 4300 (structure invalidation zone).
Alternative Plan (Breakout):
If gold breaks and closes above 4400 with strong volume → follow breakout momentum toward 4435–4450.
Overall, the trend remains strongly bullish. Any dips to trendline or Fibonacci zones continue to offer favorable long opportunities.
Follow for more daily gold strategies and technical insights to refine your trading entries.
