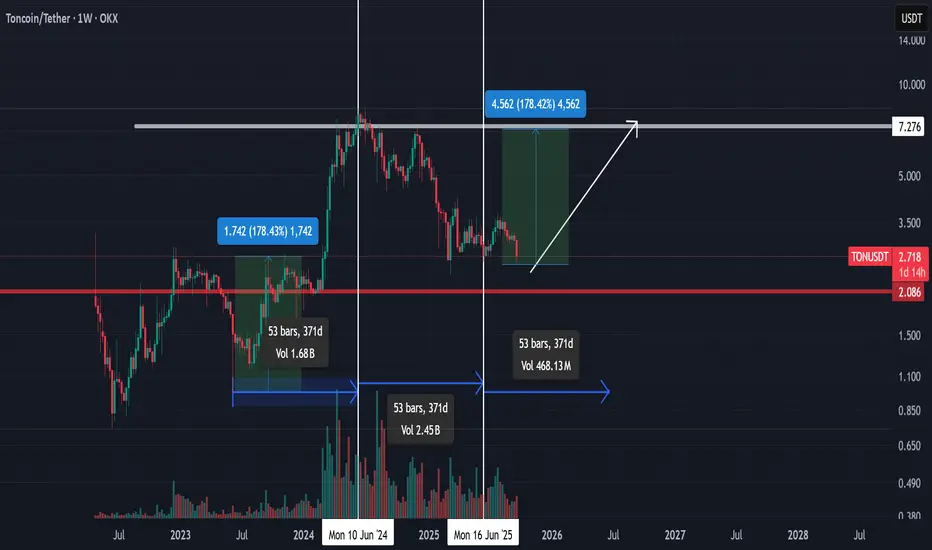
Possible setup for TON to retest 7$Currently, we are seeing a very exhausted multi-month downtrend. Just like in 2023, it’s very possible that with some sort of positive news injection, TON could start a big explosive move to the upside.
Technically, it’s forming a triple-bottom formation and a higher low on the weekly chart. The TON/BTC chart is also showing a potential double bottom.
In my opinion, money will start flowing from XRP, SOL, ETH, and BTC into coins like this over the next few months.
The plan is simple: I’ll buy a 30% spot position here and DCA every 10% drop until $2. Below $2, I’ll double my longs and go 2x. (I highly doubt it breaks under $2.5, but it’s better to play safe than sorry.)
Trend Analysis
TradeCityPro | Bitcoin Daily Analysis #194👋 Welcome to TradeCity Pro!
Let’s analyze Bitcoin today, the market has calmed down a bit, and we can perform some analysis.
⏳ 1-Hour Timeframe
In the 1-hour timeframe, Bitcoin has reached a support level around $109,000 and has shown a reaction to this level.
⭐ After the heavy drop that occurred two days ago, the open interest and market volume have decreased significantly, which clearly indicates that market participants are currently indecisive.
✨ Yesterday, the price reacted to the support zone on Bitcoin, and a significant resistance was created around $112,420, which it has now reached again.
💥 The RSI oscillator has finally moved out of the Oversell zone, and it’s currently below the 50 level.
🧮 Although there’s still fear and a bearish momentum in the market, breaking the $112,420 resistance could be a very risky long trigger.
✔️ Personally, I’m waiting and observing. However, for those who like to open positions every day, breaking this resistance is the only long trigger I can provide.
💡 For a short position, we could enter after the price breaks below the level. I’m passing on this position for now and will wait for a confirmation to search for a short trigger after the price stabilizes below this zone.
❌ Disclaimer ❌
Trading futures is highly risky and dangerous. If you're not an expert, these triggers may not be suitable for you. You should first learn risk and capital management. You can also use the educational content from this channel.
Finally, these triggers reflect my personal opinions on price action, and the market may move completely against this analysis. So, do your own research before opening any position.

Dax..Oversold not been unwound as yetGpt oversold on Friday.Deviation from the trend.Recoiling to maybe test the trend

How to find algorithmic levels of support and resistanceUsing repeating pinpoint levels to form meaning of opens and closes around these levels give you an advantage in your analysis.
As price gives us clues to what levels are affecting price, we should mark the new candles that are responding to these levels by breaking and retesting these very levels.
Please let me know your thoughts! 🙏🏾

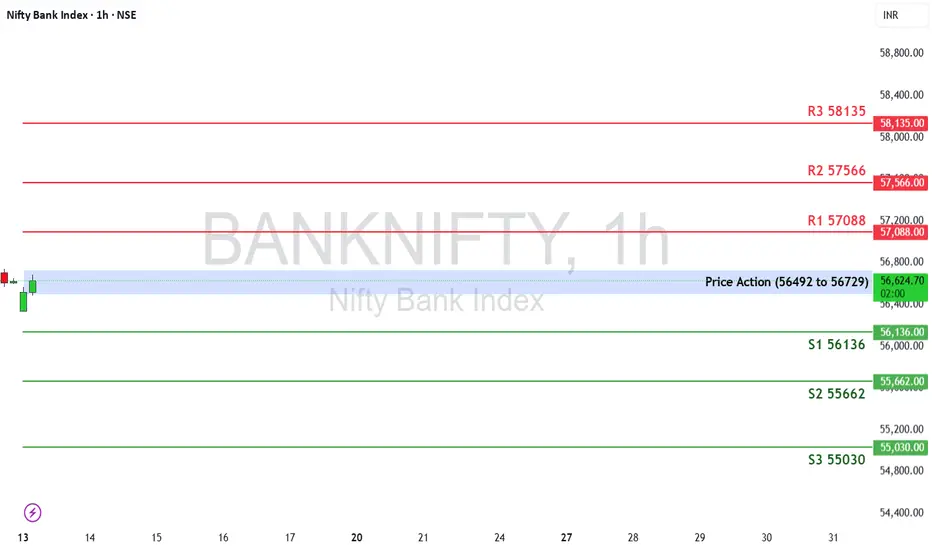
Banknifty Weekly Outlook (13th Oct – 17th Oct 2025)The Bank Nifty ended the week at 56,609.75, gaining +1.84%
🔹 Price Action Pivot Zone:
56,492 – 56,729
This is the crucial price band to watch. A breakout or breakdown from this blue-shaded zone could define this week’s directional bias.
🔻 Support Levels:
S1: 56,136
S2: 55,662
S3: 55,030
🔺 Resistance Levels:
R1: 57,088
R2: 57,566
R3: 58,135
📈 Market Outlook
✅ Bullish Scenario:
If Bank Nifty sustains above the pivot high of 56,729, buyers could push the index toward R1 (57,088). A breakout above this zone may open the path to R2 (57,566) and R3 (58,135).
❌ Bearish Scenario:
A breakdown below the pivot low of 56,492 could trigger profit booking. The index may then retest S1 (56,136), with further weakness extending toward S2 (55,662) and S3 (55,030).
Disclaimer: tinyurl.com
Dont get trapped chasing the Opening gap Bitcoin Hello and Welcome
Here I present to you a quick theory on the Bitcoin CME open in the event we gap down and open in the 112K range.
This idea is just something to consider in the week ahead, with many traders destroyed as a result of Fridays crash and emotions running high going into the week ahead I encourage you to take a listen to this potential scenario for the week ahead on BTC.

SYM PROBABLY IN WAVE " C " - SHORTThis is in continuation to our ongoing tracking of SYM wave structure.
If our wave count is correct then the wave 2 or B has completed and wave C has started which will take prices below 11.52 level but price will have to go below 14.64 level to bring confidence to this wave count.
Alternately, we might still be in wave B which will take price above the 17 level.
I basically don't rely on chart patterns, however if this is a failed triangle breakout then fall that follows are usually sharp and fast.
Trade Setup:
Entry level: 14.63 (50%) & 14 (50%)
Stop loss: last swing high
Target: 12.78
Let see how this plays, Good Luck!
Disclaimer: The information presented in this wave analysis is intended solely for educational and informational purposes. It does not constitute financial or trading advice, nor should it be interpreted as a recommendation to buy or sell any securities.

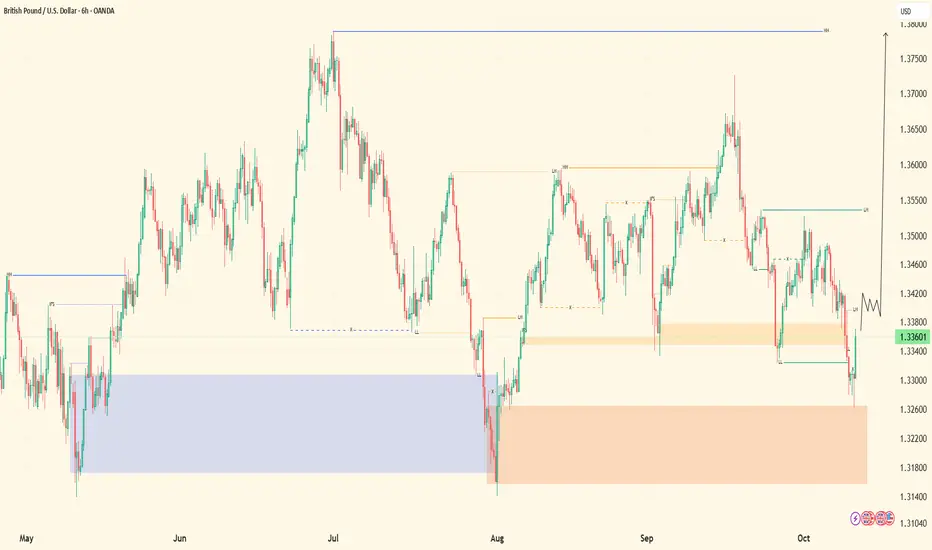
GBPUSD 4H📉 Technical Analysis – 4H Timeframe
The overall trend remains bearish. After a corrective move, the price is currently completing a pullback into its Fibonacci retracement zone.
If bearish confirmation candles (such as a pin bar or engulfing pattern) appear around this level, we could expect the downtrend to resume.
🎯 This area may provide a potential sell setup, once price action confirms the rejection.
Always apply proper risk management and wait for confirmation on lower timeframes before entering any position.

TSLA Breakdown or Bear Trap? Oct. 13TSLA Breakdown or Bear Trap? Watch This Zone Before the Next Big Move
Tesla just had one of its hardest sessions in weeks — dropping over 5% on Friday and closing near $408, right on the edge of a major technical breakdown.
But here’s the thing: while the chart looks heavy, there are signs that sellers might be losing steam. Let’s unpack what’s happening from both the 15-minute price action and the 1-hour options (GEX) landscape so you know what to expect when the market opens Monday.
15-Minute Intraday Technical View
Friday’s price action was pure capitulation. After losing $430, Tesla slid straight down the channel and found temporary footing near $405–$408.
The 15-minute chart shows a clean descending structure with a trendline connecting lower highs — every bounce so far has been rejected.
But now, for the first time in two days, the MACD histogram is turning light blue, and Stoch RSI is curling up from deep oversold territory near 20. That means momentum is trying to flip, even if price hasn’t confirmed it yet.
The immediate level to watch at Monday’s open is $410–$415. If Tesla reclaims that area with strength, it could start an intraday reversal move toward $420–$425, where the breakdown started.
However, if it rejects there and breaks below $405, the next support isn’t until $395–$390, and that’s where the next flush could hit fast — especially if VIX spikes above 22 again.
The key is to watch volume and confirmation. A weak bounce without strong participation likely fails, but a reclaim above $415 with rising volume could catch shorts off guard and trigger a fast squeeze.
1-Hour GEX Analysis — Options Sentiment
The 1-hour GEX chart paints the bigger picture: this entire drop was dealer-driven.
The HVL (Highest Volatility Line) sits near $417–$420, which means that’s the line separating calm from chaos. Staying below it keeps TSLA in negative gamma territory — where every move feeds volatility instead of containing it.
Below the current price, there’s a massive Put Wall sitting around $395–$390, marking the highest negative GEX zone. That’s the “danger zone” where market makers start shorting more to hedge, which can accelerate a drop.
Above that, there’s heavy Call Resistance stacked around $445–$450, so even if Tesla bounces, it’ll hit resistance hard once it gets near $440+.
IVR sits around 29.4 with IVX at 70, showing that implied volatility is still very high. That means options are expensive — traders are paying up for protection, not confidence.
Right now, GEX positioning suggests Tesla’s price is trapped between $405 and $425, waiting for direction. If price holds and climbs above $420, gamma flips neutral and a short-term rally could unfold fast.
My Thoughts and Trade Ideas
Tesla is stuck in a volatility choke zone — but it’s not dead.
The 15-minute chart shows potential momentum reversal, while the 1-hour GEX confirms that option flows are balanced on a knife’s edge. Bulls need to push above $420 to break the cycle of dealer hedging and start a relief wave toward $430–$440.
If you’re scalping, watch for:
* Long setup above $415–$418 with volume confirmation — target $425–$430.
* Short setup if it fails $410 or breaks $405 — target $395, then $390.
For option traders, the 420C or 425C strike could work for a short-dated bounce play if volatility cools. But if fear continues, the 400P or 390P offers a safer directional hedge.
The real pivot for Tesla isn’t price — it’s sentiment. Once VIX calms below 20 and liquidity returns, Tesla usually leads the rebound. Until then, this remains a day trader’s battlefield.
Final Take
Tesla is coiled inside a descending channel but showing early divergence. Monday will determine if this is just another leg down or the first real reversal from oversold territory.
Above $420 = short-covering bounce.
Below $405 = more pain ahead.
Volatility will decide who wins.
Disclaimer: This analysis is for educational purposes only and not financial advice. Always trade your own plan and manage your risk carefully.

GBPUSD| Structure in Sync with Smart Money FlowPair: GBPUSD
Bias: Bullish
HTF Overview:
Price continues to display strength, breaking through significant highs and sustaining bullish momentum. We’ve recently tapped into a major high timeframe order block — a key zone where smart money tends to position continuation legs.
MTF Insight:
From that HTF OB, we witnessed a clear change of character (CH) followed by a break of meaningful highs. Price has since retraced into discounted territory, mitigating lower OBs that align with the internal structure and continuation narrative.
LTF Confirmation:
A fresh lower timeframe CH is developing. Once that CH is confirmed and order flow aligns, I’ll be anticipating a clean pullback entry within the bullish leg for continuation toward higher liquidity zones.
Entry Zone:
Discounted OBs within the current structure range — awaiting refined 5M confirmation for execution.
Targets:
Liquidity above recent swing highs.
Mindset Note:
Patience is key here. Let structure finalize the CH and confirm alignment across timeframes before pressing the buy trigger. Smart money rewards timing, not haste.
NASDAQ 100 – Technical Breakdown Meets Fundamental RealityAfter months of relentless buying, the tech sector’s engine is finally sputtering.
The recent sharp drop from the highs wasn’t random — it reflects growing macro tension and liquidity tightening that’s starting to bite risk assets.
🧩 The Fundamental Story
Yields & Liquidity:
Long-term Treasury yields remain stubbornly elevated despite the Fed’s cautious tone. This indicates the market is pricing in structural inflation rather than trusting the “soft landing” narrative. Higher yields mean tighter financial conditions — bad news for richly valued growth stocks.
Earnings Fatigue:
Recent earnings season showed early cracks: slowing cloud growth, cautious forward guidance, and shrinking profit margins. Even AI-related optimism can’t offset the broader deceleration.
China & Trade Risks:
Renewed U.S.–China trade friction and export restrictions on high-end chips are dampening sentiment in the semiconductor and tech hardware sectors — key NASDAQ components.
Fed Policy Uncertainty:
With inflation sticky above 3% and unemployment starting to rise, the Fed is cornered. A rate cut could come late — but only after more market pain.
📊 Technical Outlook (4H Chart)
The chart structure shows a clear break of the bullish sequence.
Support lost at 24,580 triggered heavy volume selling.
Current price is consolidating near 24,000 — the make-or-break zone.
Below 23,650, momentum sellers could accelerate the drop toward 23,000–23,050 (next key demand).
Any short-term bounce into 24,460–24,580 may act as a retest before another leg lower.
🎯 Trading Plan
Bias: Bearish below 24,460
Possible retest zone: 24,260–24,580
Main target: 23,050
Invalidation: Close above 24,880 with renewed bullish momentum
⚠️ Why It Matters
This isn’t just a pullback — it’s a repricing of risk driven by real-world fundamentals:
tightening liquidity, weak earnings, and policy uncertainty.
If the macro backdrop doesn’t shift fast, the NASDAQ could unwind a significant portion of its 2025 gains before year-end.
💬 Discussion
Do you think the Fed will pivot soon enough to save tech stocks from a deeper correction?
Or are we entering a new phase of the cycle where fundamentals finally catch up with price?
👇 Share your thoughts below and follow for more macro + technical insights every week.

Bitcoin may Rally Back Towards the 118000 ResistanceHello traders, I want share with you my opinion about Bitcoin. The market for Bitcoin has experienced extreme volatility recently, with a powerful rally to a new all-time high near 126000 being completely erased by a sharp, news-driven decline down to 101000. This dramatic price swing has reset the market structure. Since that low, however, the price of BTC has staged a significant recovery, breaking back above the major 109500 support level and showing strong signs of a bullish reversal. Currently, the asset is in a minor corrective phase after this initial powerful rebound. In my mind, the strong reversal from the lows indicates that the sell-off was overdone and buyers are now re-engaging. I expect that the price will make a small corrective movement down to retest the major support level around 109500. I think a successful defense of this level, which also aligns with the buyer zone, will confirm the recovery is sustainable and will trigger the next major rally. Therefore, I have placed my TP at the 118000 resistance level, targeting the top of the prior consolidation range. Please share this idea with your friends and click Boost 🚀
Disclaimer: As part of ThinkMarkets’ Influencer Program, I am sponsored to share and publish their charts in my analysis.

PLTR at a Critical Pivot. Oct. 13PLTR at a Critical Pivot: Will Smart Money Step In or Let It Slide?
Palantir got hit hard on Friday — down over 5%, closing near $175, as fear washed through the entire market. The stock followed the same downward rhythm as NVDA and TSLA, breaking below key trend levels before catching a late-session bounce. But the question now is: is this just a dead-cat move or a sign of smart money starting to accumulate?
Let’s break it down from both the 15-minute intraday structure and the 1-hour GEX setup, which gives us a real sense of how volatility and positioning could drive Monday’s move.
15-Minute Intraday Technical View
Friday’s chart shows a clean descending trendline, and PLTR is still trading beneath it. Each rally attempt last week was met with sharp rejection near the 179–180 zone, which now acts as the first ceiling to watch at the open.
That said, we’re seeing subtle but important signs of exhaustion in the selloff:
* MACD is flipping from deep red toward light blue bars — momentum is slowing.
* Stoch RSI has turned up from oversold territory, hovering around 30–40, suggesting short-term bullish potential.
The immediate support zone sits between 172 and 169. Buyers defended that range late Friday, forming a small higher low structure on the lower timeframe.
If PLTR holds this area and breaks above 177–179, it could trigger a quick relief run back toward 184–186, where heavy resistance sits along the upper channel.
But if PLTR fails to stay above 172, we could see another leg down toward 165, where the next support cluster lies — and possibly deeper toward 150 if the broader market remains under pressure.
Intraday traders should keep it simple:
* Above 179 → look for scalp longs toward 184–186.
* Below 172 → shorts open up back to 165–167.
This is a reactive, not predictive, setup day — let the price show strength before trusting a bounce.
1-Hour GEX Analysis — Options Sentiment
The options market is lining up tightly with the chart levels. The HVL (Highest Volatility Line) sits right around 177.5, which is almost exactly where PLTR stalled at the close. That level acts as a near-term pivot — reclaim it, and the pressure starts to ease; lose it, and volatility spikes again.
Above current price, there’s a clear cluster of Call Walls around 185, 190, and 195, meaning that’s where dealer resistance will kick in. These levels act as “gravity caps” for the stock unless implied volatility drops.
Below, we’ve got Put Walls stacked around 165 and 150, showing heavy downside hedging. The options flow still leans defensive with CALLS at 23.9%, confirming that traders remain cautious going into Monday.
IVR sits around 46.8, while IVX sits at 72.4 — both high but cooling slightly. This suggests volatility expansion may have peaked, leaving room for short-term relief moves if the market finds its footing.
From a GEX standpoint, PLTR is in negative gamma territory below 177, meaning dealers are selling into weakness. If the stock reclaims 180 and holds, gamma turns neutral, which could spark a quick momentum squeeze.
My Thoughts and Trade Ideas
PLTR is sitting right at the intersection of fear and opportunity. The downside momentum looks tired, and both MACD and Stoch RSI are hinting that sellers may be running out of fuel.
Still, this is a name that moves fast both ways — and Monday’s VIX behavior will decide the direction.
If volatility cools off early, PLTR could be one of the first tech names to bounce.
* For day traders, long above 178–180 with targets at 184–186, stops below 172.
* For option traders, consider 180C or 185C for a short-dated pop if SPY holds up.
* If the market opens weak and PLTR breaks 172, switch to 170P or 165P and let it ride — momentum will accelerate quickly in that scenario.
My bias: cautious bullish as long as PLTR stays above 172, bearish only if that floor breaks cleanly.
Final Take
PLTR is at a crossroads. The technicals suggest a possible intraday bounce, but the 1-hour GEX map shows strong overhead resistance.
It’s all about control — if buyers can reclaim 180, we could see a short-covering push into the 185–186 zone.
If not, it’s another trip down the ladder toward 165.
This week will separate patience from panic.
Disclaimer: This analysis is for educational purposes only and not financial advice. Always trade responsibly and follow your own plan.

SPX | Daily Analysis #1Lets take a look at OANDA:SPX500USD at start of the Monday and being ready for the week.
Last Week:
well, as you may know last week was a struggle and flashy crashy market for all and at least about 80% of indexes was turning red in Friday amid US and China trade war escalation.
Start Of the Week:
Personally I think the market will open with huge gap in down side and flame the Fear factor for the start of Monday.
Horizon:
Well, during 2018-2019 trade war showed us that this romance not gonna end soon and this story will continue at least 3-6 months. And if any tension rises, the markets will shot again.
4H Time Frame:
As you can see, the index passed trough the latest Demand zone and heading to Supply zone. this area may good for some buyers to take action for catching or creating correction for Friday's move. if this will happen the price would go in $6580 area. and make some range towards 1st of November.
✔️ Personally, I’m waiting and observing for market re-action for THIS first day of market.

GOLD MONTHLY CHART LONG TERM/RANGE ROUTE MAPHey Everyone,
We’ve just released our new Monthly Chart idea, which we’ll now be tracking following the successful completion of our previous long term monthly chart idea. That one played out beautifully, and now it’s time to shift focus to the next big setup.
Currently, price is trading above the channel midline, and we’ve also seen an important EMA5 cross and lock above 3099, with a candle body close confirming a long term gap above at 3557.
While this confirms the bullish long term structure, we’re also mindful of the potential for a short term retracement, particularly around the EMA5 detachment zone (highlighted with a circle on the chart). This would offer a healthy dip opportunity, aligning perfectly with our strategy to buy into weakness on the way up.
For the bigger structure to remain intact, we’ll be looking for 3099 to continue holding as key structural support. As long as that level is respected, the long term gap toward 3557 remains firmly in play.
This is a higher timeframe idea that we’ll be building on as structure continues to unfold.
We will continue to use all support structures, across all our multi time frame chart ideas to buy dips also keeping in mind our long term gaps above. Short term we may look bearish but looking at the monthly chart allows us to see the bigger picture and the overall long term Bullish trend.
As always, we will keep you all updated with regular updates throughout the week and how we manage the active ideas and setups. Thank you all for your likes, comments and follows, we really appreciate it!
Mr Gold
GoldViewFX

goldPersonally, I have two scenarios in which both give me a bullish pattern. In this one, I have a corrective pattern a-b-c that has already culminated, giving me a wave 1-2 looking for the fibo zone of 161.8, 200, 261.8

ETH About To Hit a New All-Time High📈 The main structure of Ethereum is a corrective ABCDE pattern, where wave E has beautifully bounced from the 1.272 Fibonacci level. Today, the price has broken through and consolidated above the key $3,800 zone.
👉 I expect an upward trend for Eth toward a new all-time high (ATH).
🎯 Targets : 4600$, 5370$, 5900$

Dogecoin BullishThis one’s for the crypto enthusiasts 👇
Dogecoin recently reacted strongly at a key weekly market structure level, showing multiple signs of a bullish shift in momentum.
As we move into December, the broader sentiment appears to favor continued upside potential.
I’ll also be sharing my thoughts on Bitcoin, given the strong historical correlation between the two assets — worth keeping an eye on both.
What are your thoughts — do you see further continuation or a short-term retracement first?
#Pipmultiplier #Dogecoin #Crypto #Bitcoin #TradingView

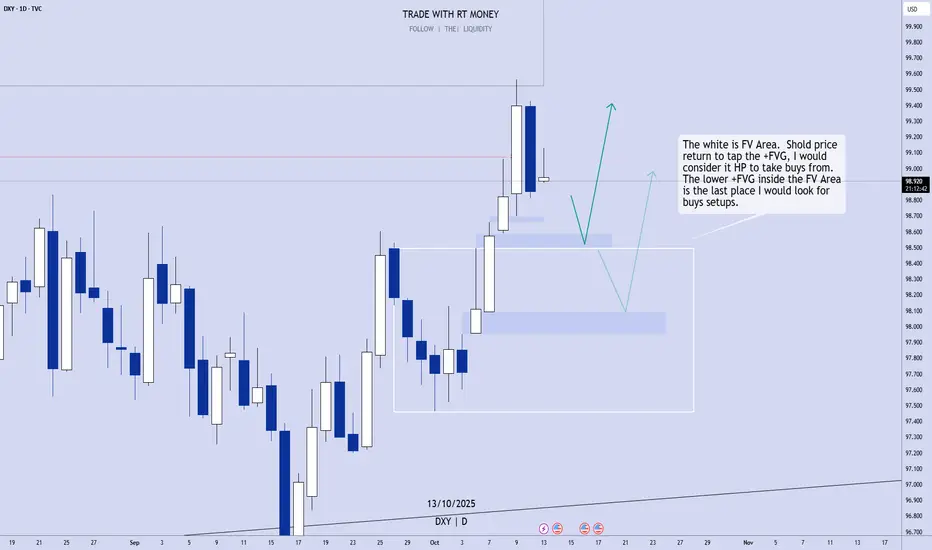
US Dollar: Still Bullish. Wait For Buy Setups!Friday's candle notwithstanding, the USD is strong, and still bullish. Taking sells into the bullish Fair Value Area is not a good option. Looking for buys at the _FVGs is!
Enjoy!
May profits be upon you.
Disclaimer:
I do not provide personal investment advice and I am not a qualified licensed investment advisor.
All information found here, including any ideas, opinions, views, predictions, forecasts, commentaries, suggestions, expressed or implied herein, are for informational, entertainment or educational purposes only and should not be construed as personal investment advice. While the information provided is believed to be accurate, it may include errors or inaccuracies.
I will not and cannot be held liable for any actions you take as a result of anything you read here.
Conduct your own due diligence, or consult a licensed financial advisor or broker before making any and all investment decisions. Any investments, trades, speculations, or decisions made on the basis of any information found on this channel, expressed or implied herein, are committed at your own risk, financial or otherwise.
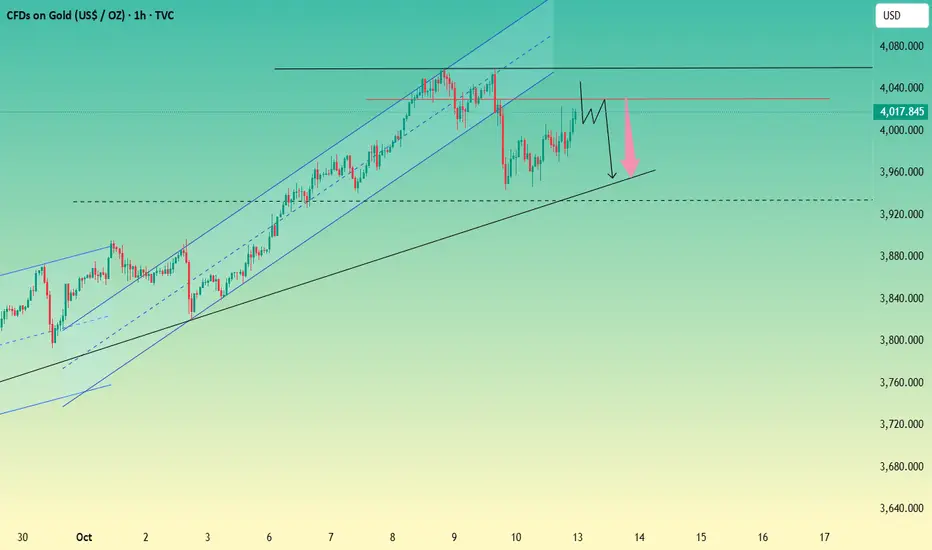
Elliott Wave Analysis – XAUUSD (13/10/2025)
________________________________________
🔹 1. Overview
In the previous plan, I predicted an upward correction after a panic sell-off, which was identified by an unusually extended blue wave C on H1.
________________________________________
🔹 2. Momentum
D1 Momentum is currently reversing downward, however, since price and momentum are diverging, the bullish pressure remains strong.
H4 Momentum has now entered the overbought zone, so within the next 1–2 H4 candles, a corrective decline may occur.
H1 Momentum is currently falling, while price is moving sideways, so we should continue observing this zone carefully.
________________________________________
🔹 3. Wave Structure
D1 Chart:
• Price is still within the yellow wave 5.
• Although D1 momentum is declining, the extended wave 5 structure suggests that once a correction begins, the first drop will likely be steep and deep.
• The divergence between D1 candles and D1 momentum only signals weakening bullish strength, not yet a confirmed reversal.
H4 Chart:
• Price is currently moving along the upper boundary of the channel.
• Earlier, a blue ABC structure completed, and now price is forming three consecutive peaks near the previous high.
• This setup hints at a WXY pattern, where wave Y may develop as either:
1️⃣ A Flat (5-wave) pattern, or
2️⃣ A Triangle.
H1 Chart:
• A blue ABC correction has been completed, followed by a rally back to the previous top.
• Price is now moving sideways around this zone.
• Given that the ABC correction is done, there are two possible outcomes:
o (1) The correction is complete, and price is now in a 5-wave impulsive rally, meaning further upside.
o (2) The correction is still developing, and price may continue to drop as described in the H4 scenarios.
________________________________________
🔹 4. Additional Notes
• The current wave structure shows significant overlap, and given the previous panic sell, this slow recovery makes sense — it likely represents a leading diagonal (wave 1 triangle).
• In such a case, once price breaks out of the channel, it should accelerate sharply into a strong wave 3.
• However, since price remains sideways, this scenario may instead represent wave X of a continuing correction.
⚠️ Important:
Unlike the Friday Buy setup, which had strong confluence, the current scenario presents two conflicting possibilities, so the probability is not high.
________________________________________
🔹 5. Trade Plan
Sell Setup (Short-Term):
• Sell Stop: 4040
• SL: 4058
• TP1: 4010
Risk Management:
If price rises strongly above, confirming wave 3 behavior, then cancel the Sell setup.
As mentioned, this signal has lower probability and a relatively wide stop, so it’s better to either observe or enter with a small position size.

NASDAQ 100 (NQ1!): Still Bullish! Wait For Valid Buys!Welcome back to the Weekly Forex Forecast for the week of Oct. 13 - 17th.
In this video, we will analyze the following FX market: NASDAQ (NQ1!) NAS100
The NASDAQ dumped last Friday with the Trump tariffs on China announcement. His latest tweet seems to have lowered the temperature on the tension. The markets have opened with a gap up.
The plan: look for valid buy setups, and stay with the overall trend. Avoid selling this market.
Simple.
Enjoy!
May profits be upon you.
Leave any questions or comments in the comment section.
I appreciate any feedback from my viewers!
Like and/or subscribe if you want more accurate analysis.
Thank you so much!
Disclaimer:
I do not provide personal investment advice and I am not a qualified licensed investment advisor.
All information found here, including any ideas, opinions, views, predictions, forecasts, commentaries, suggestions, expressed or implied herein, are for informational, entertainment or educational purposes only and should not be construed as personal investment advice. While the information provided is believed to be accurate, it may include errors or inaccuracies.
I will not and cannot be held liable for any actions you take as a result of anything you read here.
Conduct your own due diligence, or consult a licensed financial advisor or broker before making any and all investment decisions. Any investments, trades, speculations, or decisions made on the basis of any information found on this channel, expressed or implied herein, are committed at your own risk, financial or otherwise.

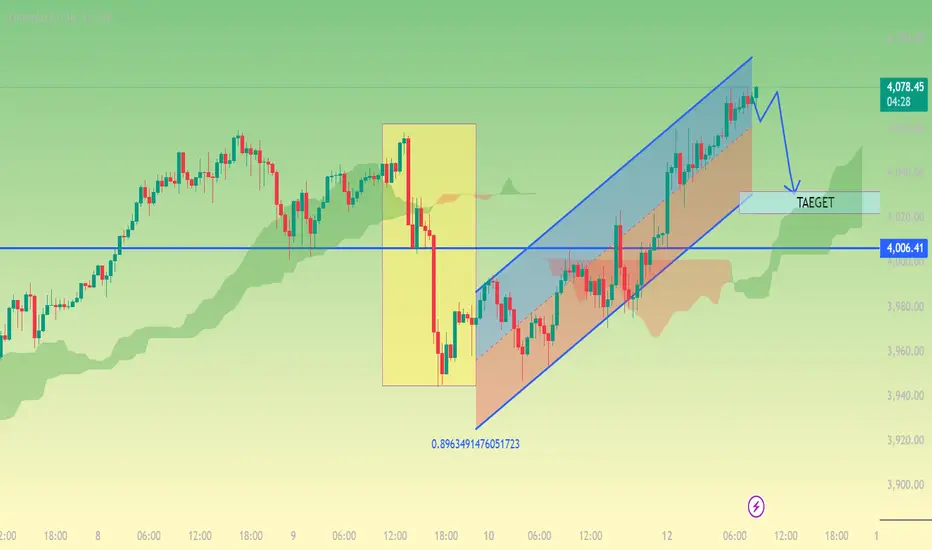
XAUUSD Technical Outlook: Correction Within Ascending ChannelPrice: around $4,077.2.
The price is moving inside an ascending channel, and it has just touched or slightly broken the upper resistance line.
A pullback from this resistance level is likely, as shown by the blue arrow on your chart.
The target (TAEGET) zone is highlighted between $4,020–$4,040, where price may correct before deciding next direction.
Major support lies around $4,006.41 (blue horizontal line).
📉 Possible Short-Term Scenario
Expect a pullback from the top of the channel toward the target zone (around 4,020).
If the correction deepens, price could test the 4,006 level, which aligns with previous horizontal support and Ichimoku cloud support.
A bullish rebound from 4,020–4,006 would confirm continuation of the uptrend.
However, a break below 4,006 would invalidate the short-term bullish structure and may trigger a deeper drop
Gold → Peak or correction? Market forecast for next weekLast Friday, we shorted gold at 3977 and 4000 points. Gold prices fell as low as 3946, and both of our short positions yielded profits. During the US trading session, gold prices rallied again, rising above 4000 points on the back of safe-haven sentiment.
Trade conflicts are volatile. Since Trump took office on January 20th of this year, the tariff issue has fluctuated between intense and easing. Now, the Sino-US tariff trade friction has escalated again, with Trump announcing an additional 100% tariff on Chinese goods effective November 1st. This was the main reason for last Friday's rebound.
The key lies in the Federal Reserve's October interest rate cut. While the probability of a 25 basis point cut is as high as 92.4%, the government shutdown has raised concerns that it may be delayed. Furthermore, the Fed minutes revealed that some officials, concerned about a rebound in inflation, oppose further rate cuts.
A brief ceasefire agreement between Israel and Hamas in the Middle East has eased geopolitical risks, raising concerns about boosting safe-haven demand. Gold prices have risen over 15% in the past two months. While a large number of profit-taking investors remain bullish on future gold prices, they are quick to flee at the slightest sign of trouble, especially during a rapid price drop.
Technically, after a relatively high daily and weekly close, there may be further upward momentum in the coming trading days. A new round of extreme gains followed by a sharp decline cannot be ruled out.
Resistance: 4030, 4058
Support: 4000, 3980
Trading Strategy:
Currently, the market is trading within the broad range of 3944-4058. The direction of the breakout will determine whether this is a correction or a peak. Shorting rallies within this range is the primary strategy. (Specific trading signals will be determined based on intraday trends.)
Next week, I will continue to share my personal trading signals. Wishing everyone gets what they hope for when the market opens tomorrow.
For specific trading decisions, please follow my live updates. I will update my trading ideas and strategies daily. If you don't have a plan or strategy for gold trading and are struggling to achieve consistent profits, you can refer to and follow my updates for guidance and help you avoid mistakes.