SCUSDT 1WSC ~ 1W Analysis
#SC This is the lowest support for now. Buy from here if you have a Conviction on this coin with a short -term target of at least 20%+.
Trend Analysis

30 min btc possible will be short analysis Btc will be short analysis previous last week go too down
Short Opportunity Ahead*: "BTC is showing signs of a potential short opportunity, with a possible drop to $72K-$77K due to a double top formation and broken support zone ¹."
- *Bearish Trend Continues*: "BTC's bearish trend continues, with a potential target of FWB:65K -$50K. The 50-week moving average suggests a further downturn ²."
- *Historical Trap*: "BTC is in the final stage of its bullish cycle, with a potential drop to $60K in 2026. The 1.618 FIB extension and long-term trendline suggest a short opportunity ²."
- *Distribution Phase*: "BTC is entering a distribution phase, with a potential drop to FWB:65K -$50K. The market structure is shifting bearish, and a short opportunity may arise ²

I'm Bullish, but... CHR / USDTEvening fellas,
My latest posts are bullish, and I did long some coins during the blood we had a couple of days ago.
But one must always be ready and I am seeing something interesting in a couple of coins, showing me that there's a hidden bearish scenario behind all the hype.
CHR is one of those coins, it's got good news, hype, etc, but I think MM'rs want to destroy some lives.
Keep an eye on it.
Trade thirsty, my friends!

Bitcoin and Elliott Wave Principles This is a good example showing how Bitcoin adheres to Elliott Wave Rules, as does everything in the Market. As stated other publications, the Elliott Wave Theory is more than just a Theory but how the market works. Bitcoin won't always buy, there will be ups and downs. Timing is key. If there is an over-investment just before the top of Wave B, ''Buy The Dip'', this would lead to unimaginable losses. This is what people call ''Stock Market Crash''. To Elliott Wave Theorists, this is a simple Wave 4.

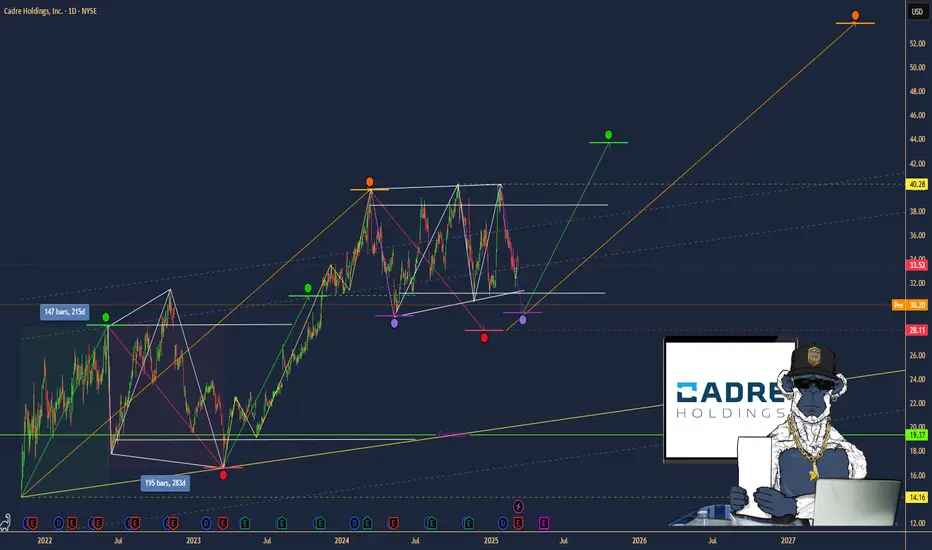
$CDRE: Cadre Holdings – Riding the Safety Wave?(1/9)
Good afternoon, everyone! 😊
NYSE:CDRE : Cadre Holdings – Riding the Safety Wave?
With CDRE at $30.20, is this stock a safe bet or a risky ride? Let's dive into the world of safety gear and see if Cadre's holdings hold up! 😎
(2/9) – PRICE PERFORMANCE
• Current Price: $30.20 as of March 12, 2025 😏
• Recent Moves: Down 11% from $34.02 a week ago 😬
• Sector Vibe: Safety equipment sector is growing, driven by stricter regulations and demand for safer workplaces. 📈
Short commentary: The stock's taken a hit, but the sector's looking good. Maybe it's just a temporary dip? 🤔
(3/9) – MARKET POSITION
• Market Cap: Approximately $1.23 billion 💰
• Operations: Manufacturing and distributing safety and survivability products for law enforcement, first responders, military, and now, the nuclear market. 🛡️
• Trend: Expanding into new markets with the acquisition of nuclear safety brands. 🚀
Short commentary: They're diversifying, which is usually a good sign. More markets mean more opportunities. 😉
(4/9) – KEY DEVELOPMENTS
• Acquisition of Carr's Engineering Limited's Engineering Division for nuclear safety solutions, announced on January 16, 2025. 📈
• Expected to close in the first half of 2025. ⌛
• Market Reaction: The stock has seen a recent dip, possibly reflecting integration concerns or broader market volatility. 😐
Short commentary: This should bring in new revenue streams and expand their international presence. Let's see how it plays out. 🌍
(5/9) – RISKS IN FOCUS
• Integration risks from the acquisition. ⚙️
• Supply chain disruptions. 🚚
• Regulatory changes in the nuclear sector. 📜
Short commentary: These are all things to keep an eye on, but every company has some risks. Stay vigilant! 🕵️
(6/9) – SWOT: STRENGTHS
• Strong reputation in safety equipment. 🏆
• Diverse product portfolio. 🌈
• Recent acquisition expanding into the nuclear market. 🌟
Short commentary: They're well-known and have a broad range of products, which is great. Keep up the good work! 👍
(7/9) – SWOT: WEAKNESSES & OPPORTUNITIES
• Weaknesses: Potential over-reliance on government contracts, integration challenges. ⚠️
• Opportunities: Growth in nuclear safety market, increasing global demand for safety products. 🌐
Short commentary: They need to manage their dependencies and make sure the acquisition goes smoothly, but there's a lot of potential for growth. Let's hope they nail it! 📈
(8/9) – CDRE at $30.20 – what's your call? 🗳️
• Bullish: Price could rise to $35+ soon, due to successful acquisition and sector growth. 🚀
• Neutral: Price remains steady, as the market digests the acquisition news. 😐
• Bearish: Price could drop to $25, due to integration risks and market volatility. 📉
Drop your pick below! 💬
(9/9) – FINAL TAKEAWAY
Cadre Holdings' $30.20 stance shows a robust portfolio and strategic expansion, but recent price dips and integration risks are concerns. Volatility’s our ally—dips are DCA treasure. Snag low, soar high!
Previous Day High/Low Reversal Strategy
Daily Range Identification: You establish the previous day's high and low as key levels.
Liquidity Sweep: You observe price action for a "liquidity run," where price breaks either the previous day's high or low, indicating potential stop-loss hunting.
Change of Character (ChoCh): Following the liquidity run, you look for a "change of character," signifying a shift in momentum and a potential reversal.
Fair Value Gap (FVG) Entry: You identify fair value gaps (price imbalances) to find precise entry points in the direction of the indicated reversal.
Target: Your profit target is the opposite extreme of the previous day's range (either the previous day's high or low).

$SPY (THIS IS BAD) Trading Levels for March 11 2025
Not the prettiest setup is you’re a bull. We are DANGLING - unsupported underneath the 200 Day Moving Average.
Next support - 540
Trade carefully, y'all.

ALTCOINS TO WATCH - INSANE VOLUME SPIKE! BIG MOVE LOADING?🚀 VICUSDT – INSANE VOLUME SPIKE! BIG MOVE LOADING? 🚀
“This is not just a volume increase. This is a 3,061% SPIKE. Smart money is moving—are you paying attention?”
🔥 Key Points:
✅ Massive Volume Surge – This isn’t retail noise. Someone BIG is making a move.
✅ Blue Boxes = Strong Support – But don’t just buy blindly!
✅ CDV & LTF Breakouts = Must-Have Confirmation – We only enter when the market tells us it’s ready.
💡 The Game Plan:
Watch lower time frame (LTF) breakouts for entry triggers.
If CDV confirms, we have a high-probability trade.
No confirmation? No trade. Simple.
“The market doesn’t wait. The best setups don’t last. Be early, be smart, and execute like a pro.” 🔥🔥🔥
I keep my charts clean and simple because I believe clarity leads to better decisions.
My approach is built on years of experience and a solid track record. I don’t claim to know it all, but I’m confident in my ability to spot high-probability setups.
If you would like to learn how to use the heatmap, cumulative volume delta and volume footprint techniques that I use below to determine very accurate demand regions, you can send me a private message. I help anyone who wants it completely free of charge.
I have a long list of my proven technique below:
🎯 ZENUSDT.P: Patience & Profitability | %230 Reaction from the Sniper Entry
🐶 DOGEUSDT.P: Next Move
🎨 RENDERUSDT.P: Opportunity of the Month
💎 ETHUSDT.P: Where to Retrace
🟢 BNBUSDT.P: Potential Surge
📊 BTC Dominance: Reaction Zone
🌊 WAVESUSDT.P: Demand Zone Potential
🟣 UNIUSDT.P: Long-Term Trade
🔵 XRPUSDT.P: Entry Zones
🔗 LINKUSDT.P: Follow The River
📈 BTCUSDT.P: Two Key Demand Zones
🟩 POLUSDT: Bullish Momentum
🌟 PENDLEUSDT.P: Where Opportunity Meets Precision
🔥 BTCUSDT.P: Liquidation of Highly Leveraged Longs
🌊 SOLUSDT.P: SOL's Dip - Your Opportunity
🐸 1000PEPEUSDT.P: Prime Bounce Zone Unlocked
🚀 ETHUSDT.P: Set to Explode - Don't Miss This Game Changer
🤖 IQUSDT: Smart Plan
⚡️ PONDUSDT: A Trade Not Taken Is Better Than a Losing One
💼 STMXUSDT: 2 Buying Areas
🐢 TURBOUSDT: Buy Zones and Buyer Presence
🌍 ICPUSDT.P: Massive Upside Potential | Check the Trade Update For Seeing Results
🟠 IDEXUSDT: Spot Buy Area | %26 Profit if You Trade with MSB
📌 USUALUSDT: Buyers Are Active + %70 Profit in Total
🌟 FORTHUSDT: Sniper Entry +%26 Reaction
🐳 QKCUSDT: Sniper Entry +%57 Reaction
📊 BTC.D: Retest of Key Area Highly Likely
I stopped adding to the list because it's kinda tiring to add 5-10 charts in every move but you can check my profile and see that it goes on..


GOLD GOLD ,came to 2924 and is doing exactly what we want to see in the market,london gold buyers need liquidity for sell and will not stop until they get that money.

EOS this should work out or im outA while ago i posted TA of EOS. It didnt work out, so sad. Crazy how something can look so good and then go so bad, But now we are here today, fresh and all. For now it looks like a triange wiche want to break to the upside. Let me know what you think!

GBPUSDthis is last week of first quarter so its go probably short side trade by tier 1 so i personally took sell trade

SELL ON BTC This is a new method i am trying , and the set up looks really good, Btc is close to its former high and in that zone btc has created another structure which is a double top, right now it has gotten to the neck and i'm expecting a rejection from there to the next swing low

DXY Will Go Lower From Resistance! Sell!
Take a look at our analysis for DXY.
Time Frame: 1h
Current Trend: Bearish
Sentiment: Overbought (based on 7-period RSI)
Forecast: Bearish
The market is testing a major horizontal structure 103.479.
Taking into consideration the structure & trend analysis, I believe that the market will reach 103.100 level soon.
P.S
Overbought describes a period of time where there has been a significant and consistent upward move in price over a period of time without much pullback.
Like and subscribe and comment my ideas if you enjoy them!

WTI Crude Oil Analysis: Is the Downtrend Still in Play?Welcome back, guys! 👋 I'm Skeptic , and today we’re diving into a quick analysis of WTI Crude Oil (WTI) . Let’s break it down.
📉 4-Hour Time Frame Analysis
In the 4-hour time frame, WTI has shown a very strong corrective move, and despite trying to hold the support zone PRZ, it even failed to maintain it, suggesting a potential downtrend. Now, we have an opportunity to focus more on our short setups, but we’ll need to manage the risk as well.
🔮 Short Setup
For short positions, a break below the 4-hour support at 65.183 would be a good trigger to enter a short position. Place the stop loss just above the broken PRZ, around 67.024 , and keep an eye on price action as a sharp movement down could follow. If the support breaks, we’re likely to see a continuation towards the next support level, so the move could be pretty sharp, but make sure your stop loss is tight to manage risk effectively.
💡 Long Setup
For the long setup, we’ll wait for a potential fake breakout below the support and then look for a return above 67.024 . If we break above the resistance at 67.639 , we’ll look for a possible long continuation. However, since the current trend is bearish, we’ll reduce our risk and wait for confirmation from the 4-hour or daily time frames before entering.
Let me know your thoughts and ideas on WTI! 💬 Drop any questions in the comments, and I’ll be happy to discuss them. Let’s grow together, not alone! 🔥

will this pattern complete?copied the purple pattern from xrp 2014 - 2017.5
do these patterns complete?
TESLATesla over all trend still down ,the stock might go one more lower low or previous low sweep ,then up move possible till 300 ( WAVE C.4)

VGXUSDT – Resistance in Play! Breakout Incoming?🚀 VGXUSDT – Resistance in Play! Breakout Incoming? 🚀
“This is a textbook setup—when resistance flips into support, that’s where the real move begins!”
🔥 Key Levels to Watch:
✅ VGX is testing resistance – A breakout could bring serious momentum.
✅ Blue Box = Key Breakout Zone – If price clears this area, we’re looking at a potential shift in structure.
✅ Retest is the Golden Entry – Smart traders wait for the perfect moment, and that’s the retest.
💡 The Plan:
Breakout Above Blue Box = Bullish Signal
Retest & CDV Confirmation = High-Probability Entry
No Breakout? No Trade! We Don’t Chase.
“Opportunities like this don’t wait—stay sharp, react fast, and position yourself like a pro!” 🚀🔥
I keep my charts clean and simple because I believe clarity leads to better decisions.
My approach is built on years of experience and a solid track record. I don’t claim to know it all, but I’m confident in my ability to spot high-probability setups.
If you would like to learn how to use the heatmap, cumulative volume delta and volume footprint techniques that I use below to determine very accurate demand regions, you can send me a private message. I help anyone who wants it completely free of charge.
I have a long list of my proven technique below:
🎯 ZENUSDT.P: Patience & Profitability | %230 Reaction from the Sniper Entry
🐶 DOGEUSDT.P: Next Move
🎨 RENDERUSDT.P: Opportunity of the Month
💎 ETHUSDT.P: Where to Retrace
🟢 BNBUSDT.P: Potential Surge
📊 BTC Dominance: Reaction Zone
🌊 WAVESUSDT.P: Demand Zone Potential
🟣 UNIUSDT.P: Long-Term Trade
🔵 XRPUSDT.P: Entry Zones
🔗 LINKUSDT.P: Follow The River
📈 BTCUSDT.P: Two Key Demand Zones
🟩 POLUSDT: Bullish Momentum
🌟 PENDLEUSDT.P: Where Opportunity Meets Precision
🔥 BTCUSDT.P: Liquidation of Highly Leveraged Longs
🌊 SOLUSDT.P: SOL's Dip - Your Opportunity
🐸 1000PEPEUSDT.P: Prime Bounce Zone Unlocked
🚀 ETHUSDT.P: Set to Explode - Don't Miss This Game Changer
🤖 IQUSDT: Smart Plan
⚡️ PONDUSDT: A Trade Not Taken Is Better Than a Losing One
💼 STMXUSDT: 2 Buying Areas
🐢 TURBOUSDT: Buy Zones and Buyer Presence
🌍 ICPUSDT.P: Massive Upside Potential | Check the Trade Update For Seeing Results
🟠 IDEXUSDT: Spot Buy Area | %26 Profit if You Trade with MSB
📌 USUALUSDT: Buyers Are Active + %70 Profit in Total
🌟 FORTHUSDT: Sniper Entry +%26 Reaction
🐳 QKCUSDT: Sniper Entry +%57 Reaction
📊 BTC.D: Retest of Key Area Highly Likely
I stopped adding to the list because it's kinda tiring to add 5-10 charts in every move but you can check my profile and see that it goes on..

S&P500 Rebound: Glimpses of Stability in the Midst of a StormBy Ion Jauregui, Analyst ActivTrades
The S&P500 index has surprised everyone by rebounding after a historic day of declines. The volatility experienced last Monday, driven by uncertainty over new tariff measures, has begun to subside, giving a glimpse of a possible equilibrium in the US markets. Yesterday was a real hell for investors. Fears were triggered by the confirmation of plans to double tariffs on steel and aluminum, with particular stringency for imports from Canada. This announcement, part of a strategy of trade tightening, generated a domino effect that sent the S&P500 sharply lower, highlighting the market's sensitivity to economic policy decisions. Europe's response to the tariffs was swift with a subsequent statement from the European Commission with “swift and proportionate” countermeasures to U.S. imports.
However, yesterday's subsequent session saw an unexpected response. Activity on Wall Street showed a moderation in the initial panic, and several traders took the opportunity to buy back assets on attractive technical terms. This rebound not only suggests that the plunge may have been an overreaction, but also reflects the resilience inherent in one of the world's most closely watched markets. The White House, for its part, tried to calm the mood, insisting that the sharp drop was a “one-off” and not representative of the strength of the U.S. economy. Meanwhile, Trump himself, through his statements, continues to set the tone in the debate on the transition to a new economic paradigm, where the implementation of tariffs is only one of the edges of a broader strategy.
Looking ahead, the focus is on how trade measures will evolve and whether market responses will be able to sustain in the face of possible further turbulence. The partial recovery of the S&P500 is certainly an indication that traders are willing to ride out the uncertainty as long as signs of consistent, stability-oriented economic policy materialize.
Technical analysis
Looking at the trend of the index, the fall since February 21 has been extended. With a very pronounced fall this week of -4.05% being the fall since the beginning of the month of -7.33% and -9.34% since the beginning of the fall. Yesterday's bounces could change the game of bearish dynamics of the index indicating a possible brake to this rampant fall generating the entry of buyers into the market. The strongest triple bell zone is located in the area of 4,953 points, a range that tried to consolidate after the beginning of the fall. The most plausible zone for price recovery in case of a bulls' advance in the market. If we look at a long-term perspective, the stock has bounced off the September 11, 2024 price level and could have closed a bullish gap. But before moving to the third long term bell we have another prior range at the 5,755 area where the current checkpoint is located. The mid-range crosses have not given any kind of trend reversal signal, so it is very likely that this week will see a retest of the 5,548 price. There is no “two without three”. If this price does not hold it is possible that the price could pull back to 5,491.29 points as first resistance and second resistance at 5,378.48 points. RSI indicates a point of slight oversold at 44.30% so this could happen during this week of high volatility.
In short, the recent rebound is an encouraging sign in a context of high volatility, although the question remains as to whether this recovery will be sustained or simply a momentary respite in the midst of a still uncertain outlook.In the short term, the first year of the Republican administration looks highly volatile for the markets.
*******************************************************************************************
The information provided does not constitute investment research. The material has not been prepared in accordance with the legal requirements designed to promote the independence of investment research and such should be considered a marketing communication.
All information has been prepared by ActivTrades ("AT"). The information does not contain a record of AT's prices, or an offer of or solicitation for a transaction in any financial instrument. No representation or warranty is given as to the accuracy or completeness of this information.
Any material provided does not have regard to the specific investment objective and financial situation of any person who may receive it. Past performance is not reliable indicator of future performance. AT provides an execution-only service. Consequently, any person acing on the information provided does so at their own risk.

Lingrid | TRXUSDT Remains in a CONSOLIDATION PhaseAfter the recent sell-off, BINANCE:TRXUSDT market has been moving sideways within a downward channel. The price is consolidating below the key level of 0.25. Zooming out, we can observe that the price is forming a triangle pattern. I believe there is a possibility of a fake breakout at the channel boundary and resistance zone, which would likely lead to continued sideways movement. If a false breakout occurs at the resistance zone, I expect the price may move to lower levels, especially since this area coincides with the previous week’s highs from the last two weeks. My goal is support zone around 0.2250
Traders, if you liked this idea or if you have your own opinion about it, write in the comments. I will be glad 👩💻

USDZAR-SELL strategy 4-hourly chart Line break (2) GANN SQThe pair has positive line break bar, but we are negative on SMI, and MACD has selling pressure embedded into it.
Strategy SELL current @ 18.3250-18.3500 and take profit near 18.1875 for now. SL should be tight.

USOIL: Will oil prices continue to fall? Can I buy it?Dear trader friends, are you still curious whether you can buy USOIL or continue to short USOIL? Listen to Jack's opinion.
USOIL: At present, oil prices have rebounded slightly under the situation that the United States has restricted Iraq's oil exports. The current price is 66.7. At present, the New York market has not opened. It is expected that after the opening of the market, the oil price will further increase. The demand for oil in the market has increased, and the supply is insufficient. Therefore, it is expected that oil prices will rise in the short term. So it is my idea to go long on USOIL now.
Buy at 66-66.5. tp67.5-68. sl65.5
Personal thoughts, for reference only. If you follow my signals or refer to my suggestions, remember to pay attention to the real-time notifications within the analysis circle. Convenient for subsequent operations or closing positions.

TRX - asset Punchingasset Punching a slant on a third touchdown.
the target after the breakthrough is the minimum (marked with a blue unit).
I suspect that bad news about this asset is coming.
if you like the idea, please "Like" it. This is the best "Thanks!" for the author 😊 P.S. Always do your own analysis before a trade. Put a stop loss. Fix profits in installments. Withdraw profits in fiat and please yourself and your friends.
