btc fibonacci levels btc has fallen down we need to hold 81677 level if does not hold red candle close short take profits at 80415 look for a bounce off the level heavy resistance 83548 if we hold clean close above green candle buy 82171
Trend Analysis

USDT at the critical resistancethe USDT dominance is at a very important & multi resistance area.
it does have trendline resistance & 61% of Fibonacci retracement , and looks like we have a bearish divergence on weekly RSI for it as well.
with a weekly candle rejection we might see a rally for cryptos IMO.

Auction Looking Good To Short There's Good Horizontal ResistanceThere's Horizontal Resistance And Trendline Resistance At 1D It's Pumped A Lot Now it's time to take correction but don't completely rely fully on last tp you can book profits in parts

AUD/USD - Trade IdeaHere we are currently looking at long positions, this can also been considered as a breakout Trade.
We have a Liquidity Trend Line that we are respecting.
We are currently in short sell positions into the two possible demand zones. I would prioritise our second Demand zone as that would be between our 71% level.
From there I will be looking for long Term Breakout trades

PIUSDT Bullish SceneAfter mainnet migration in 3 days this will boom.
Hold your bags tight because when BTC stabilizes its just a 5x pump in no time.

GOLD GOLD 15min scalper proves that 2920 is a supply roof and buying reluctancy to break it will likely push buyers into 2908 and if they don't keep bullish momentum, sellers in london gold market could drag them like generator into 2901 and below.at 2901 i see some bullish strength again and break below will be lower zone and a break of yesterday low.

GOOGL upside potentialTechnicals
GOOGL has yet to close below a major trendline, indicating potential continuation of the uptrend.
Fair Value Gap (FVG) Target: There is an inefficiency in price that could act as a magnet for an upward move. If buyers step in at support, the next target will be filling this gap.
Fundamentals
Revenue Growth: Q4 2024 revenue came in at $96.5 billion (+12% YoY), driven by strength in Search, YouTube Ads, and Google Cloud.
AI Investments: Alphabet plans to invest $75 billion in AI infrastructure this year, boosting its competitive edge.
Profitability: Operating income rose 33% YoY, with improving margins (32%).
Market Rotation: Strong institutional interest in mega-cap tech stocks supports potential upside.

DXY Dollar Index at Key Support: Is a Major Retrace Coming? 💹📉
In this video, we dive deep into the DXY and analyze the current market conditions. 📊 At the moment, the pair is overextended and trading into a critical weekly support level. 🔄 Join me as we break down the trend, price action, and market structure, and explore a potential trade idea based on these insights. 🧠💡 Whether you're a seasoned trader or just starting out, this analysis will give you valuable perspectives on how to approach key levels in the market. ⚠️ This is not financial advice—always trade responsibly! ⚠️ Don't forget to comment, and boost my video if you find value in the content! 👍📈✨

AUDUSD SELLAUDUSD 4hour break of structure with a 15 min double top and confirmation the chart pattern on the for hour is a head and shoulder pattern.

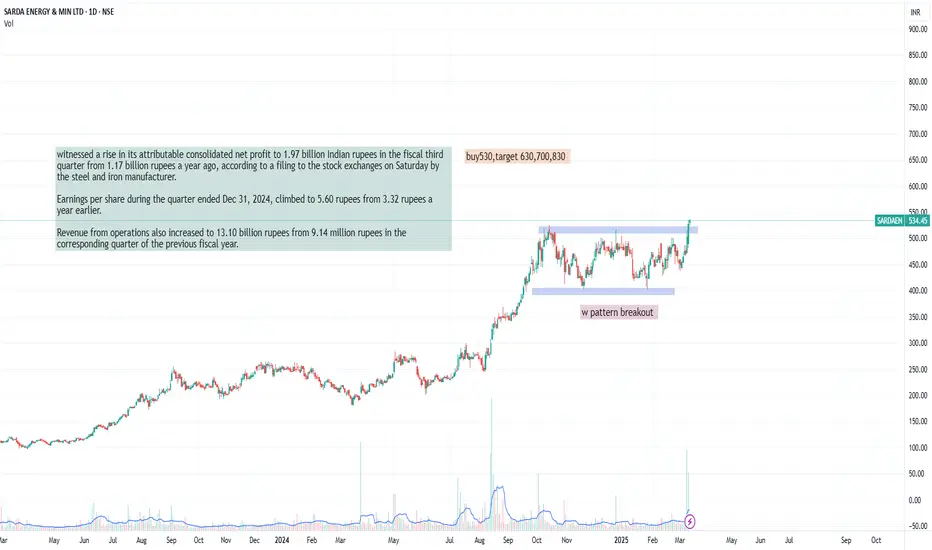
sarda energywitnessed a rise in its attributable consolidated net profit to 1.97 billion Indian rupees in the fiscal third quarter from 1.17 billion rupees a year ago, according to a filing to the stock exchanges on Saturday by the steel and iron manufacturer.
Earnings per share during the quarter ended Dec 31, 2024, climbed to 5.60 rupees from 3.32 rupees a year earlier.
Revenue from operations also increased to 13.10 billion rupees from 9.14 million rupees in the corresponding quarter of the previous fiscal year.
USDJPY 1 HOURS WILL POSSIBLE FOR LONG POSITION COULD BE MOVE ONThe Japanese Yen sticks to its positive bias against a broadly weaker US Dollar through the early European session on Monday amid hawkish Bank of Japan expectations. Traders seem convinced that the BoJ will hike interest rates again

doge longterm buy spot"🌟 Welcome to Golden Candle! 🌟
We're a team of 📈 passionate traders 📉 who love sharing our 🔍 technical analysis insights 🔎 with the TradingView community. 🌎
Our goal is to provide 💡 valuable perspectives 💡 on market trends and patterns, but 🚫 please note that our analyses are not intended as buy or sell recommendations. 🚫
Instead, they reflect our own 💭 personal attitudes and thoughts. 💭
Follow along and 📚 learn 📚 from our analyses! 📊💡"

BTC/USD - 1H Chart Analysis📊 BTC/USD - 1H Chart Analysis
🔹 Current Price: $81,849.22
🔹 Market Structure: Bearish with lower highs and supply zones in play
📍 Key Levels to Watch:
🔻 Resistance (Sell Zone): $84,747 - $85,531 (FVG & Supply Zone)
🟢 Demand Zone (Buy Area): $79,062 - $74,002
📈 Bullish Scenario:
✅ If BTC breaks and holds above $85,531, it may push toward $87,000 - $89,000 (Fib retracement levels).
📉 Bearish Scenario:
🔻 A rejection at $84,747 - $85,531 could drive BTC down to $79,062 - $74,002 (major demand zone).
💡 Trading Plan:
🎯 Sell Setup: Look for bearish rejection at $84,747 - $85,531.
🎯 Buy Setup: Wait for a reaction at $79,062 for potential long positions.
🎯 Risk Management: Stop-loss above resistance, TP at demand zones.
#FXFOREVER #BTC #Bitcoin #CryptoTrading #TechnicalAnalysis #Forex #FXFOREVER 🚀

AUDJPY SHORT, S/D 1H X OTElooking at the chart there is an untapped supply zone which also falls exactly on the FIB OTE AND might act as a continuation trigger for the price downside, target will also be the previous week low. so lets see if this will play out.
NOTE: no limit order, what we do is watch how the candle react on getting to the zone, look for a pin bar rejection candle ( CRT) and enter on the next candle or wait for a bearish engulfing all on the 1H time frame.

GOLD recovers and stays above $2,900, pay attention to CPI dataOANDA:XAUUSD rebounded, driven mainly by safe-haven flows as trade war concerns dampened market risk sentiment and markets focused on US inflation data.
TVC:DXY hit a four-month low, making gold more attractive. Meanwhile, the main event of the week is the US CPI report today (March 12), which could cause major market moves. Positive data could lead to a sharp sell-off in gold, while weak data could give the green light for further gains in gold.
CPI is expected to have risen 0.3% in February, according to a Reuters poll. The New York Federal Reserve's latest consumer expectations survey forecasts inflation at 3.1% over the next year, up slightly from 3% in January. Markets are now expecting the Federal Reserve to cut interest rates in June.
Technical Outlook Analysis OANDA:XAUUSD
On the daily chart, in terms of trend, gold is still in the accumulation phase after recovering from the $2,880 level noted by readers in the previous editions and the break above the $2,900 level provides conditions for further testing of the $2,929 level in the short term.
For now, gold is still trading around the EMA21 and is still in a consolidation state, but in terms of technical conditions, it is more likely to increase in price. With the price channel as a short-term trend, and the RSI activity above 50, quite far from the overbought zone, it shows that the bullish momentum is still ahead.
However, the technical chart still needs a strong impact to break the current accumulation structure. And during the day, the notable positions will be listed as follows.
Support: 2,900 - 2,880 USD
Resistance: 2,929 - 2,942 USD
SELL XAUUSD PRICE 2961 - 2959⚡️
↠↠ Stoploss 2965
→Take Profit 1 2953
↨
→Take Profit 2 2947
BUY XAUUSD PRICE 2899 - 2901⚡️
↠↠ Stoploss 2895
→Take Profit 1 2907
↨
→Take Profit 2 2913

TSLA : A Brief Respite or the Start of a Comeback (Wednesday 12)Overview:
At the time of writing, the stock is hovering around $215, barely holding on to that level. The next significant support aligns with the lower boundary of my descending channel, around $210. If that level fails, I believe we could see further downside—potentially even a move below $200 if selling pressure intensifies.
Technical Observations:
1. **Descending Channel**
My chart shows TSLA trading within a **downward-sloping channel**. The stock is currently near the lower portion of that channel, suggesting that if it loses support at $210, it may continue sliding along the lower band.
2. **Key Support & Resistance Levels**
- $210: This level is both a psychological round number and the lower bound of the channel. If it doesn’t hold, further downside is likely.
- $232: This is a notable resistance level near the channel’s upper boundary. Breaking above $232 (especially on strong volume) could be a signal of a short-term reversal or a relief rally.
3. **Indicators (RSI & TRAMA)**
- **RSI**: Currently in oversold territory, which sometimes indicates a potential bounce. However, oversold can remain oversold if momentum is strong.
- **TRAMA** (my chosen trend/momentum indicator): Still suggests a strong downward trend. Any bounce could be short-lived unless broader conditions change.
4. **Potential Bearish Continuation vs. Bullish Breakout**
- **Bearish Continuation**: If TSLA cannot hold $210 and continues to close below that channel line, I believe a drop below $200 becomes increasingly likely.
- **Bullish Breakout**: In the unlikely event of a swift rebound above $232, it would signal a break of the channel’s upper boundary and potentially open the door to a short-term rally.
My Personal Trading Perspective:
The slight bounce might just be a short-term relief rally, where buyers step in to pick up shares at a perceived discount. However, if there’s no follow-through and volume remains lackluster, the rally can fizzle out quickly, leaving room for further declines.
- Long-Term Entry:
I’d personally look for a strong breakout and daily close above $232 (and above the upper 2nd deviation line) before adding to any long-term positions. That would give me more confidence that the downward trend is reversing.
- Short-Term Long:
I’m watching for a retest of $210. If it holds and shows signs of a bounce, I might take a short-term long position with a potential profit target around $220. I would keep a tight stop-loss, though, because if $210 fails, it could drop quickly.
My report is similar to yesterday. My thought process has not changed.
Disclaimer: This is my personal trading perspective and not formal investment advice. Always do your own research, double check my findings, and manage your risk accordingly.

BUY EURJPY - JPY and CHF weakness in the marketTrader Tom, a technical analyst with over 16 years’ experience, explains his trade idea using price action and a top down approach. This is one of many trades so if you would like to see more then please follow us and hit the boost button.
We are proud to be an OFFICIAL Trading View partner so please support the channel by using the link below and unleash the power of trading view today!
www.tradingview.com

euraud sell signal. Don't forget about stop-loss.
Write in the comments all your questions and instruments analysis of which you want to see.
Friends, push the like button, write a comment, and share with your mates - that would be the best THANK YOU.
P.S. I personally will open entry if the price will show it according to my strategy.
Always make your analysis before a trade

#NIFTY Intraday Support and Resistance Levels - 12/03/2025Flat opening expected in nifty. After opening if nifty sustain above 22500 level then possible upside rally upto 22750+ level in today's session. Any major downside only expected if nifty not sustain above level and starts trading below 22450. This downside rally can goes upto 22300 level after the breakdown.

Elliott Wave View: GBPUSD Extending Higher in Wave 5 ImpulseShort Term Elliott Wave View in GBPUSD suggests cycle from 2.3.2025 low is in progress as an impulse. Up from 2.3.2025 low, wave ((i)) ended at 1.2679 s the 1 hour chart below shows. Wave ((ii)) pullback unfolded as an expanded Flat Elliott Wave structure. Down from wave ((i)), wave (a) ended at 1.2603 and wave (b) ended at 1.2716. Wave (c) lower ended at 1.2557 which completed wave ((ii)) in higher degree. Up from there, wave (i) ended at 1.2614 and wave (ii) ended at 1.258. Wave (iii ) higher ended at 1.292 and wave (iv) ended at 1.286. Wave (v) ended at 1.294 which completed wave ((iii)).
Pullback in wave ((iv)) ended at 1.2858 with internal subdivision as a zigzag. Down from wave ((iii)), wave (a) ended at 1.287 and wave (b) ended at 1.294. Wave (c) lower ended at 1.2858 which completed wave ((iv)). Pair has resumed higher in wave ((v)). Up from wave ((iv)), wave (i) ended at 1.2966. Expect wave (ii) pullback to hold above 1.2858, and more importantly above 1.2557 for further upside. As far as pivot at 1.2557 low stays intact, expect dips to find support in 3, 7, or 11 swing for more upside.

Cardano to dump back to $0.63 and lowerI just now opened a short position on cardano. I anticipate that the market will start to break back down reversing the entire bounce of yesterdays move to make a lower low below $0.63.
I plan to scale out 75% of position round $0.63 area...maybe along the way I scale in a bit into the position and tighten my stop

XPTUSD Short Swing PositionEntry: 975.91
Stop Loss: 1012.33
Take Profit 1: 927.32
Take Profit 2: 903.05
Take Profit 3: 877.11

Don't Panic! Good times around the corner for BitcoinGlobal M2 Money Supply
Global M2 has been leading BTC price action very closely by 10 weeks.
Roughly 12 days from today for upward price action to strongly resume, if the correlation holds.
A wick down to 73-74k is nothing to worry about. In terms of time we are likely very close to the bottom, if it's not already in.
You can use the indicator on your chart for free below.
Shout out to @Mik3Christ3ns3n for the original indicator.
