Bitcoin – Medium-Term AnalysisBitcoin – Medium-Term Analysis
Hello traders,
BTC made a strong breakout recently, reacting precisely at the 117k level as anticipated. At the moment, price is undergoing a correction, clearing liquidity from last Friday’s bullish candle. The firm rejection at 117k suggests we should reassess the medium-term structure.
The main scenario still favours the upside. The 113.4k zone is an attractive level for long entries, as buyers previously dominated this area and short-side liquidity remains in play. From a market psychology perspective, this could trigger short covering and push price towards 115.7k. A confirmed break above 117k would strengthen the medium- to long-term bullish outlook, opening the way for further long positions.
Alternatively, if price reacts lower from 115.7k, it may offer a medium-term short opportunity. Should support at 111.7k give way, BTC could extend down to 110k, a level that has seen multiple strong rejections in the past and could provide a solid base for renewed long positions.
This outlook is guided by support/resistance dynamics and major liquidity zones. Always trade with discipline and keep risk management as your priority.
What’s your perspective on BTC right now? Share your thoughts in the comments so we can refine our strategies together.
Trend Line Break

Gold at a turning point – breakout or pullbackGold Daily Chart – Final Week of August
Hello traders, let’s take a look at the gold outlook for the coming week.
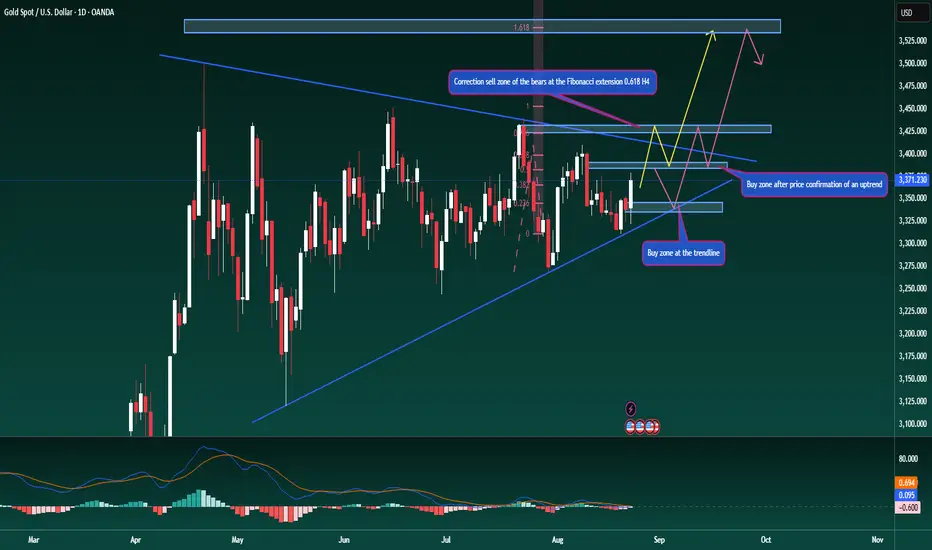
Gold has continued to rally strongly after touching the ascending trendline on the D1 chart, in line with the outlook shared earlier. This bounce also makes the triangle pattern more valid. For the week ahead, trading is expected to remain within the 3330–3410 range, giving about 80 dollars of movement.
While the longer-term expectation is for gold to move towards fresh ATH levels, this will first require a confirmed breakout from the triangle. Once that happens, a minor pullback could occur before the next leg higher (as illustrated on my chart).
On the H4 chart, Friday’s rally has allowed us to plot a Fibonacci Extension, highlighting 3390 and 3430 as potential upside levels. These areas may act as short-term selling opportunities, driven by profit-taking from buyers.
On the daily timeframe, a successful breakout from the triangle could push gold towards 3540, marking a new ATH – this is the long-term scenario. On the other hand, if price pulls back, the ascending trendline near 3341 remains a logical level to consider fresh long positions.
Also note that this is the last week of August. On Friday, a liquidity grab is possible as large players rebalance and settle positions before month-end, so extra caution is advised.
This is my personal outlook for XAUUSD in the week ahead. I hope it provides value in shaping your trading plans.
What’s your view on gold right now? Share your thoughts in the comments so we can learn from each other.
GBPAUD Bearish Trend ContinuationDears,
This is my HTF 2RR trade idea for next week. I believe the chart is self-explanatory.
The price rejected a strong resistance after sweeping liquidity, and then the short-term uptrend has been broken, signaling a long-term downtrend continuation going forward.

Bitcoin Trendline Breakdown: The Pullback Trap Before Further DoBitcoin has officially broken its ascending trendline on the daily chart — a strong technical signal that the bullish momentum is weakening. Yesterday’s sharp pump was nothing more than a classic pullback to retest the broken trendline, and price is now showing signs of rejecting it.
From a price action perspective, this setup often acts as a trap for late buyers, with the market typically retracing the entire pullback move.
🔑 Key Points:
• Daily ascending trendline has been broken.
• Yesterday’s rally = pullback retest of the broken structure.
• Market likely to erase yesterday’s gains and resume downward momentum.
📊 Key Levels to Watch:
• Support 1: $112,000
• Support 2: $108,000
• Invalidation: A daily close back above yesterday’s high (~$117,000).
🎯 Trading Strategy:
• Wait for confirmation on lower timeframes (1H/4H) such as a CHoCH (Change of Character) or BOS (Break of Structure).
• Short entries become favorable if price fails to reclaim $117k.
• Initial targets: $112k → $108k.
• Keep stops above the recent swing high to control risk.
⚡ Summary:
The break + retest of the ascending trendline is a bearish sign. As long as BTC trades below the retest zone, the path of least resistance is down. Traders should stay patient, wait for proper entry signals, and avoid being trapped by the pullback.
⸻

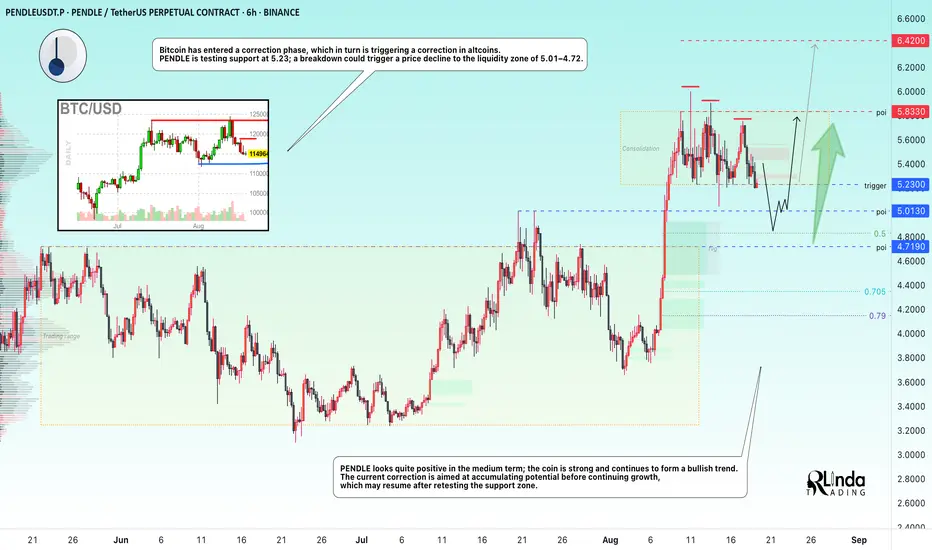
PENDLEUSDT → Retest of the 5.0 liquidity zone before rising to 7BINANCE:PENDLEUSDT is still consolidating, but is preparing to enter a correction phase, which could be triggered by a breakdown the 5.23 support level. Correction is a vital stage for further growth.
Bitcoin has entered a correction phase, which in turn is triggering a correction in altcoins. PENDLE is testing support at 5.23, and a break of this support level, which is already being tested for the sixth time, could trigger a price decline to the liquidity zone of 5.01 - 4.72
PENDLE looks quite positive in the medium term, the coin is strong and continues to form a bullish trend. The current correction is aimed at accumulating potential before continuing growth, which may resume after retesting the support zone.
Resistance levels: 5.833, 6.42
Support levels: 5.23, 5.013, 4.719
On the weekly chart, PENDLE is consolidating above the strong support level of 5.013. As part of the correction, the market may confirm this support and continue its growth towards the ATH from the mirror level.
Best regards, R. Linda!
Bitcoin Outlook – Breakout from the Downtrend ChannelBitcoin Outlook – Breakout from the Downtrend Channel
Hello traders,
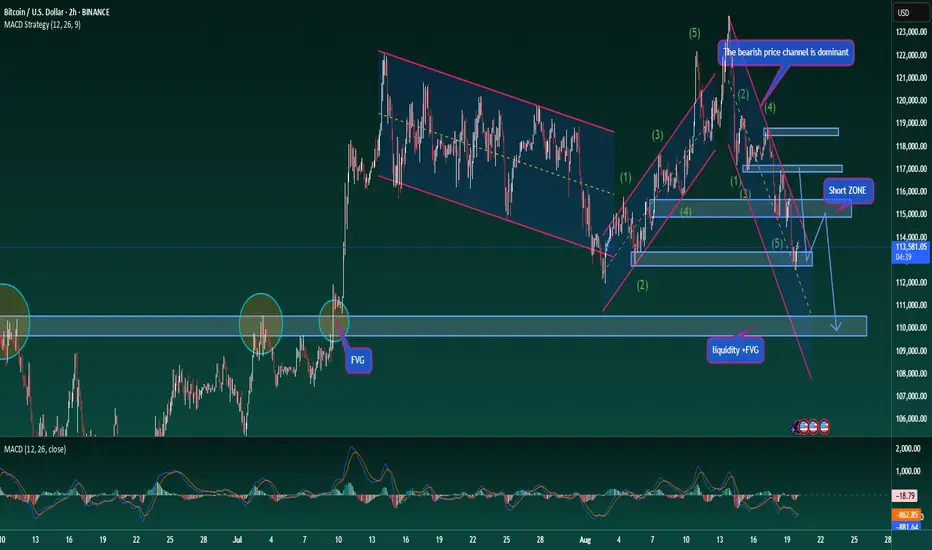
BTC has broken out of its descending channel with a strong impulsive candle, in line with the corrective rally scenario. At present, price is reacting around 117k, confirming a clear structural shift. For the medium term, the dominant trend should now be viewed as bullish. Pullbacks towards 114.5k – 113k may provide attractive opportunities to add long positions.
From an Elliott Wave perspective, BTC appears to be in the final ABC sequence. The current leg is wave B, and traders should look to position long as wave C develops.
Upside targets: 120k – 121k, where a mild correction is likely as liquidity is cleared.
This is my personal perspective on Bitcoin. Stay disciplined, monitor price closely, and manage risk carefully.
What’s your outlook on BTC at this stage? Share your thoughts in the comments so we can refine our trading together.
Bitcoin – Medium-Term Outlook for Long/Short TradersBitcoin – Medium-Term Outlook for Long/Short Traders
Hello traders,
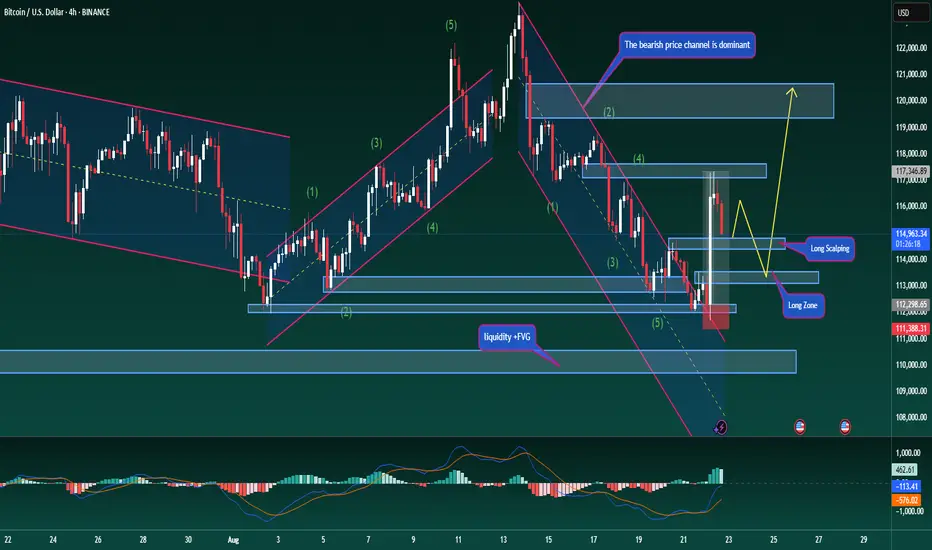
BTC continues to respect the descending channel structure. Recently, price bounced strongly from the solid support around 112k, and it is now only about 2k away from the swing long target zone.
If BTC can break above the 114.8k resistance, a short-term reversal could unfold, with potential to extend towards 117.5k before resuming the broader downtrend. This scenario may also act as a trap for those holding longer-term short positions.
The structure is showing early signs of change: price is trading above the descending channel trendline, while MACD indicates rising volume and its moving averages are curving upward. These signals point to a possible corrective rally in the near term.
Strategy: Consider long entries near current levels, with the option to scale in if price breaks 114.8k.
Medium-term short positions from around 115k remain valid, targeting the 110k zone, which could also serve as a new accumulation area.
This is my personal view of the BTC market. Stay disciplined and manage risk accordingly.
What’s your outlook on Bitcoin here? Share your perspective in the comments below.

Gold – Medium-Term Buy StrategyGold – Medium-Term Buy Strategy
Hello traders,
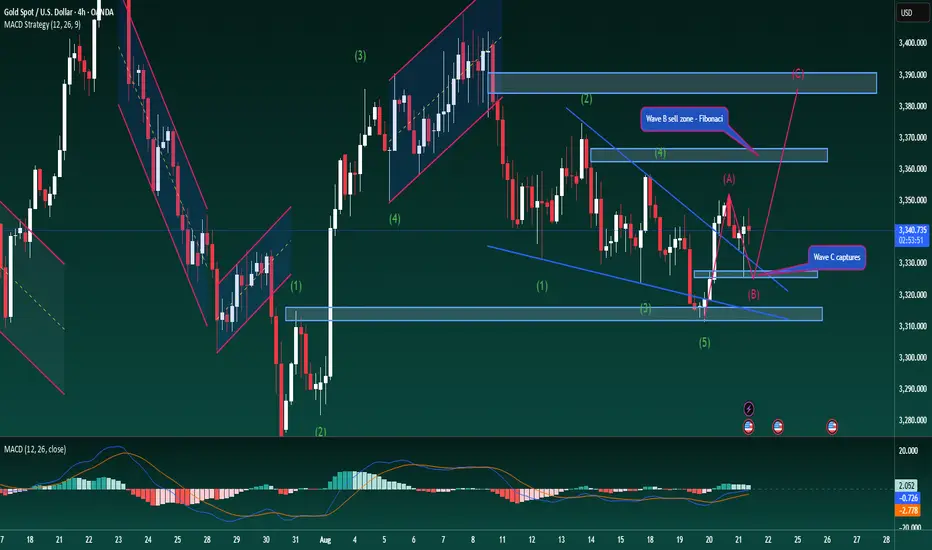
Gold remains within wave B of the Elliott Wave structure. I expect price to retest the trendline once more, with the strong support at 3325 (which triggered a sharp bounce yesterday) likely to play a key role before wave C begins.
According to Elliott theory, wave C is usually the strongest, and in this case it could extend towards the 339x region. This sets up a swing buy opportunity with a reasonable target of 30–40 dollars.
The MACD supports this scenario, with volume holding above average and the green moving line still on top.
Key Resistance: 3348–3352, a break above here opens the way towards 339x.
Key Support: 3313, if broken, the bearish case may return.
Buy Zone: Around 3327, with potential profits of 40–60 dollars.
This is my personal outlook for gold this week. Stay disciplined, trade with structure, and let the market confirm your entries.
What’s your view on gold’s next move? Share your thoughts in the comments.

ETHUSD
📈 Conditional Trade Setup – ETHUSD (Long)
🔹 Bias: Bullish (Trendline Break)
🔹 Signal: Bullish divergence spotted ✅
🔹 Condition: Wait for 📦 Rectangle Breakout
🔹 Confirmation: A strong bullish candle must close above the Lower High
📊 Trade Plan (on chart):
🟢 Entry (EP): Marked on chart
🔴 Stop Loss (SL): Marked on chart
🎯 Take Profit (TP): Levels highlighted
⚠️ Patience: Only execute once breakout candle confirms above LH.

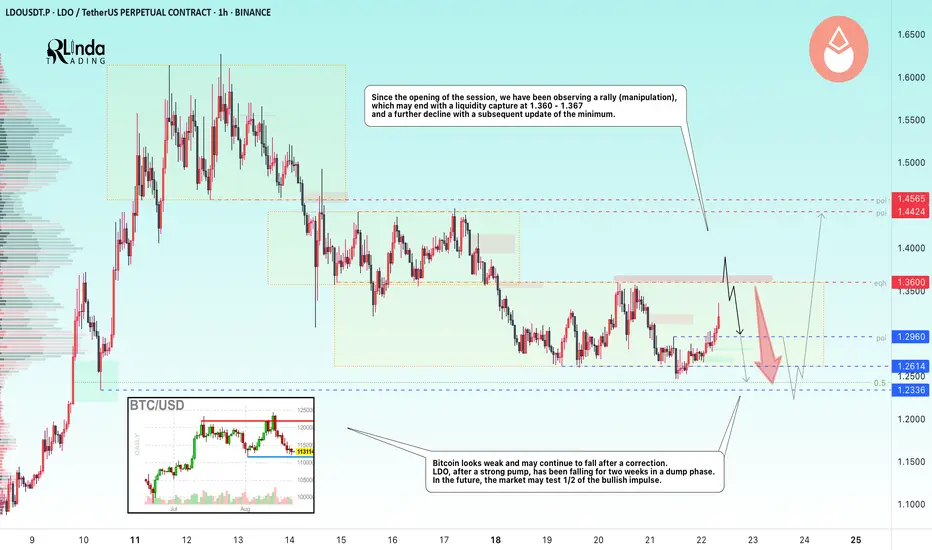
LDOUSDT → Hunting for liquidity ahead of a declineBINANCE:LDOUSDT.P , having failed to reach the zone of interest 1.250 - 1.233, has entered a phase of local rally or manipulation before a possible decline aimed at consolidating potential before long-term growth.
Bitcoin looks weak and, after a correction, may continue to fall to the coveted target of 112 - 110K. After a strong pump, LDO has been falling for two weeks in a dump phase. In the long term, the market may test 1/2 of the bullish momentum and the strong support level of 1.179 before resuming the pump to 1.62 - 1.97.
Since the opening of the session, we have been observing manipulation, the goal of which is most likely the liquidity zone of 1.36 - 1.36. The situation may end with a liquidity grab, a false breakout, and a further decline with a subsequent update of the low.
Resistance levels: 1.36, 1.37, 1.44
Support levels: 1.296, 1.2614, 1.2336
Technically, the price is still consolidating and intrarange trading is likely to continue. A false breakout of resistance could trigger a decline, in which case 1.26 - 1.23 could be considered a target, while a false break of 1.17 - 1.23 could trigger a global rise.
Best regards, R. Linda!
USDJPY BUY SETUP 5 MIN TIMEFRAME4 HR, price is above 10 20 EMA. 30 min price is hitting off EMA. There is also a trend breakout. Waiting for 5 min timeframe price to fill imbalance and move in uptrend. closing half trade at imbalance 148.919 and rest at 1:4rr.

Gold – Elliott Wave “C” Begins (US Session Update)Gold – Elliott Wave “C” Begins (US Session Update)
Gold has reacted perfectly in line with Wave B, clearing the liquidity from yesterday’s H4 bullish candle and then surging strongly. The condition to look further towards Wave C – the final leg in the Elliott structure – is a decisive break above 3352. If confirmed, the long-term bullish outlook strengthens, with the next targets around 337x and potentially 3394.
News of a trade agreement between the EU and the US added strong momentum, helping to complete the corrective Wave B with impressive buying pressure.
For today’s US session, if you are still holding previous buy positions, it is worth keeping them. If not, the 3336–3340 zone provides a reasonable area to consider new long entries, with expectations that Wave C could extend towards 337x.
Always remember to place a tight stop-loss below the 3330 support area to manage risk effectively.
Wishing you success with this scenario – feel free to share your views in the comments below.
#XAUUSD #Gold #TechnicalAnalysis #PriceAction #ElliottWave #Fibonacci #Forex #Trading
GBPUSD Outlook – Trend is My LifeGBPUSD Outlook – Trend is My Life
GBPUSD continues to move in line with the broader bearish structure on the H4 timeframe. Price reactions along the trendline have been accurate, and at the moment, the pair is showing signs of a minor pullback towards the upper trendline. This offers a potential opportunity for a short-term sell, while keeping an eye on the 1.3400 support as a possible swing buy zone.
If 1.3400 breaks decisively, the preferred scenario remains to follow the downtrend with further sells until a clear reversal structure is confirmed.
The MACD indicator continues to signal a strong and sustained bearish bias, adding weight to this outlook. Remember the phrase: “Trend is My Life” – staying aligned with the prevailing trend is key to maximising efficiency across any trading system.
Key levels to watch:
Resistance: 1.3510
Support: 1.3380
Patience in observing price action around these zones will provide better entries and improve trade management.
#GBPUSD #Forex #TechnicalAnalysis #PriceAction #MACD #TrendFollowing

Gold Outlook After FOMC – Building a Bullish StructureGold Outlook After FOMC – Building a Bullish Structure
The latest FOMC meeting offered no new measures to support the economy, as Chair Powell suggested conditions remain stable and interest rates were left unchanged. Markets therefore stayed muted, with expectations now shifting towards September for potential policy moves.
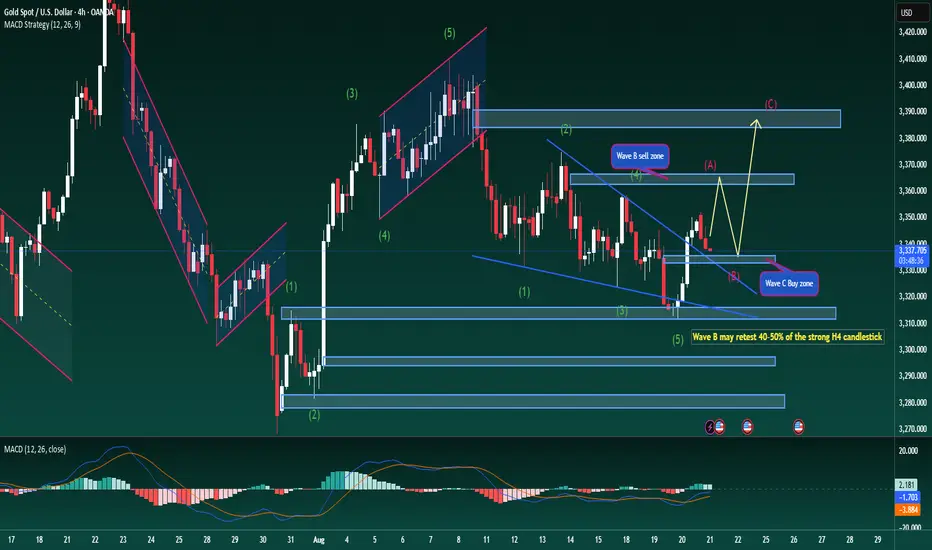
On the technical side, gold has completed wave A after reacting to the daily trendline, and I expect the market is now forming an ABC corrective structure to complete a medium-term Elliott cycle. The recent rally also broke through the descending trendline on H4, confirming that bullish momentum may prove more sustainable.
At present, price is undergoing a mild pullback from the Asian session, with the potential to retrace 40–50% of the recent H4 candle. This move would also retest the broken descending trendline — if confirmed, it would establish a stronger bullish Dow structure and open the path for a longer wave cycle, at least until wave C plays out fully.
The H4 chart supports this scenario, as MACD averages are trending upward and volume is showing steady growth.
Buy zone: Around 3334, in line with the broader trend for medium- to long-term positions.
Sell zone: Around 3365, where wave C could complete and a new cycle may begin.
Gold is gradually showing a clearer technical structure. Patience and discipline with entries should help traders capture this move effectively.
#XAUUSD #Gold #TechnicalAnalysis #PriceAction #ElliottWave #Fibonacci #MACD #Forex #FOMC #Trading
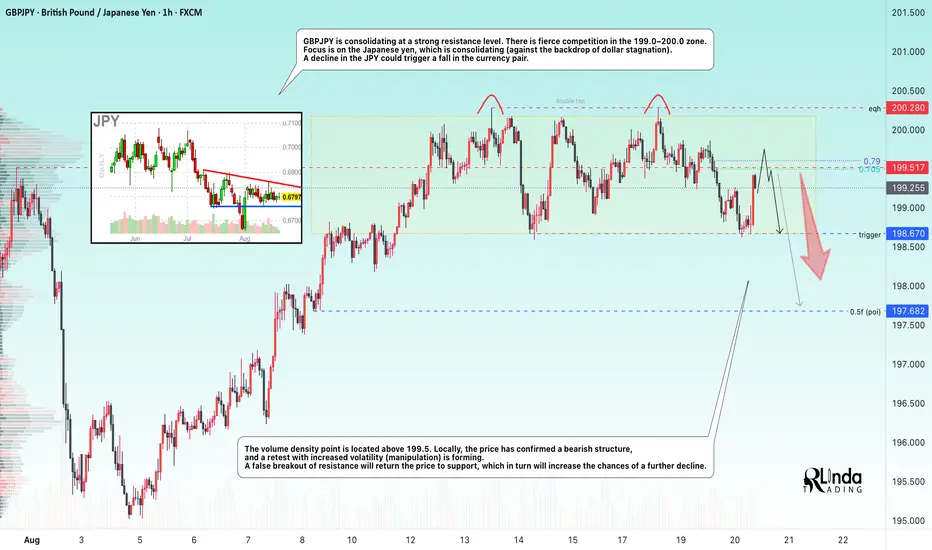
GBPJPY → False breakout and reversal patternFX:GBPJPY is forming a false breakout of strong resistance from D1. A trading range (consolidation) is forming, and market participants are fighting for the 199.0 - 200.0 zone.
GBPJPY is consolidating at strong resistance. A fierce battle is underway for the 199.0-200.0 zone. Focus is on the Japanese yen, which is consolidating (against a backdrop of dollar stagnation). A decline in the JPY could trigger a fall in the currency pair.
The volume density point is located above 199.5. Locally, the price has confirmed a bearish structure, and a retest is forming on increased volatility (manipulation). A false breakout of resistance will return the price to support, which in turn will increase the chances of a further decline
Resistance levels: 199.5, 200.28
Support levels: 198.67, 197.68
A double top reversal pattern is forming on the chart, indicating the presence of strong limit resistance, but the pattern has not yet been realized. The trigger is consolidation support. Locally, I expect a decline from 199.5 to retest the trigger, the breakout of which could trigger the reversal pattern.
Best regards, R. Linda!
JKCEMENTJKCEMENT given trendline breakout. It has posted v decent result above street's expectations. There is high probability that market may turn its trend which is in favor of new trend. Keep it on radar.

Bitcoin Update – Price Action Still on TrackBitcoin Update – Price Action Still on Track
Yesterday’s scenario has continued to play out with precision. BTC remains guided by the descending channel, each time touching the upper trendline it quickly rejects and moves lower. At present, price is reacting around the midline of the channel, near 113,000 – exactly the level highlighted earlier as an area to watch.
With this corrective move, there is scope for BTC to retest the 115,000 region before resuming its broader downtrend. The next downside target sits near 110,000, as larger timeframe structures usually require a corrective pullback before continuing with the main trend – something that aligns closely with Dow Theory principles.
Today’s focus is also on interest rate discussions, which could bring higher volatility across global financial markets as investors remain cautious. However, FOMC outcomes tend to have limited impact on Bitcoin given its nature as a relatively independent asset, unlike gold or forex markets that are more sensitive to macroeconomic drivers.
For short-term trading, traders may consider long positions near 113,000 with a tight stop just below the newly formed support, aiming for a move towards 115,000 before reassessing the broader trend.
Patience and discipline remain key. Sticking to a well-defined plan rather than reacting emotionally to intraday swings will often lead to stronger trading outcomes.
What’s your view on Bitcoin’s next move? Share your thoughts in the comments.
#BTCUSD #Bitcoin #CryptoAnalysis #TechnicalAnalysis #PriceAction #Trendline #DowTheory #CryptoTrading #SwingTrading #UKTrading
Gold Update Today – Watching FOMC in the US SessionGold Update Today – Watching FOMC in the US Session
After yesterday’s sharp drop below 3312 and a strong bounce from key support, gold is now consolidating sideways, building liquidity for the next move. From the current outlook, a corrective rebound seems likely before the broader downtrend resumes.
Looking at structure, the descending channel remains intact, with price respecting the main trendline and notably breaking out of yesterday’s triangle formation — reinforcing the bearish bias.
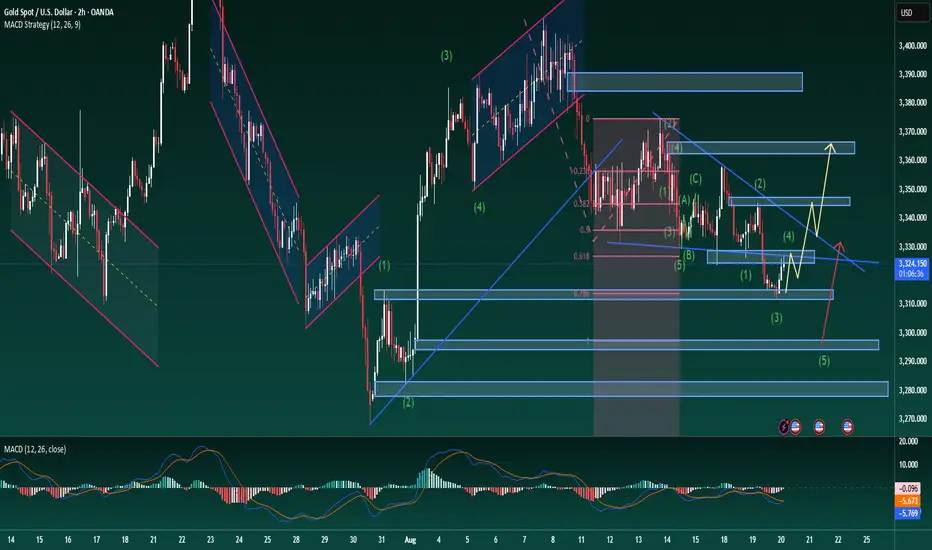
From an Elliott Wave perspective, the market may be forming wave 4. If this rebound carries price back towards 3325–3330, it will retest a strong resistance zone that has rejected price multiple times before. Should that happen, wave 5 could begin — and theory suggests it is often the strongest leg.
Fibonacci levels point to the next support near 3295. If tonight’s FOMC outcome strengthens the US dollar, gold could even extend deeper towards 3280.
In the short term, traders may consider buying near 3316 with a tight stop just below the recent low, targeting the corrective move of wave 4. On the flip side, if price reacts at 3325–3330, this could provide a selling opportunity into wave 5, with scope for a 40–50 dollar extension if momentum holds.
On the daily chart, gold has tested the long-term ascending trendline and bounced strongly, which may indicate that a fresh support base is being established.
A sustainable trend is always built on alternating impulses and corrections. Patience in waiting for confirmation often leads to stronger setups than rushing into trades.
Do you think the FOMC this month will announce a positive interest rate outlook? Share your thoughts in the comments.
#XAUUSD #Gold #TechnicalAnalysis #PriceAction #ElliottWave #Trendline #MACD #Forex #UKTrading #FOMC
GBPUSD Short Position idea! RR 1:6Price broke the daily trend line and its tested back the trend line resistance twice on 4HR down trend fibonacci. This could be a possible pullback till the key zone. Trade with your own risk, Cheers!

GOLD → The market is waiting for a kick (driver). ConsolidationFX:XAUUSD is in a stalemate. A “casino” pattern is forming in the form of a symmetrical triangle. The odds are 50/50, and everything depends on the fundamental background and the emergence of a driver.
Gold is stuck in a symmetrical triangle - consolidation.
Gold is trading around $3330 on Tuesday, remaining in a range with a downward bias amid caution among traders ahead of the Fed minutes.
Technically, it is possible to trade the breakout from consolidation with the price consolidating above a certain level, i.e., post-factum.
Optimism after the meeting between Trump and Zelensky, who promised to end the conflict, is reducing demand for safe assets, but expectations of a Fed rate cut this year are supporting the metal. An additional factor is the confirmation of the US rating by S&P. Powell's speech on Friday will be a key driver, while the dollar has partially recovered after its recent decline.
Resistance levels: 3349.8, 3370.7
Support levels: 3331, 3315, 3301
Volatility has been very low over the past few days, with the market waiting for someone to kick-start movement. Fundamental factors are contradictory, and technically, gold looks uncertainly weak. Based on this, I expect that a retest of the nearest resistance could end with a downward breakdown from consolidation.
Sincerely, R. Linda!

EURCAD → Countertrend correction before growthFX:EURCAD is forming a correction to the support zone against the backdrop of temporary stagnation of the euro, which is the previous extreme from July 1...
EURCAD is forming a countertrend correction within the global bullish trend. The euro is gradually rising amid the fall of the dollar. The Canadian dollar is consolidating below strong medium-term resistance and may continue its decline, which will only support the bullish trend in EURCAD
Technically, the price is entering a liquidity zone, with a point of interest at 1.61 - 1.609, locally at 1.61225, where the upward support line also passes...
Support levels: 1.6122, 1.6100
Resistance levels: 1.618, 1.625
The main focus is on the specified support zones. If, after a false breakdown of the point of interest, the bulls are able to keep the price above the support zone, then in this case we can expect a possible continuation of the trend. Otherwise, the local trend may be broken and the market will go into a deep correction...
Best regards, R. Linda!

Gold 15M OB Reaction – Targeting 3355Price is currently trading around the $3,333 level after reacting to the M15 and M5 Order Blocks (OB). The market is showing signs of a potential reversal from this demand zone, supported by the break of the descending trendline.
Entry Zone: Price is mitigating the M5 OB within the larger M15 OB.
Targets:
TP1: $3,339 – aligned with local liquidity ($$$) and previous highs.
Final TP: $3,357 – a major liquidity zone and supply area.
If price holds above the OB, we can expect bullish continuation towards TP levels. However, a break below $3,323 would invalidate this setup and signal deeper downside.
📊 Bias: Bullish (as long as OB holds).

Is this where GJ starts making its big move?Hi Traders,
After breaking out of a failed swing tapping 200.000, GJ came down to retest the failed swing area at 199.000, bounced and reversed. Around 199.500 could be another retest/entry area before continuation. The weekly looks really good IMO, so I am planning to swing trade. My first target would be around 201.500, and then 203.000. 203.000 would hit an area of a weekly bearish OB.
*DISCLAIMER: I am not a financial advisor. The ideas and trades I take on my page are for educational and entertainment purposes only. I'm just showing you guys how I trade. Remember, trading of any kind involves risk. Your investments are solely your responsibility and not mine.*
