Time to get out or.. to get in?The price reaches the bottom of the symmetrical compression triangle in which it has been moving for weeks.
A break downward brings the price back to the lows for a retest, while a possible (and I would say probable) rebound brings it back to the upper edge to attempt a breakout.
Triangle

Bitcoin can exit from triangle and continue to fall nextHello traders, I want share with you my opinion about Bitcoin. By observing the chart, we can see that the price started to grow inside the upward channel, where it at once rebounded from the resistance line of the channel and fell to the support line. Then BTC broke the support level and rose in a short time to the resistance line of the channel and then it started to decline. Bitcoin fell to the support level, which coincided with the buyer zone, thereby exiting from the channel and after it some time traded between 94250 level, it fell to 90850 points. Next, the price impulsed and continued to grow inside the upward triangle, breaking the support level again. Later it reached the even resistance level, which coincided with the seller zone. Soon, BTC broke the 104700 level, rose to the resistance line, and then fell back and continued to trades between the 104700 level. Later BTC broke this level and fell below, after which turned around and quickly rose to the resistance line of the triangle and then dropped to the support line, where at the moment continues to trades close. So, in my mind, I think that Bitcoin can move up and then exit from the triangle and continue to decline to the 94250 support level. For this case, I set my TP at this level. Please share this idea with your friends and click Boost 🚀

XAUUSD → Will Retrace till 2802-2794 but after hitting 2835Hello Traders!
As gold has made its ATH 2830 which was also a trendline where gold respect that trend line and down now every thinking for retracement but gold will do a breakout till 2835 as gold done on previous trendline
gold can hit 2835 easily before drop to retracement level of 2794, so for now i am bullish till 2835 in that zone i will see a good entry for sell.
Support: 2802
Resistance:2830
Fib Golden Zone: 2794-2796
Liquidity Zone: 2794
Gold will continue its trend after retracement but we need a good entry for sell almost from 2835

PEPE Deep dive before pumping? To what price?CRYPTOCAP:PEPE Script: A potential deep dive might be on the horizon before the next pump.
Right now, it’s forming a structure that looks a lot like the pattern we saw from March to May, which I’ve marked as points 1 to 7.
Both of these structures showed up after breaking out from the near-end of a symmetrical triangle.
Currently, we’re sitting at point 6.
Using Fibonacci retracement, we can estimate how deep the dip might go.
Last time, it reached Fib 1.618. If history repeats itself, PEPE could pull back to around 0.00009485.
This potential drawback would also break the uptrend line, which could shake market confidence and flush out weaker hands—perfect for accumulating liquidity to fuel a future price surge.
I’ve already set a buy order at this level, just in case this scenario plays out.
Of course, this is just one potential script among many. I’ll share more as they unfold.
Follow me for more insights and updates! 😊

Gold Retracement has begun and will end on the order block.Hello, Traders!
As gold dropped from 2830 and is now trading between 2812-2813, this decline is true and valid till 2772-2773 since I identified significant liquidity, an order block, FVG, and parallel channel trendline support.
So gold should make this extremely serious and genuine move in order to continue the bullish trend.
Support number: 2801-2796.
Resistance: 2830.600.
Order Block: 2771–2778
Fair Value Gap: 2778–2779
Golden Zone of Fib: 2794-2801
We will trade in tiny time frames with other confirmations like morning star or any bullish engulfing candle, with suitable stop loss below order block and liquidity zones.
If you liked my analysis, please support my idea and follow me.

USDCHF → The bullish trend may get its continuationFX:USDCHF is entering the realization phase after a prolonged correction. A favorable background is created by the uptrend and rising dollar...
The technical outlook on the daily timeframe is very good. The price after breaking the trend resistance tested the previously broken line. The currency pair after the false breakout managed to consolidate above the key point, marking an interim bottom and further prospects.
Technically, the focus is on the resistance at 0.911, if the bulls can overcome this area and consolidate above this level, the currency pair will be able to realize a rise to 0.918 - 0.93.
Resistance levels: 0.911
Support levels: 0.90555
Before breaking the resistance, the currency pair could test 0.90555 due to the liquidity generated below this area. But, the trigger that can provoke further growth is 0.911
Regards R. Linda!

Gold Retracement started and will stop on order blockHello Traders!
As gold dropped from 2830 and now trading between 2812-2813 this drop is genuine and valid till 2772-2773 because there i found strong liquidity, order block, FVG and also parallel channel's trendline support.
so gold should do this move which is very real and genuine for a bullish trend continuity.
Support: 2801-2796
Resistance: 2830.600
Order Block: 2771-2778
Fair Value Gap:2778-2779
Golden Zone of Fib: 2794-2801
we will trade in small time frame with some other confirmations like morning star or any bullish engulfing candle with proper stop loss below order block and liquidity zones
if you like my analysis kindly boost my idea and follow me

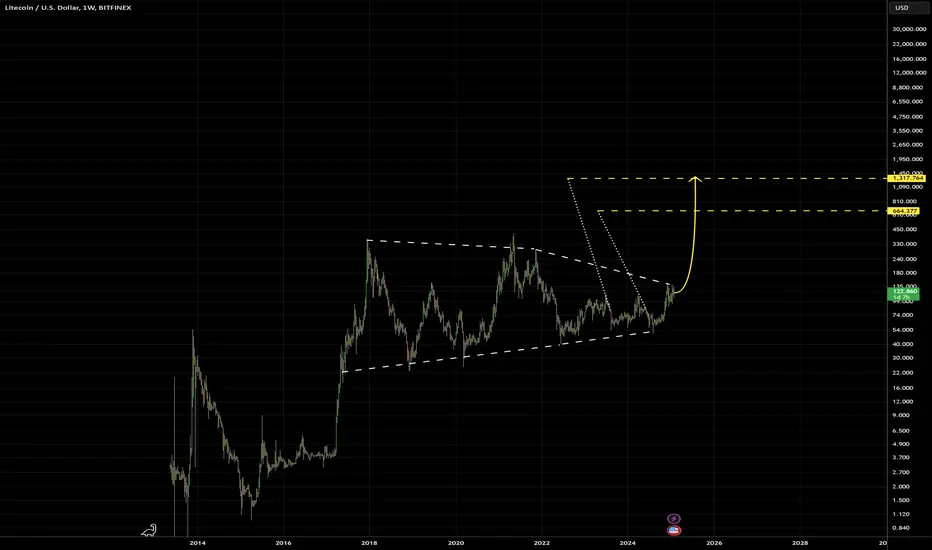
Is an $LTC run imminent?I've been an observer of CRYPTOCAP:LTC on longer time frames for years and it seems to be potentially setting itself up for a massive move similar to March 2017 in aggressiveness.
8 years of cycles and slashing of mining rewards have finally distributed CRYPTOCAP:LTC rewards to the strongest and most determined holders who now are awaiting CRYPTOCAP:LTC ETFs to launch where potentially trillions of dollars of new demand can pour into this infinite resource.
Lets see if its finally Litecoin's time to shine.
Good Luck!
XRP Mirrors 2017 Bull Run, with a 52% Pullback Coming?XRP's last true bull market was in 2017, and the current cycle seems quite similar. Both started with several years of triangular consolidation before breaking out.
During the previous cycle, XRP retraced to Fib 0.786 after hitting Fib 1.
This time, it’s showing a slight pullback after reaching Fib 1 as well.
Every coin has multiple potential scenarios, and one possible script for XRP is retracing to Fib 0.786 after touching Fib 1—implying a potential correction of at least 52%.
However, the real bull might ignite after this pullback, with targets possibly reaching $26 (Fib 1.618, as seen in the last cycle).
Feel free to share your perspectives—I’ll cover other potential XRP scripts in the future!

Ascending traingles on AMD higher time frame chartLooks like AMD will be bottoming soon (~90's)
AMD is following the ascending triangle pattern and the descent it is experiencing right now is very similar to the ABC it had before. Similar projection from the top of ABC and if the similarity continues, it will fall on the green/support trendline and bounce. The stock might hit the trendline when the price is around 90's or it might just wick down to the trendline and bounce too.
Anything in the 90's should be a BUY in my opinion. Feel free to share your thoughts.

Ascending Triangle breakout for SWFTCoin!Is there an Ascending Triangle hiding among the bearish patterns being displayed...
Or is momentum fading....

Rising Wedge Pattern For SWFTCoin.... Hidden Ascending Triangle!The rising wedge is a chart pattern used to identify possible reversals.
The pattern appears as an upward-sloping price channel featuring two converging trend lines.
It's usually accompanied by falling trading volume.
Wedges can either form in the rising or falling direction.
A rising wedge is often considered a bearish chart pattern, meaning it indicates a breakout to the downside.
Be careful of a shakeout-fake-out.
It appears as though an Ascending Triangle is hiding in the shadows.
It is very common for whales to accumulate at the bottom of these patterns..
glta

ETH Update!Here is my analysis on ETH, marked zone is the last standing zone for me, if ETH breaks it, it will be bad, for me Eth still is bearish on weekly time frame. However, triangle pattern can turn the tables if it plays right.
Took this trade, will manage accordingly, follow for more ideas.

DOW JONES INDEX (US30): Bullish Outlook Explained
It feels like US30 index is preparing to recover
after Friday's and today's selloff.
As a confirmation, I see a nice bullish imbalance
after a test of a daily support and a tiny ascending triangle
pattern on an hourly.
Goals: 44196 / 44470
❤️Please, support my work with like, thank you!❤️

USDJPY → Trump crashes the market, dollar ralliesFX:USDJPY breaks downtrend structure. Monday started unexpectedly for traders with Trump's actions, which gutted localized situations not only in the forex...
The imposition of tariffs, another batch of statements about the Eurozone, BRICS, and also this: “Trump said that the Fed made the right decision last week to suspend rate cuts” produced a corresponding reaction in the market. On the back of inflation expectations, the dollar is accelerating its growth, thus provoking a rally in USDJPY.
Technically, the focus is on the resistance at 155.95 and the support of the previously broken channel, which can be tested before further growth.
Resistance levels: 155.95, 156.6
Support levels: 155.0, 153.6
The price is trying to consolidate in the buying zone, but the resistance at 155.95 is holding the price back from active strengthening. Breakdown and consolidation of the price above this area may provoke growth to the trend resistance.
Regards R. Linda!

CADNOK Short I've been short CADNOK since 7.9394 (the weekly symmetrical triangle resistance area). The trade was taken based on a weaker CAD. The NOK was irrelevant. At the time, I also went long EURCAD and short CADJPY and CADSEK.
The fundamental bias to sell the Canadian dollar is now even more substantial. However, I'm not planning to enter a second short. Instead, I'm holding my short position in anticipation of a bearish breakout of the symmetrical triangle.
CITYINDEX:CADNOK

Do you think I'm joking ???As you can see, the price is forming two bullish patterns on the 4h timeframe, If my view is correct, DOGE will rise to $0.53 .
And if this pattern is correct and breaks, higher targets are possible.
Give me some energy !!
✨We spend hours finding potential opportunities and writing useful ideas, we would be happy if you support us.
Best regards CobraVanguard.💚
_ _ _ _ __ _ _ _ _ _ _ _ _ _ _ _ _ _ _ _ _ _ _ _ _ _ _ _ _ _ _ _
✅Thank you, and for more ideas, hit ❤️Like❤️ and 🌟Follow🌟!
⚠️Things can change...
The markets are always changing and even with all these signals, the market changes tend to be strong and fast!!

ETH | Alternative Chart Pattern | EducationJust a short update for my latest C&H post
Price is also forming an Ascending Triangle pattern with a liquidity zone of $2,800 - $3,000 for an average spot for buyer to step in
When trading chart patterns it's best to figure out how to jump in before the breakout similarly to the last touches highlighted in blue on the bottom trendline
You can see that price was forming a bottom-like pattern or what I also like to call price accumulation and then vice versa for the tops.

BITCOIN → The price is getting ready to drop to 100K - 97KBINANCE:BTCUSD is facing strong resistance. The price is being pushed away from the 105-107K zone as much as possible, forming a defense conglomerate. But, this resistance cannot overshadow the global bullish situation yet
A controversial situation is forming on H1-H4: a descending channel and a symmetrical triangle. And everything depends on what part of the market sees which figure. The primary reaction to the triangle support may be accompanied by a rebound, but based on the situation with the resistance, we can assume that the rebound from the triangle will not be deep and the price will try to go down.
If we look at the descending channel, the price is held back from falling by the support at 101.600.
Yes, technically, it is the support of 101.600 that plays the main role now. The main question is whether this level will hold the price or not.
Fundamentally, the situation is debatable, as the situation mainly depends on America, on how Trump and officials will use rhetoric regarding cryptocurrencies. It could be a bubble, a scam to win an election, or empty talk. Or it could be an actual strategy
Resistance levels: 103.4K, 105.8K
Support levels: 101.6K, 99.6K
Emphasis on 101.6. In the short term, I expect a breakdown and price consolidation below the level followed by a drop to 100-97K
BUT! Since there is a symmetrical triangle on the chart, a false breakdown of 101.6 may lead to a small upward bounce before a further fall to 100K
Regards R. Linda!

Tata Consumer Products - Bearish could touch 650 - 550Tata Consumer products has shown triangle pattern breakdown.
It could reach to 650 - 550 by March 2025.

BTCUSD price is getting ready to drop to 100,000 to 97,000BTCUSDT is encountering significant opposition. In order to create a defense conglomerate, the price is being forced as far away from the 105–107K range as feasible. However, the worldwide bullish position cannot yet be overshadowed by this resistance.
On H1-H4, a symmetrical triangle and a descending channel are developing into a contentious scenario. Additionally, everything is dependent on which market segment views which figure. Although a rebound may accompany the initial reaction to the triangle support, given the resistance, we can presume that the price will attempt to decline and that the triangle's rebound will not be significant.
The price is prevented from falling by the support at 101.600 if we examine the descending channel.
Yes, technically, 101.600's support is now what matters most. Whether or not this level will hold the price is the key question.
At its core, the issue is controversial because it primarily hinges on America and how Trump and other politicians would employ rhetoric around cryptocurrency. It might be empty rhetoric, a bubble, or a sham to win an election. Or it might be a real tactic.
Resistance levels: 103453, 105765
Support levels: 100150, 98890
Focus on 101.6. I anticipate a short-term price consolidation and fall below the level, followed by a decline to 100–97K BUT! A false breakdown of 101.6 could result in a brief upward bounce before a further down to 100K because the chart shows a symmetrical triangle.
Analysis By: NexusTradesZone

HelenP. I Bitcoin will grow to resistance level and then dropHi folks today I'm prepared for you Bitcoin analytics. If we look at the chart we can see how the price broke the support level and tried to grow more, but failed and in a short time declined to 91900 points firstly and then it fell to the trend line. After this, BTC turned around and started to grow inside a triangle pattern, where it soon reached the 98800 level, broke it, and continued to move up, after retesting. Later BTC rose to a resistance level, which coincided with the resistance zone, and even rose higher and reached a new ATH, but then it turned around and dropped below the resistance level, breaking it one more time. Then the price tried to return, but failed and some time traded near the 106400 level and then dropped to the support zone, where it reached the trend line, which is the support line of the triangle as well. After this, it rebounded up to the triangle pattern's resistance line, which continues to trade to this day. So, I expect that BTCUSDT will make a move up to the resistance level and then start to decline to the trend line, therefore I set my goal at 101K points, which coincided with this line. If you like my analytics you may support me with your like/comment ❤️

Buying Spot CMP Target $1SEI
Sei
SEI
#71
207K
$0.3398
3.36% (1d)
Market cap
$1.5B
3.36%
Volume (24h)
$111.57M
19.92%
FDV
$3.39B
Vol/Mkt Cap (24h)
7.45%
Total supply
10B SEI
Max. supply
--
Circulating supply
4.43B SEI
