GOLD → Shaking. Going into flat. What's next?FX:XAUUSD is moving from a local bullish trend to a flat state. Bulls are still protecting strong risk zones. What to expect from the metal next?
Investors are returning to safe-haven assets due to uncertainty over Trump's tariffs and weak U.S. economic data.
Gold pulled back from a record $2,956 on Tuesday on profit taking and due to a drop in Chinese imports. However, a weak U.S. consumer confidence index helped the price recover.
Gold's rise is being held back by a strengthening dollar and bond yields, but trade war fears are supporting demand for the metal
Resistance levels: 2921, 2929, 2942
Support levels: 2905, 2888
Thus, we are forming a flat (sideways range). There is a possibility for a decline, for example, to retest the support 2905 - 2888 before further growth. Or growth and breakdown of resistance.
If the bulls can enter the 2921-2929 zone and keep the defense above this zone, the metal may return to growth.
Regards R. Linda!
Triangle

EURUSD → Pre-break consolidation against 1.053FX:EURUSD continues to form bullish hints for a possible continuation of growth. There is strong resistance ahead and the market is forming a pre-breakdown consolidation
The dollar continues its correction amid economic data, the country's politics and hints from Trump and Powell of a possible rate cut soon.
The euro is benefiting from the dollar's decline, but how long will it last, especially amid the tariff war between the U.S. and Europe?
Technically, at the moment, the chart indicates a bullish outlook. Within the local uptrend, an ascending triangle is forming, which generally indicates bullish interest in the market. The focus is on the pattern base - resistance at 1.053.
Support levels: 1.045, 1.040
Resistance levels: 1.053
If the dollar continues its downward course, the currency pair has all chances to grow.
A retest of the trend support (false breakout) before the resistance breakout is possible.
Breakout and consolidation of the price above 1.053 may provoke growth.
Regards R. Linda!

Bitcoin’s Symmetrical Triangle Breakdown – How Low Can It Go?Bitcoin ( CRYPTO:BTCUSD ) started to fall, as I expected in the previous post ; the question here is whether the fall continues or not .
Today, I want to analyze Bitcoin for you in the 15-minute time frame .
Bitcoin was able to break the Support zone($93,300-$90,500) and important Support line .
Bitcoin also seems to have formed a Symmetrical Triangle Pattern and was able to break the lower line of the triangle.
Educational Tip : The Symmetrical Triangle is a continuation pattern where the price consolidates into a narrowing range with lower highs and higher lows. It indicates indecision, with a breakout in either direction confirming the next trend.
I expect Bitcoin to drop to the targets that I specified in my chart.
Note: If Bitcoin goes above $95,850, we can expect more pumps.
Please respect each other's ideas and express them politely if you agree or disagree.
Bitcoin Analyze (BTCUSDT), 15-minute time frame.
Be sure to follow the updated ideas.
Do not forget to put Stop loss for your positions (For every position you want to open).
Please follow your strategy and updates; this is just my Idea, and I will gladly see your ideas in this post.
Please do not forget the ✅' like '✅ button 🙏😊 & Share it with your friends; thanks, and Trade safe.

Gold Idea Today.........
AronnoFX will not accept any liability for loss or damage as a result of
reliance on the information contained within this channel including
data, quotes, charts and buy/sell signals.
If you like this idea, do not forget to support with a like and follow.
Traders, if you like this idea or have your own opinion, please feel free command me.

BITCOIN → Testing $88K - $90K. False or true breakdown?BINANCE:BTCUSD enters the risk zone and forms a false breakdown of the key support zone. All eyes are on the bulls, whether they can keep their defense on the market or not....
On D1 - W1 price in global consolidation after strong growth. The focus is on 90-91K, a zone that is a strong support for the global trend. A false breakout is forming at the moment.
On the Local timeframe H1 - H4 the price is testing the local channel support, as well as the risk zone 89400.
If the bulls can keep the defense above 89400 - 90K, bitcoin may strengthen. The primary target in this case could be 94K
Support levels: 91280, 89400
Resistance levels: 94800, 99200
Statistically, the strongest dvjeniyas are formed after a false breakdown. But there is another question here, what kind of breakout will be - true or false.
In our case, we need to wait for confirmation, namely, for the price to consolidate above the key zones and levels. Emphasis on 89400, 90000, 91300
Regards R. Linda!

EURO - Price can bounce up from triangle to $1.0600 pointsHi guys, this is my overview for EURUSD, feel free to check it and write your feedback in comments👊
Price started to decline in the falling channel, where it bounced from the resistance line and broke $1.0465.
Then it continued to fall and reached $1.0265 support level, which coincided with support area and tried to grow then.
After this, price turned around and dropped to support line of channel and then made upward impulse.
Euro exited from channel and later started to trades inside a triangle, which continues to trades to this day.
In a triangle, price made a strong gap and then rose to resistance level, even broke it, but now trades below.
So, I think that Euro can break this level and even exit from a triangle, after which continue to grow to $1.0600
If this post is useful to you, you can support me with like/boost and advice in comments❤️

Bitcoin: Fibonacci Triangle PatternSeeing diamond pattern on tops gives us general clue that market is about to fall. After all, this is what it draws (what masses go through) as it loses momentum and eventually goes for a correction.
However, even if we're very sure, rushing to trade based on systematic patterns does not actually guarantee the desired outcome. For instance, the bullrun which started in 2016 lasted relatively longer and each top of smaller composite cycles might also have drawn similar patterns that one might identify as bearish reveals, but it kept going up. The concept of order in chaos is not absolute, so it's best not to rely on only one interpretation, especially when we're dealing with collective human consciousness where uncertainty and duality makes it one of the most trickiest systems. Therefore, seeking for an additional layer of confirmation is a preferred discipline, before considering fractals.
Triangle Pattern - General Theory
Historic swings are obviously crucial, however focusing on the recent price activity deserves a higher priority. If we observe the pattern closely, we can establish that there were rejections from top as well as bottom. In this triangular formation, a falling ATR reflects the indecisiveness of market participants.
I've learnt from CMT that triangle pattern is also referred to as a “coil” because of the way price action behaves within the pattern — similar to a compressed spring or coil that is winding tighter before a strong breakout (energy release).
You must know that they come in three primary types, each with distinct price movement implications. The symmetrical triangle is a neutral pattern where price forms lower highs and higher lows, signaling indecision and a breakout in either direction. The ascending triangle is bullish, featuring higher lows and a flat resistance level, indicating strong buying pressure and a likely upward breakout. In our case, we're dealing with the descending triangle which is interpreted as bearish, because of lower highs and a flat support line, suggesting increasing selling pressure and a higher probability of a downside breakout. (We still need to wait for breakout to occur!)
Trading a coil triangle pattern effectively involves a systematic approach to confirm breakouts and manage risk. First, traders should wait for a breakout beyond either the resistance or support level, ensuring the move is decisive. A key confirmation factor is trading volume—a breakout accompanied by high volume is generally more reliable, reducing the likelihood of false moves. Once a breakout occurs, traders can set price targets by measuring the height of the triangle at its widest point and projecting that distance from the breakout level. To mitigate risk, it is essential to place a stop-loss just inside the triangle’s boundaries, ensuring that any unexpected reversals do not lead to significant losses.
Fibonacci Triangle Visualization
Since I love to experiment, I couldn't resist from capturing the pattern using Fibonacci Channels to help you visualize the high passions and tensions during the battle between bulls and bears for the direction of trend. It provides a data-driven structured way to project breakout targets with precision.
This approach is a part of my research aimed at studying and understanding the actual market behavior, particularly market noises that lead to false signals.

GOLD → Bullish structure. Emphasis on 2955FX:XAUUSD is still in consolidation, but the flat is gradually changing into an ascending triangle structure, which further explains the bullish interest in the market.
Gold price is consolidating near the record high of $2,956. Investors took a pause before a possible continuation of gains amid renewed trade war fears over Trump's statements on tariffs and controls on exports of Nvidia chips to China.
Weak risk sentiment and a rising dollar are holding back gold, but lower bond yields and expectations of Fed policy easing are supporting prices.
Gold will remain influenced by tariff negotiations and US consumer confidence data in the coming days
Resistance levels: 2940, 2954.5
Support levels: 2930.7, 2921
Local resistance at 2940 is ahead. If the bulls are able to consolidate above this area, we should wait for the growth and the retest of 2954.5.
2954.5 is a trigger, the breakdown of which will provoke the continuation of the bull rally.
But before that the consolidation between 2954 and 2940 may be formed. I don't exclude the flat support retest before further growth.
Regards R. Linda!

#LDOUSDT: Triangle Breakout – Next Move?Market Overview:
#LDOUSDT has been in a strong uptrend and recently formed a triangle pattern on the 1-hour timeframe. This pattern typically signals trend continuation, and we just witnessed a breakout!
Key Observations:
🔹 Triangle breakout confirmed – bullish signal!
🔹 Resistance Level: Watch for a clean break for further confirmation.
🔹 Potential Targets (TPs): Higher highs expected if momentum holds.
Strategy:
🔹 If price retests the breakout zone and holds, we could see a strong bullish continuation.
🔹 Invalidation: If price falls back into the pattern, we may see a fakeout scenario.
What’s your take? Will #LDOUSDT pump higher or is this a bull trap? Share your thoughts below!
Follow for more chart updates, trade ideas, and market insights!

Ascending Triangle pattern for Zcash or Hidden Bear Flag!!!??!?!It appears as though Zcash is forming an ascending triangle pattern, but often this can be confused with a bear flag depending on the Macro Trend of the asset.
The rsi is in a great place for the price to pump.
We have seen the price of Zcash touch the upward sloping support of the pattern over half a dozen times, this is the first time the price have dipped below the upward sloping support.
The price is going to need to rebound immediately if we're going to see a continuation of the pattern.

GOLD → Price is in consolidation and getting ready to go to $3KFX:XAUUSD is preparing to continue its growth. Consolidation is forming against strong resistance. The dollar in the correction phase continues to update the lows....
Gold is consolidating near 2945-2955, remaining cautious due to Trump's tariff threats and waiting for US inflation data. Which technically increases the chances of continued gains.
Optimism in the markets is supported by upcoming US-Russia talks on Ukraine, new Chinese measures and the victory of conservatives in Germany.
Weak dollar and expectations of Fed rate cuts support gold, but rising risk appetite reduces its attractiveness
Resistance levels: 2946.5, 2954.5
Support levels: 2935, 2921
Technically, the focus is on 2946.5. If the bulls are able to break this level, the resistance ahead at 2954.5 will not seem so strong. In this case, the price will continue its growth to 2969 - 3K
But, before further growth, as gold is still in consolidation, the price may test the liquidity zone 2935 - 2921.
Regards R. Linda!

Gold (XAU/USD) Breakout Setup – Bullish Momentum Ahead?Overview:
A potential bullish breakout from a triangle pattern, signaling a continuation of the uptrend.
Key Technical Insights:
🔹 Triangle Formation Breakout
Gold price has been consolidating inside a symmetrical triangle, a common pattern before a breakout.
The price has just broken above the resistance, confirming a potential bullish move.
🔹 Support & Resistance Levels:
Support: Around 2,933 - 2,935 USD, acting as a retest zone after the breakout.
Resistance: Near 2,946 - 2,950 USD, the last hurdle before the next rally.
🔹 Target Projection:
Based on the triangle breakout measurement, a potential 3.75% move (110 USD) to around 3,044 USD is anticipated.
Trade Plan:
📌 Entry Strategy:
A retest of 2,935 USD could provide a better entry for confirmation.
Aggressive traders may enter immediately after breakout confirmation.
📌 Stop Loss:
Below 2,914 USD, invalidating the breakout structure.
📌 Take Profit Target:
Around 3,044 USD, aligning with the measured breakout target.
Final Thoughts:
✅ Breakout confirmed – waiting for retest to enter safely.
✅ Momentum and volume support bullish continuation.
✅ Caution if price falls below 2,914 USD, invalidating the pattern.
📈 Gold remains in an uptrend – monitor price action for confirmation! 🚀

Bitcoin (BTC/USD) Trade Setup – Potential Long Opportunity ChartChart Overview:
A possible bullish retracement setup. The price has recently experienced a sharp decline, but a recovery is forming, suggesting a potential buying opportunity.
Key Trading Zones:
🔹 Entry Zones:
1st Entry: Around 95,790 USD, where the price is currently consolidating.
2nd Entry: Near 97,150 USD, an intermediate resistance level.
3rd Entry: Close to 97,678 - 98,205 USD, marking a stronger resistance area.
🔹 Stop Loss:
Placed above 99,000 USD to protect against further upside risk.
Trade Plan:
📌 Entry Strategy:
Buyers may step in near the current support zone (~95,790 USD) for a potential upside move.
If the price breaks above the 97,150 USD level, a further rally toward 98,205 USD could occur.
📌 Target Levels:
A possible short-term bullish retracement toward the entry zones (97,150 - 98,205 USD) before deciding further direction.
📌 Stop Loss Strategy:
If price moves above 99,000 USD, it invalidates the short-term bearish scenario.
Market Structure Analysis:
✅ Previous Strong Drop: Indicates sellers' control, but a retracement is expected.
✅ Potential Retracement Levels: Buyers may attempt to push BTC back into the entry zones.
✅ Risk-to-Reward Ratio: The trade setup suggests a favorable risk-reward balance if price follows the expected path.
Final Thoughts:
Watch for confirmation of a bullish retracement before entering.
A break below 95,000 USD could invalidate the setup.
Manage risk properly and adjust stop losses accordingly.
📈 Trade carefully and monitor market conditions! 🚀

Gold (XAU/USD) Trade Setup – Bullish BiasChart Overview:
This 15-minute XAU/USD chart from OANDA shows a potential bullish setup with clearly defined support, resistance, and trade levels. The price is currently in an upward trend, with a possible pullback before further continuation.
Key Trading Zones:
🔹 Strong Support Level: Around 2,921 - 2,930 USD, where buyers previously stepped in.
🔹 Resistance Area: 2,946 - 2,950 USD, acting as a breakout level.
Trade Plan:
📌 Entry Strategy:
A potential pullback toward the 2,935 - 2,940 USD zone could provide a good buying opportunity.
If price respects the support, it could trigger a bullish push.
📌 Take Profit Targets:
1st TP: Near 2,950 USD, a short-term resistance level.
2nd TP: 2,971 USD, marking a higher target for extended bullish movement.
📌 Stop Loss:
Positioned near 2,915 USD, below the strong support zone, to limit downside risk.
Market Structure Analysis:
✅ Volume Analysis: Increasing volume at key levels suggests strong buying interest.
✅ Trend Direction: The market is attempting a higher low formation, indicating a potential bullish continuation.
✅ Risk-to-Reward Ratio: The setup shows a favorable risk-reward ratio for buyers.
Final Thoughts:
Watch for a pullback before entering long positions.
A break above the resistance zone could push the price toward the second TP.
Manage risk properly with a well-placed stop loss.
📈 Trade wisely and monitor price action for confirmation! 🚀

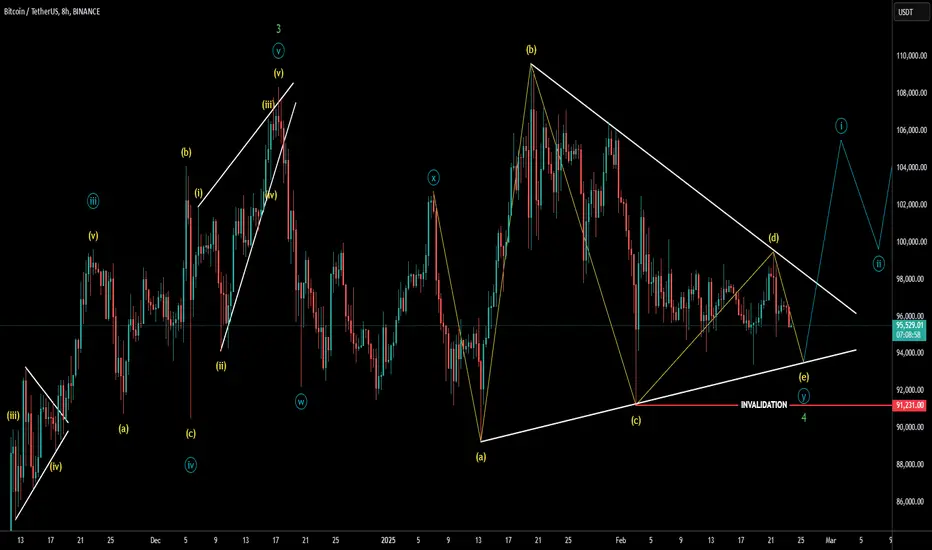
BTC END OF CORRECTIONAfter being stuck in this sideways correction for almost 70 days, #BTC is finally coming to the end of this consolidation in the next 24-72 hours. It's not common that we get a double three correction (WXY) starting with a sharp zigzag wave W and ending with a huge expanded triangle for wave Y, so this correction is one for the history books. I really hope you have your longs stacked up during this final drop as we're going to take off any moment to new all-time highs, probably to $130K or more.
Lehar FootwearsPromoters has increased the stake.
Strong Monthly Support near 195
Low Selling Volume
Stock has retraced and trading between 0.618 and 0.786 Fib levels.
Trendline Breakout, will result in Descending Triangle Breakout.
*Budget*
Special mention of Footwears.
Target 280+

Potential 70-90x Gains | SCBINANCE:SCUSDT has been forming a massive 4+ year triangle pattern. Since 2023, it has repeatedly tested the lower trendline and successfully bounced.
Before its 2021 surge, SC formed an inverse head and shoulders.
The current price action looks like it's repeating on a larger scale, with SC now testing the bottom of the right shoulder.
Target Prices:
📈 $0.29 (Inverse H&S projection, ~70x from current price)
📈 $0.37 (Fibonacci projection, ~90x from current price)
Take-Profit Strategy:
🔹 Every 10x, sell at least half
🔹 At 70x, exit 90% and hold only profit coins for further upside if the bull market continues
Why Now Might Be a Good Entry:
CAPITALCOM:SCUSD has dipped below the triangle’s lower boundary but is currently bouncing from a key multi-year support zone (pink area).
Since its OKX listing in 2018, this level has acted as both strong support and resistance for over six years.
On 2/3, price briefly dropped below but quickly reclaimed it, confirming its strength.
💥 Long Strategy:
Aggressive: Enter at current price
Conservative: Enter at 2/17’s high, which is the highest-volume lately
Stop-loss: 2/3's low
💥 Short Strategy:
Aggressive: Enter at current price
Conservative: Enter at 2/3's low
Stop-loss: 2/17's high
⚠️ Price levels vary across exchanges—adjust accordingly.
🔴 Read my signature & publications for more info you don’t want to miss.
🔥 for more future "guesses" like this!

EURNZD AnalysisEURNZD Analysis
The EURNZD pair is currently in a bearish trend on the daily time frame, making it a favorable candidate for short positions. Notably, on the 4-hour chart, the pair has broken out of a sideways rectangle pattern, retested the breakout level, and is now expected to move lower toward the next structural support level. This price action reinforces the bearish momentum and suggests further downside potential.
In my view, the bearish outlook for EURNZD is well-supported by the confirmed breakout and retest of the rectangle pattern, coupled with the broader downtrend on the daily chart. However, it is crucial to monitor how the price behaves around the next support level. A decisive break below this level would likely confirm the continuation of the downtrend, while a rejection or consolidation could signal a temporary pause or reversal.
What are your thoughts on this analysis? Are there any additional factors or levels you believe should be considered?

USDJPY → Retest of key resistance before fallingFX:USDJPY breaks the bullish structure of the market. Dolla in the correction phase has a favorable impact on the market. The currency pair is forming a retest of the previously broken trendline after a strong impulse
The yen reached a 10-week high on Thursday, causing the USDJPY pair to fall to 149.5. Investors are looking for safe-haven assets due to increased trade tensions caused by Donald Trump's aggressive tariff policy.
The Japanese currency received additional support due to expectations of an interest rate hike by the Bank of Japan, which will increase its attractiveness for investors
For now, the focus is on the 0.5 fibo resistance zone, 150.95, and previously broken upside support
Support levels: 149.5, 148.64
Resistance levels: 150.95, 151.4
Most likely, before a possible fall, the price will be able to test the previously broken support, and now it is resistance 150.95 - 151.4. False breakdown of the key Fibo zones may provoke further fall.
Regards R. Linda!

Bitcoin Outlook after the Dip. What to expect NOW?Bitcoin will break upwards at the end of this ascending triangle, and all of you will be astonished.
Give me some energy !!
✨We spend hours finding potential opportunities and writing useful ideas, we would be happy if you support us.
Best regards CobraVanguard.💚
_ _ _ _ __ _ _ _ _ _ _ _ _ _ _ _ _ _ _ _ _ _ _ _ _ _ _ _ _ _ _ _
✅Thank you, and for more ideas, hit ❤️Like❤️ and 🌟Follow🌟!
⚠️Things can change...
The markets are always changing and even with all these signals, the market changes tend to be strong and fast!!

NASDAQ Future long: after resitance broken, new support formed Current Analysis: Nasdaq futures are currently facing a critical support at 22100
I see the chance of a Bullish rebound:
Support Strength: This support was a resistance in past weeks, then it was broken on Feb 14th and act as support in last 3 days.
Additionally, from Dec. 17th to February 12th, price formed a triangle that was broken up on Feb.13th.
Expected Movement: If the price successfully breaks above 22100, I expect it to rally towards the $22400 area.
Action Plan:
Entry Point: entered long with limit order at 22100
Target: Set a target in the $22425 (high of December 17th)
Stop Loss: Place a stop loss at 21937.75, below minimum of Feb.20th and with Risk/Reward Ratio of 2.

Bitcoin can leave triangle and reach 100K pointsHello traders, I want share with you my opinion about Bitcoin. Analyzing this chart, we can see that a few days ago, the price dropped below the resistance level, which aligned with the seller zone, breaking through it. After that, BTC began to rise near the support line and soon broke through the 102500 level again, climbing even higher than the seller zone. Following this move, BTC reversed and started declining within a descending triangle, eventually breaking the 102500 level once more and dropping into the buyer zone. Afterward, the price made a strong upward impulse toward the resistance level but soon began to pull back. Not long after, the price fell to the support level, bounced from the 94,000 mark, and climbed back to the resistance line of the triangle. Shortly after, BTC once again dropped to the support line before starting to rise again. Currently, it is trading very close to the resistance line of the triangle. In my view, BTCUSDT is likely to reach 100K points, leading to a breakout from the triangle. Please share this idea with your friends and click Boost 🚀

triangle breakout waited for the re-test and executed, triangle breakouts are one of the best patterns due to how simple they are,
