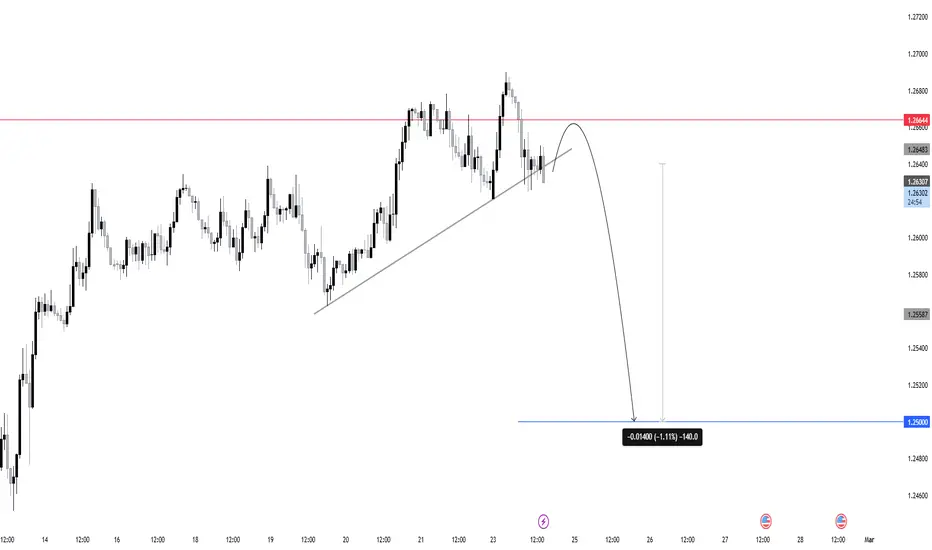
Gold might descend to a support level, breaching the resistance Hi, traders. I'd like to share with you my thoughts on Gold. On this chart, we can observe that the price has recovered from the mirror line and begun to rise. Shortly later, it approached the support level, broke it, and hovered for a while before returning to the mirror line. Later, the price broke through the support level once more and resumed trading inside a range. During this phase, it climbed to the resistance level, which coincided with the seller zone, before retreating to the mirror line. Gold then dipped into the buyer zone before quickly rising over the mirror line and into the seller zone. Following this movement, XAU corrected below the mirror line and resumed its upward journey. Shortly later, the price approached the resistance level, broke through it, and departed the range. For a while, gold traded above the seller zone, but it subsequently plummeted and is presently hovering at the 2930 resistance level within the sale zone. I anticipate Gold will climb little before continuing to drop, eventually shattering the resistance level. Furthermore, I believe that following the breakout, it will prolong its slide toward the 2865 support level. Please share this idea with your friends and click Boost! 🚀
:
📉 XAU/USD - Bearish Reversal from Seller Zone! 🚨
💰 Gold Spot (XAU/USD) - 1H Chart Analysis
Key Insights:
🔹 Resistance Level Held Strong – Price tested the seller zone but failed to break through, signaling strong bearish momentum.
🔹 Buyer Zone Played Out – Earlier, buyers pushed the price up from a strong accumulation zone, but exhaustion is visible now.
🔹 False Breakout & Range Formation – A range developed at the top, indicating distribution before a potential drop.
🔹 Support Level in Sight – If the price follows the projected path, we might see a test of the $2,865 - $2,850 zone soon.
📊 Trading Plan:
📌 Bearish Bias: Look for short opportunities as long as price stays below resistance.
📌 Confirmation Needed: A break below $2,930 would strengthen bearish sentiment.
📌 Targets: $2,900, then $2,865 - $2,850.
🚀 What do you think? Will gold break down or bounce back? Drop your thoughts in the comments! 👇🔥
#gold #xauusd #trading #forex #priceaction #technicalanalysis
USD

Dollar Index Bullish to $111.350 (UPDATE)I’ve re-counted the waves, as analysed on the chart above.
⭕️3 Sub-Wave Correction (A,B,C) relabelled.
⭕️Main Supply Zone highlighted.
⭕️Alternative Bias Also Shown.

GBP/USD Wedge Breakout (24.2.25)The GBP/USD Pair on the M30 timeframe presents a Potential Selling Opportunity due to a recent Formation of a Wedge Breakout Pattern. This suggests a shift in momentum towards the downside in the coming hours.
Possible Short Trade:
Entry: Consider Entering A Short Position around Trendline Of The Pattern.
Target Levels:
1st Support – 1.2567
2nd Support – 1.2515
🎁 Please hit the like button and
🎁 Leave a comment to support for My Post !
Your likes and comments are incredibly motivating and will encourage me to share more analysis with you.
Best Regards, KABHI_TA_TRADING
Thank you.

GBPUSD A Bearish Shift in the MakingThe chart highlights a key overhead resistance (red line). Price has tested this level and appears to be struggling to break above it decisively. This resistance zone is likely attracting sellers who are defending it vigorously.
After failing to break above the resistance, the market seems to be forming a lower high. This shift in structure can be an early warning of a bearish reversal, as buyers lose momentum and sellers begin to gain control.
The blue horizontal line marks a significant support zone. The chart’s projected path indicates a potential move down toward this area, suggesting that sellers might push the price lower if immediate support levels fail to hold.
USDCHF INTRADAY testing important support at 0.8946 The USDCHF currency pair price action sentiment appears bullish, supported by the longer-term prevailing uptrend. The recent intraday price action appears to be a sideways consolidation towards the rising support zone.
The key trading level is at 0.8946, the previous consolidation price range, and the rising support trendline (Daily timeframe) zone. A corrective pullback from the current levels and a bullish bounce back from the 0.8946 level could target the upside resistance at 0.9033 followed by the 0.9087 and 0.9120 levels over the longer timeframe.
Alternatively, a confirmed loss of the 0.8946 support and a daily close below that level would negate the bullish outlook opening the way for a further retracement and a retest of 0.8913 support level followed by 0.8860.
This communication is for informational purposes only and should not be viewed as any form of recommendation as to a particular course of action or as investment advice. It is not intended as an offer or solicitation for the purchase or sale of any financial instrument or as an official confirmation of any transaction. Opinions, estimates and assumptions expressed herein are made as of the date of this communication and are subject to change without notice. This communication has been prepared based upon information, including market prices, data and other information, believed to be reliable; however, Trade Nation does not warrant its completeness or accuracy. All market prices and market data contained in or attached to this communication are indicative and subject to change without notice.

EURUSD Will it follow Trump's 1st Term??The EURUSD pair made a market bottom on January 13 2025 and in recent trade, it has been consolidating above the 1D MA50 (blue trend-line). Interestingly enough, this is so far similar to the price action that preceded and followed Trump's 1st Term.
A 1D Death Cross took the market from the November 2016 elections to the January 2017 bottom. After a 1D RSI Double Top and Resistance rejection, the pair dropped again below the 1D MA50 (blue trend-line) but recovered to reach the 1D MA200 (orange trend-line) in end of March 2017 and initiate an aggressive Channel Up that peaked on the 1.618 Fibonacci extension from the September 2016 High.
If EURUSD continues to replicate Trump's Year 1 of his 1st Term, it is possible to see the price reach 1.19000 by the end of 2025, although of course we can't rely solely on repetitive patterns, but have to go along macro reports and policies one at a time.
-------------------------------------------------------------------------------
** Please LIKE 👍, FOLLOW ✅, SHARE 🙌 and COMMENT ✍ if you enjoy this idea! Also share your ideas and charts in the comments section below! This is best way to keep it relevant, support us, keep the content here free and allow the idea to reach as many people as possible. **
-------------------------------------------------------------------------------
Disclosure: I am part of Trade Nation's Influencer program and receive a monthly fee for using their TradingView charts in my analysis.
💸💸💸💸💸💸
👇 👇 👇 👇 👇 👇

GBPUSD - Down We Go!Hello TradingView Family / Fellow Traders. This is Richard, also known as theSignalyst.
📈GBPUSD has been overall bullish, trading within the rising channel marked in red.
However, it is currently retesting the upper bound of the channel which lines up perfectly with the resistance zone marked in blue.
📉As per my trading style, as long as the resistance zone holds, I will be looking for sell setups on lower timeframes.
📚 Always follow your trading plan regarding entry, risk management, and trade management.
Good luck!
All Strategies Are Good; If Managed Properly!
~Rich
Disclosure: I am part of Trade Nation's Influencer program and receive a monthly fee for using their TradingView charts in my analysis.

EURO LIFTS POST-GERMAN VOTE—BUT USD BITES BACKEURO LIFTS POST-GERMAN VOTE—BUT USD BITES BACK FX:EURUSD
(1/9)
Good morning, Tradingview Fam! Germany’s election—Merz and CDU on top—gave the euro a quick jolt, up 0.44% to $1.0507 📈🔥. Markets dig the stability vibe, but it’s fading fast—let’s unpack this tussle! 🚀
(2/9) – ELECTION SPARK
• Euro Bump: Hit $1.0530 overnight—election cheer 💥
• Markets: DAX futures up 1.2%, EUROSTOXX 50 +0.66% 📊
• Fade: Now at $1.0480—USD’s flexing back
Brief lift—stability’s sweet, but not sticky!
(3/9) – TECH TELLTALE
• Resistance: $1.0500-1.0510 wall holds firm 🌍
• Support: $1.0470 pivot, then $1.0440 if it slips 🚗
• Charts: Double top whispers at $1.0530 🌟
Traders on X see a retreat—bearish juice brewing?
(4/9) – USD PUSHBACK
• Jobless Claims: Weak last week, USD softened a tad 📉
• Fed: No rush to cut—rates steady, Nvidia looms
• Muscle: Dollar’s clawing back—ballast holds
AMEX:USD ’s got grit—euro’s nudge ain’t enough! 🌍
(5/9) – RISKS IN PLAY
• Volatility: PMI data, Nvidia earnings stir the pot ⚠️
• Sentiment: X split—liquidity grab or bear turn? 🏛️
• Levels: Below $1.0470 opens $1.0390 risk 📉
Quick sprint—can euro keep the pace?
(6/9) – SWOT: STRENGTHS
• Election Lift: CDU win sparks euro hope 🌟
• Markets: European futures pop—optimism flows 🔍
• Cash: $1.0530 peak shows buyer guts 🚦
Euro’s got some spark—briefly lit!
(7/9) – SWOT: WEAKNESSES & OPPORTUNITIES
• Weaknesses: $1.0510 cap, USD fights back 💸
• Opportunities: PMI beats could push $1.0600 🌍
Will euro dodge the dollar’s jab?
(8/9) – Euro’s election bump—what’s your call?
1️⃣ Bullish—Stability wins out.
2️⃣ Neutral—Blip, not a trend.
3️⃣ Bearish—USD takes the ring.
Vote below! 🗳️👇
(9/9) – FINAL TAKEAWAY
Euro spiked to $1.0507 on Germany’s vote—CDU’s steady hand 🌍🪙. Now $1.0480—USD’s got claws. Resistance bites, downside looms—blip or bust?
USD/JPY Bearish Breakdown: Eyes on 148.39 Support! USD/JPY Technical Analysis – February 24, 2025
USD/JPY continues its bearish momentum, having already broken below 149.67, confirming further downside pressure. The price is now stabilizing around 149.33, and as long as it remains below the 151.04 resistance, the bearish trend is intact.
A further drop toward the 148.39 support zone is now likely, with an extended bearish target at 147.82.
However, a potential correction toward 151.04 - 151.79 could occur before continuing downward. If USD/JPY reclaims 151.04, it could become volatile and attempt a push toward 151.79 before deciding on the next direction.
Key Levels to Watch:
Pivot Point: 149.678
Resistance Levels: 151.04, 151.79, 152.64
Support Levels: 148.39, 147.82, 146.33
📉 Directional Bias:
Bearish continuation expected toward 148.39 - 147.82 as long as below 149.67
💬 Will USD/JPY reach 148.39 next, or will it retrace before another drop? Let’s watch the price action! 🚀🔥

Potential bullish rise?The Fiber (EUR/USD) has bounced off the pivot which is a pullback support and could rise to the 1st resistance which has been identified as a pullback resistance.
Pivot: 1.0402
1st Support: 1.0293
1st Resistance: 1.0601
Risk Warning:
Trading Forex and CFDs carries a high level of risk to your capital and you should only trade with money you can afford to lose. Trading Forex and CFDs may not be suitable for all investors, so please ensure that you fully understand the risks involved and seek independent advice if necessary.
Disclaimer:
The above opinions given constitute general market commentary, and do not constitute the opinion or advice of IC Markets or any form of personal or investment advice.
Any opinions, news, research, analyses, prices, other information, or links to third-party sites contained on this website are provided on an "as-is" basis, are intended only to be informative, is not an advice nor a recommendation, nor research, or a record of our trading prices, or an offer of, or solicitation for a transaction in any financial instrument and thus should not be treated as such. The information provided does not involve any specific investment objectives, financial situation and needs of any specific person who may receive it. Please be aware, that past performance is not a reliable indicator of future performance and/or results. Past Performance or Forward-looking scenarios based upon the reasonable beliefs of the third-party provider are not a guarantee of future performance. Actual results may differ materially from those anticipated in forward-looking or past performance statements. IC Markets makes no representation or warranty and assumes no liability as to the accuracy or completeness of the information provided, nor any loss arising from any investment based on a recommendation, forecast or any information supplied by any third-party.

Heading into pullback resistance?The Cable (GBP/USD) is rising towards the pivot which has been identified as a pullback resistance and could drop to the 1st support.
Pivot: 1.2768
1st Support: 1.2496
1st Resistance: 1.3037
Risk Warning:
Trading Forex and CFDs carries a high level of risk to your capital and you should only trade with money you can afford to lose. Trading Forex and CFDs may not be suitable for all investors, so please ensure that you fully understand the risks involved and seek independent advice if necessary.
Disclaimer:
The above opinions given constitute general market commentary, and do not constitute the opinion or advice of IC Markets or any form of personal or investment advice.
Any opinions, news, research, analyses, prices, other information, or links to third-party sites contained on this website are provided on an "as-is" basis, are intended only to be informative, is not an advice nor a recommendation, nor research, or a record of our trading prices, or an offer of, or solicitation for a transaction in any financial instrument and thus should not be treated as such. The information provided does not involve any specific investment objectives, financial situation and needs of any specific person who may receive it. Please be aware, that past performance is not a reliable indicator of future performance and/or results. Past Performance or Forward-looking scenarios based upon the reasonable beliefs of the third-party provider are not a guarantee of future performance. Actual results may differ materially from those anticipated in forward-looking or past performance statements. IC Markets makes no representation or warranty and assumes no liability as to the accuracy or completeness of the information provided, nor any loss arising from any investment based on a recommendation, forecast or any information supplied by any third-party.

Could the price bounce from here?USD/JPY is falling towards the pivot and could bouncer to the pullback resistance.
Pivot: 149.28
1st Support: 146.90
1st Resistance: 151.23
Risk Warning:
Trading Forex and CFDs carries a high level of risk to your capital and you should only trade with money you can afford to lose. Trading Forex and CFDs may not be suitable for all investors, so please ensure that you fully understand the risks involved and seek independent advice if necessary.
Disclaimer:
The above opinions given constitute general market commentary, and do not constitute the opinion or advice of IC Markets or any form of personal or investment advice.
Any opinions, news, research, analyses, prices, other information, or links to third-party sites contained on this website are provided on an "as-is" basis, are intended only to be informative, is not an advice nor a recommendation, nor research, or a record of our trading prices, or an offer of, or solicitation for a transaction in any financial instrument and thus should not be treated as such. The information provided does not involve any specific investment objectives, financial situation and needs of any specific person who may receive it. Please be aware, that past performance is not a reliable indicator of future performance and/or results. Past Performance or Forward-looking scenarios based upon the reasonable beliefs of the third-party provider are not a guarantee of future performance. Actual results may differ materially from those anticipated in forward-looking or past performance statements. IC Markets makes no representation or warranty and assumes no liability as to the accuracy or completeness of the information provided, nor any loss arising from any investment based on a recommendation, forecast or any information supplied by any third-party.

Bullish bounce off pullback support?The Swissie (USD/CHF) is falling towards the pivot which has been identified as a pullback support and could bounce to the 1st resistance.
Pivot: 0.8864
1st Support: 0.8763
1st Resistance: 0.9045
Risk Warning:
Trading Forex and CFDs carries a high level of risk to your capital and you should only trade with money you can afford to lose. Trading Forex and CFDs may not be suitable for all investors, so please ensure that you fully understand the risks involved and seek independent advice if necessary.
Disclaimer:
The above opinions given constitute general market commentary, and do not constitute the opinion or advice of IC Markets or any form of personal or investment advice.
Any opinions, news, research, analyses, prices, other information, or links to third-party sites contained on this website are provided on an "as-is" basis, are intended only to be informative, is not an advice nor a recommendation, nor research, or a record of our trading prices, or an offer of, or solicitation for a transaction in any financial instrument and thus should not be treated as such. The information provided does not involve any specific investment objectives, financial situation and needs of any specific person who may receive it. Please be aware, that past performance is not a reliable indicator of future performance and/or results. Past Performance or Forward-looking scenarios based upon the reasonable beliefs of the third-party provider are not a guarantee of future performance. Actual results may differ materially from those anticipated in forward-looking or past performance statements. IC Markets makes no representation or warranty and assumes no liability as to the accuracy or completeness of the information provided, nor any loss arising from any investment based on a recommendation, forecast or any information supplied by any third-party.

Falling towards 50% Fibonacci support?The Loonie (USD/CAD) is falling towards the pivot which is a pullback support and could bounce to he 1st resistance which has been identified as a pullback resistance.
Pivot: 1.4093
1st Support: 1.3953
1st Resistance: 1.4279
Risk Warning:
Trading Forex and CFDs carries a high level of risk to your capital and you should only trade with money you can afford to lose. Trading Forex and CFDs may not be suitable for all investors, so please ensure that you fully understand the risks involved and seek independent advice if necessary.
Disclaimer:
The above opinions given constitute general market commentary, and do not constitute the opinion or advice of IC Markets or any form of personal or investment advice.
Any opinions, news, research, analyses, prices, other information, or links to third-party sites contained on this website are provided on an "as-is" basis, are intended only to be informative, is not an advice nor a recommendation, nor research, or a record of our trading prices, or an offer of, or solicitation for a transaction in any financial instrument and thus should not be treated as such. The information provided does not involve any specific investment objectives, financial situation and needs of any specific person who may receive it. Please be aware, that past performance is not a reliable indicator of future performance and/or results. Past Performance or Forward-looking scenarios based upon the reasonable beliefs of the third-party provider are not a guarantee of future performance. Actual results may differ materially from those anticipated in forward-looking or past performance statements. IC Markets makes no representation or warranty and assumes no liability as to the accuracy or completeness of the information provided, nor any loss arising from any investment based on a recommendation, forecast or any information supplied by any third-party.

Bullish rise?The Aussie (AUD/USD) has reacted off the pivot and could potentially rise to the 1st resistance.
Pivot: 0.6313
1st Support: 0.6144
1st Resistance: 0.6448
Risk Warning:
Trading Forex and CFDs carries a high level of risk to your capital and you should only trade with money you can afford to lose. Trading Forex and CFDs may not be suitable for all investors, so please ensure that you fully understand the risks involved and seek independent advice if necessary.
Disclaimer:
The above opinions given constitute general market commentary, and do not constitute the opinion or advice of IC Markets or any form of personal or investment advice.
Any opinions, news, research, analyses, prices, other information, or links to third-party sites contained on this website are provided on an "as-is" basis, are intended only to be informative, is not an advice nor a recommendation, nor research, or a record of our trading prices, or an offer of, or solicitation for a transaction in any financial instrument and thus should not be treated as such. The information provided does not involve any specific investment objectives, financial situation and needs of any specific person who may receive it. Please be aware, that past performance is not a reliable indicator of future performance and/or results. Past Performance or Forward-looking scenarios based upon the reasonable beliefs of the third-party provider are not a guarantee of future performance. Actual results may differ materially from those anticipated in forward-looking or past performance statements. IC Markets makes no representation or warranty and assumes no liability as to the accuracy or completeness of the information provided, nor any loss arising from any investment based on a recommendation, forecast or any information supplied by any third-party.

Potential bullish rise?The Kiwi (NZD/USD) has bounced off the pivot and could rise to the 1st resistance.
Pivot: 0.5686
1st Support: 0.5542
1st Resistance: 0.5827
Risk Warning:
Trading Forex and CFDs carries a high level of risk to your capital and you should only trade with money you can afford to lose. Trading Forex and CFDs may not be suitable for all investors, so please ensure that you fully understand the risks involved and seek independent advice if necessary.
Disclaimer:
The above opinions given constitute general market commentary, and do not constitute the opinion or advice of IC Markets or any form of personal or investment advice.
Any opinions, news, research, analyses, prices, other information, or links to third-party sites contained on this website are provided on an "as-is" basis, are intended only to be informative, is not an advice nor a recommendation, nor research, or a record of our trading prices, or an offer of, or solicitation for a transaction in any financial instrument and thus should not be treated as such. The information provided does not involve any specific investment objectives, financial situation and needs of any specific person who may receive it. Please be aware, that past performance is not a reliable indicator of future performance and/or results. Past Performance or Forward-looking scenarios based upon the reasonable beliefs of the third-party provider are not a guarantee of future performance. Actual results may differ materially from those anticipated in forward-looking or past performance statements. IC Markets makes no representation or warranty and assumes no liability as to the accuracy or completeness of the information provided, nor any loss arising from any investment based on a recommendation, forecast or any information supplied by any third-party.

Bearish drop off pullback resistance?GBP/USD has reacted off the resistance level which is a pullback resistance that is slightly below the 161.8% Fibonacci extension and could drop from this level to our take profit.
Entry: 1.2661
Why we like it:
There is a pullback resistance level that is slightly below the 161.8% Fibonacci extension.
Stop loss: 1.2719
Why we like it:
There is an overlap resistance level.
Take profit: 1.2563
Why we like it:
There is an overlap support level that is slightly above the 38.2% Fibonacci retracement.
Enjoying your TradingView experience? Review us!
Please be advised that the information presented on TradingView is provided to Vantage (‘Vantage Global Limited’, ‘we’) by a third-party provider (‘Everest Fortune Group’). Please be reminded that you are solely responsible for the trading decisions on your account. There is a very high degree of risk involved in trading. Any information and/or content is intended entirely for research, educational and informational purposes only and does not constitute investment or consultation advice or investment strategy. The information is not tailored to the investment needs of any specific person and therefore does not involve a consideration of any of the investment objectives, financial situation or needs of any viewer that may receive it. Kindly also note that past performance is not a reliable indicator of future results. Actual results may differ materially from those anticipated in forward-looking or past performance statements. We assume no liability as to the accuracy or completeness of any of the information and/or content provided herein and the Company cannot be held responsible for any omission, mistake nor for any loss or damage including without limitation to any loss of profit which may arise from reliance on any information supplied by Everest Fortune Group.

Bearish drop?USD/CHF has rejected off the resistance level which is a pullback resistance and could potentially drop from this level to our take profit.
Entry: 0.9001
Why we like it:
There is a pullback resistance level.
Stop loss: 0.9048
Why we like it:
There is a pullback resistance level.
Take profit: 0.8945
Why we like it:
There is a pullback support level that line sup with the 127.2% Fibonacci extension.
Enjoying your TradingView experience? Review us!
Please be advised that the information presented on TradingView is provided to Vantage (‘Vantage Global Limited’, ‘we’) by a third-party provider (‘Everest Fortune Group’). Please be reminded that you are solely responsible for the trading decisions on your account. There is a very high degree of risk involved in trading. Any information and/or content is intended entirely for research, educational and informational purposes only and does not constitute investment or consultation advice or investment strategy. The information is not tailored to the investment needs of any specific person and therefore does not involve a consideration of any of the investment objectives, financial situation or needs of any viewer that may receive it. Kindly also note that past performance is not a reliable indicator of future results. Actual results may differ materially from those anticipated in forward-looking or past performance statements. We assume no liability as to the accuracy or completeness of any of the information and/or content provided herein and the Company cannot be held responsible for any omission, mistake nor for any loss or damage including without limitation to any loss of profit which may arise from reliance on any information supplied by Everest Fortune Group.

Heading into pullback resistance?USD/CAD is rising towards the resistance level which is a pullback resistance that is slightly above the 50% Fibonacci retracement and could reverse from this level to our take profit.
Entry: 1.4280
Why we like it:
There is a pullback resistance level that is slightly above the 50% Fibonacci retracement.
Stop loss: 1.4404
Why we like it:
There is an overlap resistance level that aligns with the 38.2% Fibonacci retracement.
Take profit: 1.4100
Why we like it:
There is a pullback support level.
Enjoying your TradingView experience? Review us!
Please be advised that the information presented on TradingView is provided to Vantage (‘Vantage Global Limited’, ‘we’) by a third-party provider (‘Everest Fortune Group’). Please be reminded that you are solely responsible for the trading decisions on your account. There is a very high degree of risk involved in trading. Any information and/or content is intended entirely for research, educational and informational purposes only and does not constitute investment or consultation advice or investment strategy. The information is not tailored to the investment needs of any specific person and therefore does not involve a consideration of any of the investment objectives, financial situation or needs of any viewer that may receive it. Kindly also note that past performance is not a reliable indicator of future results. Actual results may differ materially from those anticipated in forward-looking or past performance statements. We assume no liability as to the accuracy or completeness of any of the information and/or content provided herein and the Company cannot be held responsible for any omission, mistake nor for any loss or damage including without limitation to any loss of profit which may arise from reliance on any information supplied by Everest Fortune Group.

Gold might descend to a support level, breaching the resistance Hi, traders. I'd like to share with you my thoughts on Gold. On this chart, we can observe that the price has recovered from the mirror line and begun to rise. Shortly later, it approached the support level, broke it, and hovered for a while before returning to the mirror line. Later, the price broke through the support level once more and resumed trading inside a range. During this phase, it climbed to the resistance level, which coincided with the seller zone, before retreating to the mirror line. Gold then dipped into the buyer zone before quickly rising over the mirror line and into the seller zone. After this movement, XAU corrected below the mirror line and resumed its upward journey.
Shortly later, the price approached the resistance level, broke through it, and departed the range. For a while, gold traded above the seller zone, but it subsequently plummeted and is presently hovering at the 2930 resistance level within the sale zone. I anticipate Gold will climb little before continuing to drop, eventually shattering the resistance level. Furthermore, I believe that following the breakout, it will prolong its slide toward the 2865 support level. Please share this idea with your friends and click Boost! 🚀
📊 XAU/USD – Key Levels for the Week Ahead 🔍
Gold (XAU/USD) is trading within a well-defined range, testing the seller zone near resistance while eyeing the buyer zone near support.
🔴 Resistance Level: 2,930 - 2,940 (Seller Zone)
🟢 Support Level: 2,865 (Buyer Zone)
📉 Potential Scenarios:
1️⃣ Bearish Rejection from resistance could push price down to the support level (2,865).
2️⃣ Breakout Above 2,940 may signal further upside potential.
3️⃣ Range-Bound Movement between support and resistance until a clear breakout.
📌 Market Outlook: Watching price action near key levels for confirmation before entering trades! 🚀

Bullish bounce?EUR/USD is falling towards the support level which is an overlap support and could bounce from this level to our take profit.
Entry: 1.0419
Why we like it:
There is an overlap support level.
Stop loss: 1.0373
Why we like it:
There is a pullback support level that aligns with the 61.8% Fibonacci retracement.
Take profit: 1.0508
Why we like it:
There is a pullback resistance level.
Enjoying your TradingView experience? Review us!
Please be advised that the information presented on TradingView is provided to Vantage (‘Vantage Global Limited’, ‘we’) by a third-party provider (‘Everest Fortune Group’). Please be reminded that you are solely responsible for the trading decisions on your account. There is a very high degree of risk involved in trading. Any information and/or content is intended entirely for research, educational and informational purposes only and does not constitute investment or consultation advice or investment strategy. The information is not tailored to the investment needs of any specific person and therefore does not involve a consideration of any of the investment objectives, financial situation or needs of any viewer that may receive it. Kindly also note that past performance is not a reliable indicator of future results. Actual results may differ materially from those anticipated in forward-looking or past performance statements. We assume no liability as to the accuracy or completeness of any of the information and/or content provided herein and the Company cannot be held responsible for any omission, mistake nor for any loss or damage including without limitation to any loss of profit which may arise from reliance on any information supplied by Everest Fortune Group.

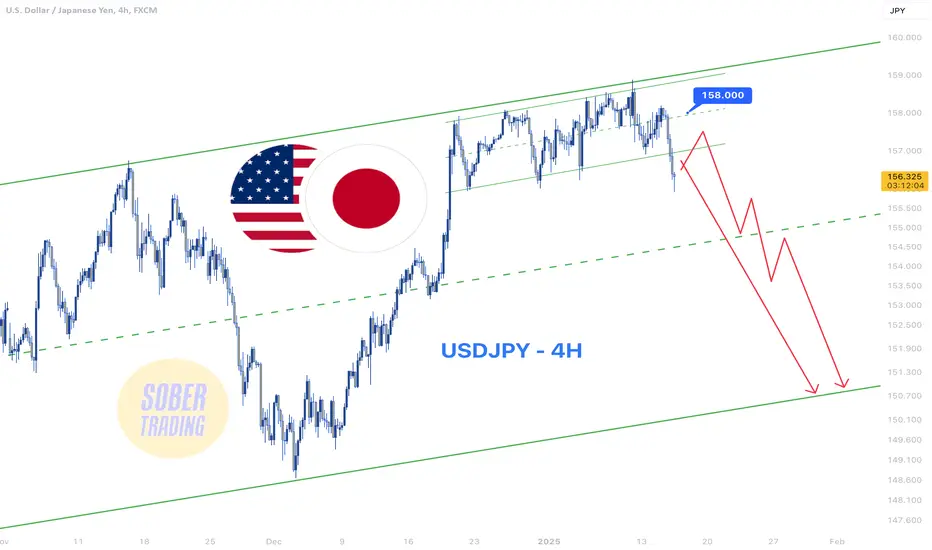
USDJPY - 4H Short Opportunities Amid DowntrendFollowing the sharp fall in FX:USDJPY after PPI and CPI news, we expect further downside, potentially reaching the middle or bottom of the channel. 📉
Each push-up could be a short entry opportunity. Even a strong rise below 158 might be a dead cat bounce and a better short entry point. Stay cautious and strategic! 🔻
Gold can drop to support level, breaking resistance levelHello traders, I want share with you my opinion about Gold. On this chart, we can see that the price rebounded from the mirror line and began to rise. Shortly after, it reached the support level, broke it, and hovered around this area for some time before dropping back to the mirror line. Later, the price broke through the support level once again and started trading within a range. During this phase, it climbed to the resistance level, which aligned with the seller zone, before pulling back to the mirror line. Gold then dipped into the buyer zone but quickly surged above the mirror line, entering the seller zone. After this movement, XAU corrected below the mirror line before resuming its upward trajectory. Not long after, the price reached the resistance level, broke through it, and exited the range. For some time, Gold traded above the seller zone, but recently, it dropped and is now hovering near the 2930 resistance level within the seller zone. I believe that Gold might rise slightly before continuing its decline, eventually breaking the resistance level. Additionally, I anticipate that after the breakout, it could extend its decline toward the 2865 support level. Please share this idea with your friends and click Boost 🚀
