USDCHF Potential DownsidesHey Traders, in today's trading session we are monitoring USDCHF 0.88500 zone, USDCHF is trading in a downtrend and currently is in a correction phase in which it is approaching the trend at 0.88500 support and resistance area.
Trade safe, Joe.
USD
OIL / WTI PoV - LONGThe analysis of the current oil price highlights the $65/66 range as a critical level for a potential rally. After a period of consolidation and corrections in recent weeks, oil seems to have found strong support around these levels, with prices oscillating between $65 and $66 per barrel. These levels represent an important liquidity zone, as in the past, the price has found support here, suggesting that there could be an opportunity for a bullish rebound if the price manages to remain stable above this threshold.
A rally above the $65/66 level could be supported by several fundamental factors, including improved demand prospects, a reduction in global inventories, and potential policies from OPEC. If demand for oil increases, especially with economic recoveries in certain regions or a rise in industrial production globally, there could be further support for prices. Additionally, OPEC+'s stance in the production-limiting agreement and potential supply cuts could keep the market tight, pushing prices higher.
Geopolitical dynamics also play a significant role in determining the direction of oil. Any tensions or disruptions in supply from key producing countries, such as those in the Middle East, could serve as catalysts for further price increases. Another factor that could support prices is the depreciation of the dollar, which typically benefits oil, as the commodity is priced in dollars.
However, if the price fails to maintain stability above the $65/66 level, we might see a new correction phase, with prices possibly retreating to lower levels. A move away from these levels could mark the beginning of a new bearish phase, with the risk of prices sliding back towards $60 per barrel or even lower if demand weakens or if there are supply excesses in the market.
In summary, the $65/66 level is crucial for the price of oil. Maintaining or closing above these levels could pave the way for a rally, while failure to do so could lead to further price weakening. With OPEC+ policies playing a key role in balancing the market, the next few months will be critical in determining the future direction of oil prices.

EURUSD PoVIn recent months, inflation data in both Europe and the United States has shown contrasting trends, creating an uncertain outlook for the EUR/USD pair. In Europe, inflation has remained relatively stable, but with signs of a slight increase, while in the United States, there has been a more pronounced rise in consumer prices. This scenario has prompted the European Central Bank and the Federal Reserve to carefully assess their respective monetary policies, with potential interest rate hikes in the future. At the same time, recent trade policies under U.S. President Donald Trump have added further volatility to the currency market. In February 2025, Trump imposed significant tariffs on imports from Mexico, Canada, and China, raising global concerns. The European Union criticized the Trump administration for not engaging in negotiations to avoid such tariffs, increasing trade tensions. Trump's actions, including the introduction of a universal 10% tariff on all imports and a 100% tariff on cars produced abroad, have raised questions about their effectiveness in strengthening the U.S. economy and reducing the trade deficit. If these policies do not produce the expected results, we could see the dollar weaken, with the EUR/USD pair potentially surpassing the 1.09300 level, a liquidity intersection point. On the other hand, if Trump's measures prove effective in improving the trade balance and supporting the economy, the dollar could strengthen, pushing the EUR/USD pair towards parity. In summary, the future direction of the EUR/USD pair appears uncertain, influenced by central bank policies and U.S. trade strategies, with potential significant movements depending on the effectiveness of these measures.

BTC PoV The projection of a potential rise in Bitcoin (BTC) starting from liquidity points at 75K, 65K, and 57K suggests a recovery dynamic from a bearish phase. If BTC were to rise above the 75,000 USD level, it could trigger a significant bullish push, as this is an important resistance level that, once broken, would open the way for new highs. This would mark the end of a correction and the resumption of the bullish trend. On the other hand, if the price were to drop to 65,000 USD, this level could represent an accumulation opportunity, with a potential recovery from this zone, confirmed by an upward movement. In a worse-case scenario, if BTC were to fall to 57,000 USD, it would be a key support level, a zone where the market could attempt a rebound. If the buyers' response were positive, BTC could find the strength to rise again and resume its bullish trend. Essentially, the liquidity points at 75K, 65K, and 57K are critical levels in determining the future direction of BTC, with a potential recovery depending on the market’s reaction to these supports and resistances.
In parallel, a potential recession in the United States could directly impact the value of the dollar, with significant implications for Bitcoin. During a recession, the Federal Reserve's monetary policies could become more accommodative, with interest rate cuts to stimulate the economy. This increased liquidity could drive investors toward assets like BTC, as Bitcoin is seen by many as a hedge against inflation and the depreciation of the dollar. If the recession were to weaken the dollar, BTC could benefit from increased demand for cryptocurrencies as an alternative to the traditional monetary system. However, if the Fed were to counter the recession with policies that strengthen the dollar, possibly to attract foreign investments, the price of BTC could suffer, as a stronger dollar might reduce Bitcoin's appeal as a safe-haven asset. In conclusion, BTC's future direction depends not only on its technical levels but also on global economic policies and macroeconomic dynamics, which could favor a BTC rally if the recession weakens the dollar, or slow its growth if the dollar maintains strength.

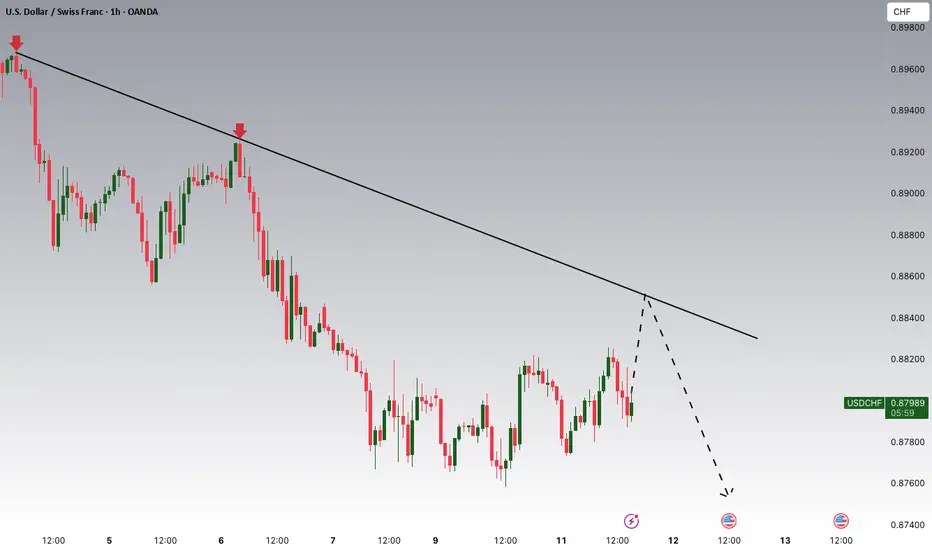
USDCHF to find sellers at market price?USDCHF - 24h expiry
There is no clear indication that the downward move is coming to an end.
20 4hour EMA is at 0.8816.
Bespoke resistance is located at 0.8800.
Our outlook is bearish.
The weaker US dollar has boosted performance.
We look to Sell at 0.8803 (stop at 0.8843)
Our profit targets will be 0.8703 and 0.8683
Resistance: 0.8811 / 0.8830 / 0.8845
Support: 0.8765 / 0.8740 / 0.8720
Risk Disclaimer
The trade ideas beyond this page are for informational purposes only and do not constitute investment advice or a solicitation to trade. This information is provided by Signal Centre, a third-party unaffiliated with OANDA, and is intended for general circulation only. OANDA does not guarantee the accuracy of this information and assumes no responsibilities for the information provided by the third party. The information does not take into account the specific investment objectives, financial situation, or particular needs of any particular person. You should take into account your specific investment objectives, financial situation, and particular needs before making a commitment to trade, including seeking advice from an independent financial adviser regarding the suitability of the investment, under a separate engagement, as you deem fit.
You accept that you assume all risks in independently viewing the contents and selecting a chosen strategy.
Where the research is distributed in Singapore to a person who is not an Accredited Investor, Expert Investor or an Institutional Investor, Oanda Asia Pacific Pte Ltd (“OAP“) accepts legal responsibility for the contents of the report to such persons only to the extent required by law. Singapore customers should contact OAP at 6579 8289 for matters arising from, or in connection with, the information/research distributed.

Dollar Index(DXY) Rebounds from Key Support–Is a New High Cominghello guys.
Let's see what happened for us index and what will happen:
Uptrend Support:
The price has been respecting a long-term ascending trendline since 2011, indicating a strong bullish structure.
Recent price action suggests that the index retested this trendline and bounced off it.
Key Resistance & Breakout Potential:
The index is in a consolidation phase after reaching a local high.
If the price holds above the trendline and breaks the previous high (~13,250-13,400), it could trigger further upside movement.
The next potential target is near 13,500-13,800 based on historical price action and Fibonacci extensions.
-------------------------------------------------
Possible Scenario:
Bullish Case: If the price holds above the trendline and breaks the current range resistance, it could continue toward new highs.
Bearish Case: A breakdown below the 12,800 support level could lead to a deeper correction toward 12,400-12,000.
-------------------------------------------------
Consequences of This Move:
For USD Strength:
A bullish continuation in the Dollar Index means a stronger USD, which could negatively impact commodities (gold, oil) and emerging market currencies.
Forex pairs like EUR/USD and GBP/USD could decline as the USD gains strength.
For Global Markets:
A weaker DXY (if the support breaks) would typically support equity markets and commodities like gold and Bitcoin, as a weaker dollar makes them more attractive.
-------------------------------------------------
Conclusion:
The chart suggests bullish momentum, but confirmation is needed with a breakout above 13,250-13,400.
As long as the price respects the trendline and Fibonacci support, the uptrend remains intact.
Keep an eye on macroeconomic events (e.g., Fed rate decisions, inflation data), as they can impact this movement significantly.

U.S. Dollar Index (DXY) – Key Technical Levels & Market OutlookU.S. Dollar Index (DXY) Monthly Chart Analysis 📊💵
The U.S. Dollar Index (DXY) is currently navigating a critical price structure, with key supply and demand zones influencing market direction. Here’s a professional breakdown of the chart’s technical outlook:
📍 Key Technical Insights
✅ Supply & Demand Zones
Supply Zone (Resistance): 109 - 114 📈 – A key area where selling pressure has historically emerged. A decisive breakout above this level could signal further upside potential.
Demand Zone (Support): 100 - 103 📉 – A strong accumulation zone where buyers have stepped in previously. A breakdown below could indicate a shift in market sentiment.
✅ Market Structure & Momentum
A Break of Structure (BOSS) has been identified, signaling a shift in trend dynamics.
The market is currently ranging between major resistance (~109) and support (~100).
✅ 200-Month Moving Average 📊
The long-term moving average (red line) is acting as dynamic support, reinforcing the bullish bias unless decisively breached.
📊 Potential Scenarios
🔹 Bullish Outlook: If DXY maintains support above 100-103 and breaks past 109, the index could aim for 114+ in the coming months. 🚀
🔹 Bearish Risk: A sustained drop below 100 may open the door for further downside towards 95-89, signaling a broader correction. ⚠️
📌 Conclusion
The DXY remains in a consolidation phase, with key inflection points around 103 (support) and 109 (resistance). A breakout or breakdown from this range will determine the next major trend. Traders should monitor these levels closely for potential trading opportunities.

Falling towards 61.8% Fibonacci support?The Aussie (AUD/USD) is falling towards the pivot and could bounce to the 1st resistance which acts as a pullback resistance.
Pivot: 0.6245
1st Support: 0.6184
1st Resistance: 0.6329
Risk Warning:
Trading Forex and CFDs carries a high level of risk to your capital and you should only trade with money you can afford to lose. Trading Forex and CFDs may not be suitable for all investors, so please ensure that you fully understand the risks involved and seek independent advice if necessary.
Disclaimer:
The above opinions given constitute general market commentary, and do not constitute the opinion or advice of IC Markets or any form of personal or investment advice.
Any opinions, news, research, analyses, prices, other information, or links to third-party sites contained on this website are provided on an "as-is" basis, are intended only to be informative, is not an advice nor a recommendation, nor research, or a record of our trading prices, or an offer of, or solicitation for a transaction in any financial instrument and thus should not be treated as such. The information provided does not involve any specific investment objectives, financial situation and needs of any specific person who may receive it. Please be aware, that past performance is not a reliable indicator of future performance and/or results. Past Performance or Forward-looking scenarios based upon the reasonable beliefs of the third-party provider are not a guarantee of future performance. Actual results may differ materially from those anticipated in forward-looking or past performance statements. IC Markets makes no representation or warranty and assumes no liability as to the accuracy or completeness of the information provided, nor any loss arising from any investment based on a recommendation, forecast or any information supplied by any third-party.

Could the Gold drop from here?The price is reacting off the pivot which is a pullback resistance and could drop to the pullback support.
Pivot: 2,900.98
1st Support: 2,863.32
1st Resistance: 2,926.83
Risk Warning:
Trading Forex and CFDs carries a high level of risk to your capital and you should only trade with money you can afford to lose. Trading Forex and CFDs may not be suitable for all investors, so please ensure that you fully understand the risks involved and seek independent advice if necessary.
Disclaimer:
The above opinions given constitute general market commentary, and do not constitute the opinion or advice of IC Markets or any form of personal or investment advice.
Any opinions, news, research, analyses, prices, other information, or links to third-party sites contained on this website are provided on an "as-is" basis, are intended only to be informative, is not an advice nor a recommendation, nor research, or a record of our trading prices, or an offer of, or solicitation for a transaction in any financial instrument and thus should not be treated as such. The information provided does not involve any specific investment objectives, financial situation and needs of any specific person who may receive it. Please be aware, that past performance is not a reliable indicator of future performance and/or results. Past Performance or Forward-looking scenarios based upon the reasonable beliefs of the third-party provider are not a guarantee of future performance. Actual results may differ materially from those anticipated in forward-looking or past performance statements. IC Markets makes no representation or warranty and assumes no liability as to the accuracy or completeness of the information provided, nor any loss arising from any investment based on a recommendation, forecast or any information supplied by any third-party.

Falling towards overlap support?The Silver (XAG/USD) is falling towards the pivot which has been identified as an overlap support and could bounce to the 1st resistance.
Pivot: 31.72
1st Support: 31.30
1st Resistance: 32.58
Risk Warning:
Trading Forex and CFDs carries a high level of risk to your capital and you should only trade with money you can afford to lose. Trading Forex and CFDs may not be suitable for all investors, so please ensure that you fully understand the risks involved and seek independent advice if necessary.
Disclaimer:
The above opinions given constitute general market commentary, and do not constitute the opinion or advice of IC Markets or any form of personal or investment advice.
Any opinions, news, research, analyses, prices, other information, or links to third-party sites contained on this website are provided on an "as-is" basis, are intended only to be informative, is not an advice nor a recommendation, nor research, or a record of our trading prices, or an offer of, or solicitation for a transaction in any financial instrument and thus should not be treated as such. The information provided does not involve any specific investment objectives, financial situation and needs of any specific person who may receive it. Please be aware, that past performance is not a reliable indicator of future performance and/or results. Past Performance or Forward-looking scenarios based upon the reasonable beliefs of the third-party provider are not a guarantee of future performance. Actual results may differ materially from those anticipated in forward-looking or past performance statements. IC Markets makes no representation or warranty and assumes no liability as to the accuracy or completeness of the information provided, nor any loss arising from any investment based on a recommendation, forecast or any information supplied by any third-party.

GBP/USD Double Top (11.03.2025)The GBP/USD Pair on the M30 timeframe presents a Potential Selling Opportunity due to a recent Formation of a Double Top Pattern. This suggests a shift in momentum towards the downside in the coming hours.
Possible Short Trade:
Entry: Consider Entering A Short Position around Trendline Of The Pattern.
Target Levels:
1st Support – 1.2784
2nd Support – 1.2724
🎁 Please hit the like button and
🎁 Leave a comment to support for My Post !
Your likes and comments are incredibly motivating and will encourage me to share more analysis with you.
Best Regards, KABHI_TA_TRADING
Thank you.

Bearish drop?USD/ZAR is reacting the pivot and could drop to the 1st support.
Pivot: 18.3261
1st Support: 18.0580
1st Resistance: 18.4657
Risk Warning:
Trading Forex and CFDs carries a high level of risk to your capital and you should only trade with money you can afford to lose. Trading Forex and CFDs may not be suitable for all investors, so please ensure that you fully understand the risks involved and seek independent advice if necessary.
Disclaimer:
The above opinions given constitute general market commentary, and do not constitute the opinion or advice of IC Markets or any form of personal or investment advice.
Any opinions, news, research, analyses, prices, other information, or links to third-party sites contained on this website are provided on an "as-is" basis, are intended only to be informative, is not an advice nor a recommendation, nor research, or a record of our trading prices, or an offer of, or solicitation for a transaction in any financial instrument and thus should not be treated as such. The information provided does not involve any specific investment objectives, financial situation and needs of any specific person who may receive it. Please be aware, that past performance is not a reliable indicator of future performance and/or results. Past Performance or Forward-looking scenarios based upon the reasonable beliefs of the third-party provider are not a guarantee of future performance. Actual results may differ materially from those anticipated in forward-looking or past performance statements. IC Markets makes no representation or warranty and assumes no liability as to the accuracy or completeness of the information provided, nor any loss arising from any investment based on a recommendation, forecast or any information supplied by any third-party.

DOT - Strong bounce from the ultimate low ?Bounced each time for consequent gains around 3.75, so I expect the same now
placed a SL a bit wide, a good fuel could be the 2.0 update of Polkadot but didn hear any news about it to be honest
In the other hand, lower would means I'll quit this asset for a mid/long term hehe,
Cheers

Bearish drop?XAG/USD has reacted off the support level which is a pullback support ad could drop from this level to our take profit.
Entry: 32.31
Why we like it:
There is a pullback support level.
Stop loss: 33.15
Why we like it:
There is a pullback resistance level.
Take profit: 31.48
Why we like it:
There is a pullback support level that lines up with the 61.8% Fibonacci retracement.
Enjoying your TradingView experience? Review us!
Please be advised that the information presented on TradingView is provided to Vantage (‘Vantage Global Limited’, ‘we’) by a third-party provider (‘Everest Fortune Group’). Please be reminded that you are solely responsible for the trading decisions on your account. There is a very high degree of risk involved in trading. Any information and/or content is intended entirely for research, educational and informational purposes only and does not constitute investment or consultation advice or investment strategy. The information is not tailored to the investment needs of any specific person and therefore does not involve a consideration of any of the investment objectives, financial situation or needs of any viewer that may receive it. Kindly also note that past performance is not a reliable indicator of future results. Actual results may differ materially from those anticipated in forward-looking or past performance statements. We assume no liability as to the accuracy or completeness of any of the information and/or content provided herein and the Company cannot be held responsible for any omission, mistake nor for any loss or damage including without limitation to any loss of profit which may arise from reliance on any information supplied by Everest Fortune Group.

Comprehensive Analysis of SOLANAI do believe that SOL is going to dip more, please watch the analysis that I've posted here and let me know your thoughts.

NZDUSD Potential UpsidesHey Traders, in today's trading session we are monitoring NZDUSD for a buying opportunity around 0.57100 zone, NZDUSD is trading in an uptrend and currently is in a correction phase in which it is approaching the trend at 0.57100 support and resistance area.
Trade safe, Joe.

EURUSD Potential UpsidesHey Traders, in today's trading session we are monitoring EURUSD for a buying opportunity around 1.08000 zone, EURUSD is trading in an uptrend and currently is in a correction phase in which it is approaching the trend at 1.08000 support and resistance area.
Trade safe, Joe.

USDJPY Potential DownsidesHey Traders, in today's trading session we are monitoring USDJPY for a selling opportunity around 147.500 zone, USDJPY is trading in a downtrend and currently is in a correction phase in which it is approaching the trend at 147.500 support and resistance area.
Trade safe, Joe.

EUR/USD analysis – two Key Scenarioshello guys.
The EUR/USD pair has witnessed a strong bullish surge, breaking through key resistance levels. However, two possible scenarios emerge from this critical point:
🔴 First Scenario (Bullish Continuation):
Price could retrace to the 1.07-1.072 demand zone before resuming its upward trajectory.
If support holds, the pair may climb towards the 1.10-1.105 resistance zone, aligning with the upper boundary of the ascending channel.
🔵 Second Scenario (Bearish Reversal):
If bullish momentum fades, a deeper correction may follow, breaking below the key support zone.
This could lead the price toward the 1.04-1.043 area, marking a retest of previous lows and reinforcing bearish sentiment.
-------------------
Conclusion:
The current level serves as a critical decision point. If price sustains above support ($1.072-$1.068), bullish momentum may continue. However, a break below could signal a bearish correction, shifting market sentiment. Traders should watch key levels for confirmation of either scenario.

EURUSD on its 1W MA200 after 5 months.The EURUSD pair hit on Friday its 1W MA200 (orange trend-line) for the first time in 5 months (since October 03 2024). This is a major Resistance level which initiated a strong -4.00% decline on December 28 2023.
In fact -4.00% declines have been quite common for EURUSD in the past 2 years. However, the pair's strongest Resistance level has been the 1M MA100 (red trend-line) which has formed both market tops on October 01 2024 and July 18 2023.
As a result, the most optimal sell entry would be when the 1W RSI hits its Resistance Zone, with the price probably close to the 1M MA100 within the Lower Highs Zone. On the long-term, the R/R has shifted dramatically in favor of selling right now. If the rejection does happen on the 1W MA200 eventually and won't close any 1W candle above it, we have a short-term Target at 1.04600 (-4.00% decline) and if the rejection takes place higher, we will be expecting a bottom near parity with a technical Target at 1.00500 (Lower Lows Zone).
-------------------------------------------------------------------------------
** Please LIKE 👍, FOLLOW ✅, SHARE 🙌 and COMMENT ✍ if you enjoy this idea! Also share your ideas and charts in the comments section below! This is best way to keep it relevant, support us, keep the content here free and allow the idea to reach as many people as possible. **
-------------------------------------------------------------------------------
Disclosure: I am part of Trade Nation's Influencer program and receive a monthly fee for using their TradingView charts in my analysis.
💸💸💸💸💸💸
👇 👇 👇 👇 👇 👇

EURO - Price can drop to $1.0700, breaking support levelHi guys, this is my overview for EURUSD, feel free to check it and write your feedback in comments👊
Recently price started to trades inside a broadening wedge, where it at once bounced up from support level to resistance line.
Then Euro some time traded in a range, and then dropped to support line of wedge, breaking $1.0420 level.
After this, Euro turned around and made strong upward movement to resistance line of a broadening wedge.
Also, it broke $1.0420 level and soon exited from broadening wedge and broke $1.0770 level too.
Next, Euro continued to move up inside rising channel, where it rose from support level to resistance line.
Possibly, price can rise a little in a channel and then bounce down to $1.0700, breaking support level and exit from channel.
If this post is useful to you, you can support me with like/boost and advice in comments❤️

BTC | USD PipGuard 75k or 150K🚀 Market Analysis – Get Ready for Some Laughs!
Ladies and gentlemen, this is no joke! The trend is bullish, but don’t be fooled by the temptation to shout “ Trend reversal! ” What we’re seeing is just a small retracement , a strategic pause that Bitcoin is taking to catch its breath and prepare for another sprint that will shake the market.
And guess who’s behind all this chaos? Our beloved blonde canary with more ego than hair on his head: Donald Trump! 🦜💸 Yes, you heard right! It seems that good ol’ Trump has decided to inflate the crypto market like a helium balloon , promising it will soar to the heavens. And us? We won’t be caught unprepared. When the feed is thrown up in the air, we’re already there with the sack open, ready to collect it all. 🏃♂️💨
📈 Numbers to Blow Your Mind – Targets and Key Levels
🔹 Current price heading towards 82K .
🔹 93,500$ : our key level , where the real battle is fought.
Above this level? Bullish to the max! 🚀 Target? We’re heading toward 130K - 150K .
Below? No worries, Bearish Mode activates like a switch. 🐻
🎯 Insider Tip – Fibonacci, Our Holy Grail
Bitcoin and crypto love the Fibonacci equilibrium point more than the traditional market loves common sense. 🎯 This level was hit on 28/02/2025 , so get ready to see a reaction that will shake the foundations!
🧐 How Much Could BTC Retrace?
In my opinion, BTC could drop to 74,600$ - 70,500$ . But beware, if it falls below 65K , Bitcoin will stop retracing and start crying like a baby . 😭
🎯 What Should We Do NOW?
👉 As long as we’re below 93,500$ , it’s better to look for short positions .
👉 Once we hit the reversal zone , wait for confirmation and then... we’ll shoot up like a rocket! 🚀
The plan is clear, the market is set, and us? Heads on our shoulders , fingers ready on the mouse , and off we go with the strategy ! 🧠💻
Let me know what you think in the comments! ⬇️🔥
What do you think? Leave a comment below and let me know how you’re finding PipGuard . If you like what I do, don’t forget to spread the word and help me grow the project. Share the passion! 🌍

XAU/USD (Gold) Trendline Breakout (10.03.2025)The XAU/USD Pair on the M30 timeframe presents a Potential Selling Opportunity due to a recent Formation of a Trendline Breakout Pattern. This suggests a shift in momentum towards the downside in the coming hours.
Possible Short Trade:
Entry: Consider Entering A Short Position around Trendline Of The Pattern.
Target Levels:
1st Support – 2877
2nd Support – 2860
🎁 Please hit the like button and
🎁 Leave a comment to support for My Post !
Your likes and comments are incredibly motivating and will encourage me to share more analysis with you.
Best Regards, KABHI_TA_TRADING
Thank you.
