Potential bullish rise?Ethereum (ETH/USD) is falling towards the pivot and could bounce to the 1st resistance which has been identified as a pullback resistance.
Pivot: 2,098.80
1st Support: 1,941.25
1st Resistance: 2,384.00
Risk Warning:
Trading Forex and CFDs carries a high level of risk to your capital and you should only trade with money you can afford to lose. Trading Forex and CFDs may not be suitable for all investors, so please ensure that you fully understand the risks involved and seek independent advice if necessary.
Disclaimer:
The above opinions given constitute general market commentary, and do not constitute the opinion or advice of IC Markets or any form of personal or investment advice.
Any opinions, news, research, analyses, prices, other information, or links to third-party sites contained on this website are provided on an "as-is" basis, are intended only to be informative, is not an advice nor a recommendation, nor research, or a record of our trading prices, or an offer of, or solicitation for a transaction in any financial instrument and thus should not be treated as such. The information provided does not involve any specific investment objectives, financial situation and needs of any specific person who may receive it. Please be aware, that past performance is not a reliable indicator of future performance and/or results. Past Performance or Forward-looking scenarios based upon the reasonable beliefs of the third-party provider are not a guarantee of future performance. Actual results may differ materially from those anticipated in forward-looking or past performance statements. IC Markets makes no representation or warranty and assumes no liability as to the accuracy or completeness of the information provided, nor any loss arising from any investment based on a recommendation, forecast or any information supplied by any third-party.
USD

EURUSD: Channel Up has topped. Sell signal.EURUSD is bullish on its 1D technical outlook (RSI = 62.145, MACD = 0.003, ADX = 17.266) and overbought on the lower timeframes with the 4H RSI in particular above 75.000. The Channel Up that started on the February 2nd low had every HH pull back to its 0.618 Fib level. Consequently we are short on the short term (TP = 1.04500). If the price crosses under this 1 month Channel Up, the longer Channel Up should push even lower to the 0.786 Fib of the greater bullish wave (TP = 1.03000).
## If you like our free content follow our profile to get more daily ideas. ##
## Comments and likes are greatly appreciated. ##

Bearish drop?XAU/USD has reacted off the resistance level which is a pullback resistance that is slightly below the 78.6% Fibonacci retracement and could drop from this level to our take profit.
Entry: 2,925.63
Why we like it:
There is a pullback resistance level that is slightly below the 78.6% Fibonacci retracement.
Stop loss: 2,953.39
Why we like it:
There is a swing high resistance level.
Take profit: 2,880.98
Why we like it:
There is a pullback support level that lines up with the 50% Fibonacci retracement.
Enjoying your TradingView experience? Review us!
Please be advised that the information presented on TradingView is provided to Vantage (‘Vantage Global Limited’, ‘we’) by a third-party provider (‘Everest Fortune Group’). Please be reminded that you are solely responsible for the trading decisions on your account. There is a very high degree of risk involved in trading. Any information and/or content is intended entirely for research, educational and informational purposes only and does not constitute investment or consultation advice or investment strategy. The information is not tailored to the investment needs of any specific person and therefore does not involve a consideration of any of the investment objectives, financial situation or needs of any viewer that may receive it. Kindly also note that past performance is not a reliable indicator of future results. Actual results may differ materially from those anticipated in forward-looking or past performance statements. We assume no liability as to the accuracy or completeness of any of the information and/or content provided herein and the Company cannot be held responsible for any omission, mistake nor for any loss or damage including without limitation to any loss of profit which may arise from reliance on any information supplied by Everest Fortune Group.

Potential bearish reversal?GBP/USD is rising towards the resistance level which is a pullback resistance that aligns with the 138.2% Fibonacci extension and could reverse from this level to our take profit.
Entry: 1.2793
Why we like it:
There is a pullback resistance level that aligns with the 138.2% Fibonacci extension.
Stop loss: 1.2863
Why we like it:
There is a pullback resistance that aligns with the 78.6% Fibonacci projection.
Take profit: 1.2674
Why we like it:
There is an overlap support level.
Enjoying your TradingView experience? Review us!
Please be advised that the information presented on TradingView is provided to Vantage (‘Vantage Global Limited’, ‘we’) by a third-party provider (‘Everest Fortune Group’). Please be reminded that you are solely responsible for the trading decisions on your account. There is a very high degree of risk involved in trading. Any information and/or content is intended entirely for research, educational and informational purposes only and does not constitute investment or consultation advice or investment strategy. The information is not tailored to the investment needs of any specific person and therefore does not involve a consideration of any of the investment objectives, financial situation or needs of any viewer that may receive it. Kindly also note that past performance is not a reliable indicator of future results. Actual results may differ materially from those anticipated in forward-looking or past performance statements. We assume no liability as to the accuracy or completeness of any of the information and/or content provided herein and the Company cannot be held responsible for any omission, mistake nor for any loss or damage including without limitation to any loss of profit which may arise from reliance on any information supplied by Everest Fortune Group.

Heading into 61.8% Fibonacci resistance?USD/JPY rising towards the resistance level which is an overlap resistance that lines up with the 61.8% Fibonacci retracement and could reverse from this level to our take profit.
Entry: 150.06
Why we like it:
There is an overlap resistance level that lines up with the 61.8% Fibonacci retracement.
Stop loss: 151.31
Why we like it:
There is an overlap resistance level.
Take profit: 148.17
Why we like it:
There is a pullback support level.
Enjoying your TradingView experience? Review us!
Please be advised that the information presented on TradingView is provided to Vantage (‘Vantage Global Limited’, ‘we’) by a third-party provider (‘Everest Fortune Group’). Please be reminded that you are solely responsible for the trading decisions on your account. There is a very high degree of risk involved in trading. Any information and/or content is intended entirely for research, educational and informational purposes only and does not constitute investment or consultation advice or investment strategy. The information is not tailored to the investment needs of any specific person and therefore does not involve a consideration of any of the investment objectives, financial situation or needs of any viewer that may receive it. Kindly also note that past performance is not a reliable indicator of future results. Actual results may differ materially from those anticipated in forward-looking or past performance statements. We assume no liability as to the accuracy or completeness of any of the information and/or content provided herein and the Company cannot be held responsible for any omission, mistake nor for any loss or damage including without limitation to any loss of profit which may arise from reliance on any information supplied by Everest Fortune Group.

ETH - Short term long I have just entered on the breakout (Assuming it closes above 2110 on the 1H.) Target $2250.

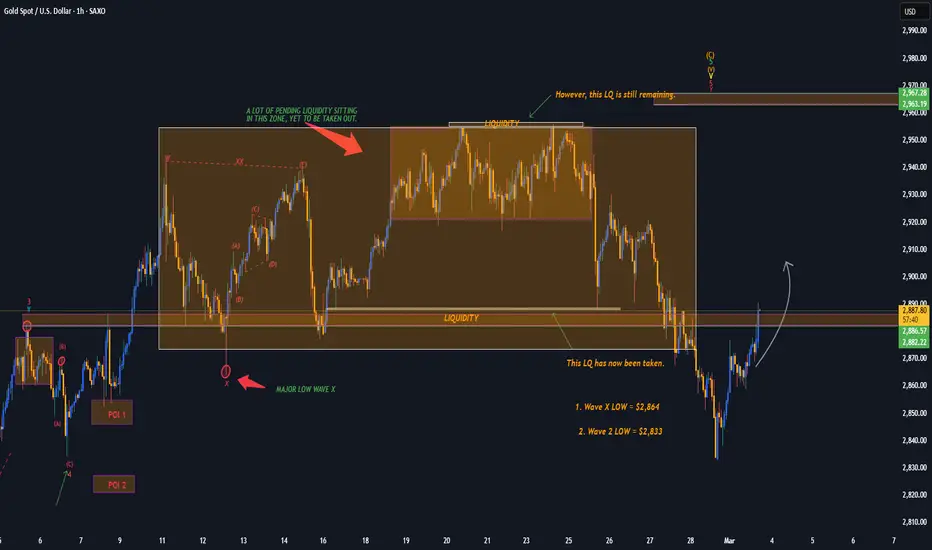
Gold - 1H TF BULLISHEven though mid term we're bearish on Gold, I still cannot ignore the fact there is a lot of pending LQ on Gold around the ATH. Also, as it's a new month, the new monthly candle requires some liquidity from the upside before it can drop.
On the 1H TF I'll be targeting small zones for buys & once price reaches that zone, I can monitor for any possible rejections back down, or possible further upside. TARGET 1: $2,903📈
NZDUSD Potential DownsidesHey Traders, in today's trading session we are monitoring NZDUSD for a selling opportunity around 0.56400 zone, NZDUSD is trading in a downtrend and currently is in a correction phase in which it is approaching the trend at 0.56400 support and resistance area.
Trade safe, Joe.

GBPUSD Potential DownsidesHey traders, in today's trading session we are monitoring GBPUSD for a selling opportunity around 1.27400 zone, GBPUSD is trading in a downtrend and currently is in a correction phase in which it is approaching the trend at 1.27400 support and resistance area.
Trade safe, Joe.

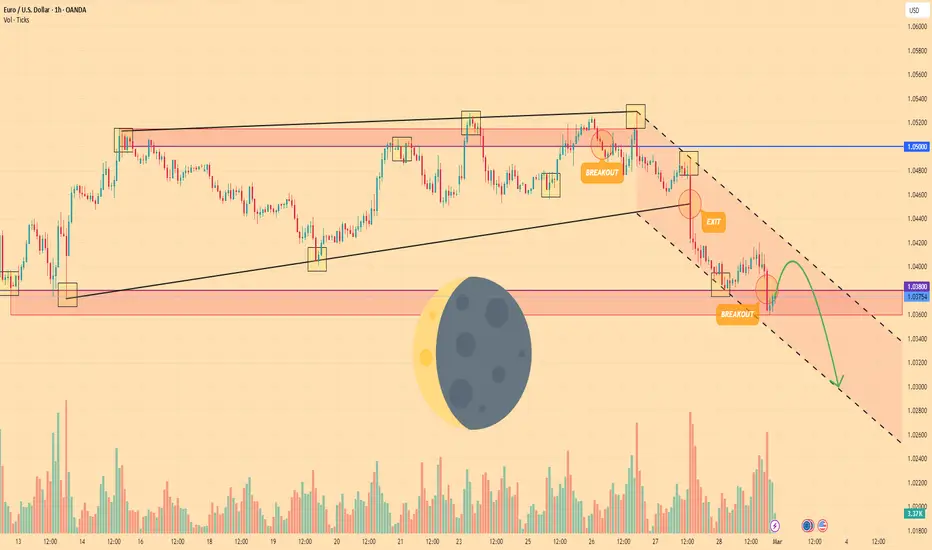
EURO - Price can continue to decline inside falling channelHi guys, this is my overview for EURUSD, feel free to check it and write your feedback in comments👊
Recently price declined to $1.0380 level and then started to grow inside a wedge, where it at once reached $1.0500 level.
Then price turned around and made correction movement to support line of the wedge, after which quickly bounced up.
Price grew to $1.0500 level and some time traded near this level and later finally broke it, after which turned around.
Euro broke $1.0500 level again, exited from wedge and continued to decline inside falling channel.
Inside channel, price declined to $1.0380 level and a few moments ago broke it and now continued to fall.
Possibly, Euro can rise a little higher than $1.0380 level and then continue to fall to $1.0300 inside channel.
If this post is useful to you, you can support me with like/boost and advice in comments❤️
Crude - Further downside expectedFollow up on this:
Price shot up to test the triangle trendline once again. Now the price is trading very close to a very strong support level.
Based on Elliott Waves, I expect this level to break to make a new low, at least till $58-$60. Since this is the last leg of correction, it is likely to be a sharp drop.

Bullish bounce?USD/ZAR has bounced off the pivot and could bounce to the 1st resistance.
Pivot: 18.5736
1st Support: 18.4387
1st Resistance: 18.8136
Risk Warning:
Trading Forex and CFDs carries a high level of risk to your capital and you should only trade with money you can afford to lose. Trading Forex and CFDs may not be suitable for all investors, so please ensure that you fully understand the risks involved and seek independent advice if necessary.
Disclaimer:
The above opinions given constitute general market commentary, and do not constitute the opinion or advice of IC Markets or any form of personal or investment advice.
Any opinions, news, research, analyses, prices, other information, or links to third-party sites contained on this website are provided on an "as-is" basis, are intended only to be informative, is not an advice nor a recommendation, nor research, or a record of our trading prices, or an offer of, or solicitation for a transaction in any financial instrument and thus should not be treated as such. The information provided does not involve any specific investment objectives, financial situation and needs of any specific person who may receive it. Please be aware, that past performance is not a reliable indicator of future performance and/or results. Past Performance or Forward-looking scenarios based upon the reasonable beliefs of the third-party provider are not a guarantee of future performance. Actual results may differ materially from those anticipated in forward-looking or past performance statements. IC Markets makes no representation or warranty and assumes no liability as to the accuracy or completeness of the information provided, nor any loss arising from any investment based on a recommendation, forecast or any information supplied by any third-party.

Could the Aussie bounce from here?The price is falling towards the support level which is a pullback support that aligns with the 50% Fibonacci retracement and could bounce from this level to our take profit.
Entry: 0.6225
Why we like it:
There is a pullback support level that lines up with the 50% Fibonacci retracement.
Stop loss: 0.6177
Why we like it:
There is a pullback support level that line sup with the 71% Fibonacci retracement.
Take profit: 0.6296
Why we like it:
There is a pullback resistance level that is slightly below the 50% Fibonacci retracement.
Enjoying your TradingView experience? Review us!
Please be advised that the information presented on TradingView is provided to Vantage (‘Vantage Global Limited’, ‘we’) by a third-party provider (‘Everest Fortune Group’). Please be reminded that you are solely responsible for the trading decisions on your account. There is a very high degree of risk involved in trading. Any information and/or content is intended entirely for research, educational and informational purposes only and does not constitute investment or consultation advice or investment strategy. The information is not tailored to the investment needs of any specific person and therefore does not involve a consideration of any of the investment objectives, financial situation or needs of any viewer that may receive it. Kindly also note that past performance is not a reliable indicator of future results. Actual results may differ materially from those anticipated in forward-looking or past performance statements. We assume no liability as to the accuracy or completeness of any of the information and/or content provided herein and the Company cannot be held responsible for any omission, mistake nor for any loss or damage including without limitation to any loss of profit which may arise from reliance on any information supplied by Everest Fortune Group.

Potential bullish bounce?GBP/USD is falling towards the support level which is a pullback support and could bounce from this level to our take profit.
Entry: 1.2681
Why we like it:
There is a pullback support level.
Stop loss: 1.2603
Why we like it:
There is a pullback support level.
Take profit: 1.2778
Why we like it:
There is a pullback resistance level that line sup with the 138.2% Fibonacci extension.
Enjoying your TradingView experience? Review us!
Please be advised that the information presented on TradingView is provided to Vantage (‘Vantage Global Limited’, ‘we’) by a third-party provider (‘Everest Fortune Group’). Please be reminded that you are solely responsible for the trading decisions on your account. There is a very high degree of risk involved in trading. Any information and/or content is intended entirely for research, educational and informational purposes only and does not constitute investment or consultation advice or investment strategy. The information is not tailored to the investment needs of any specific person and therefore does not involve a consideration of any of the investment objectives, financial situation or needs of any viewer that may receive it. Kindly also note that past performance is not a reliable indicator of future results. Actual results may differ materially from those anticipated in forward-looking or past performance statements. We assume no liability as to the accuracy or completeness of any of the information and/or content provided herein and the Company cannot be held responsible for any omission, mistake nor for any loss or damage including without limitation to any loss of profit which may arise from reliance on any information supplied by Everest Fortune Group.

Falling towards 61.8% Fibonacci support?USD/CHF is falling towards the support level that is an overlap support that aligns with the 61.8% Fibonacci retracement and could bounce from this level to our take profit.
Entry: 0.8962
Why we like it:
There is an overlap support level that lines up with the 61.8% Fibonacci retracement.
Stop loss: 0.8929
Why we like it:
There is a pullback support level.
Take profit: 0.9003
Why we like it:
There is a pullback resistance level.
Enjoying your TradingView experience? Review us!
Please be advised that the information presented on TradingView is provided to Vantage (‘Vantage Global Limited’, ‘we’) by a third-party provider (‘Everest Fortune Group’). Please be reminded that you are solely responsible for the trading decisions on your account. There is a very high degree of risk involved in trading. Any information and/or content is intended entirely for research, educational and informational purposes only and does not constitute investment or consultation advice or investment strategy. The information is not tailored to the investment needs of any specific person and therefore does not involve a consideration of any of the investment objectives, financial situation or needs of any viewer that may receive it. Kindly also note that past performance is not a reliable indicator of future results. Actual results may differ materially from those anticipated in forward-looking or past performance statements. We assume no liability as to the accuracy or completeness of any of the information and/or content provided herein and the Company cannot be held responsible for any omission, mistake nor for any loss or damage including without limitation to any loss of profit which may arise from reliance on any information supplied by Everest Fortune Group.

Bullish bounce?USD/CAD is falling towards the support level which is a pullback support that lines up with the 38.2% Fibonacci retracement and could bounce from this level to our take profit.
Entry: 1.4360
Why we like it:
There is a pullback support level that lines up with the 38.2% Fibonacci retracement.
Stop loss: 1.4307
Why we like it:
There is a pullback support that is slightly below the 50% Fibonacci retracement.
Take profit: 1.4486
Why we like it:
There is a pullback resistance level which is a pullback resistance that is slightly above the 50% Fibonacci retracement.
Enjoying your TradingView experience? Review us!
Please be advised that the information presented on TradingView is provided to Vantage (‘Vantage Global Limited’, ‘we’) by a third-party provider (‘Everest Fortune Group’). Please be reminded that you are solely responsible for the trading decisions on your account. There is a very high degree of risk involved in trading. Any information and/or content is intended entirely for research, educational and informational purposes only and does not constitute investment or consultation advice or investment strategy. The information is not tailored to the investment needs of any specific person and therefore does not involve a consideration of any of the investment objectives, financial situation or needs of any viewer that may receive it. Kindly also note that past performance is not a reliable indicator of future results. Actual results may differ materially from those anticipated in forward-looking or past performance statements. We assume no liability as to the accuracy or completeness of any of the information and/or content provided herein and the Company cannot be held responsible for any omission, mistake nor for any loss or damage including without limitation to any loss of profit which may arise from reliance on any information supplied by Everest Fortune Group.

Falling Resistance Trendline Breakout on 2 hr Timeframe.Hello everyone, i hope you all will be doing good in your life and your Trading as well. Today i have analysed gold chart and found it has given breakout of falling resistance trendline, i am expecting momentum for upside in this. Probability is high it should travel towards our target area. The volume has been increasing, suggesting strong buying interest, and the RSI at 62.32 is in the bullish zone, confirming the upward momentum. Additionally, the MACD crossover adds further confidence to this bullish setup. The ideal entry point is when the price breaks above the resistance at 2,955.16 . Set the stop loss just below the support level at 2,860.96 to manage risk. For targets, consider aiming for 2,965.00 , 2,975.00 , and 2,985.00 , with the final target around 2,995.00 . If the breakout holds, this setup could present a strong uptrend continuation.
Disclaimer:- This analysis is for educational purposes only. Please trade responsibly and consult a financial advisor before making any decisions.
If you found this analysis helpful, don’t forget to like, follow, and share your thoughts in the comments below! Your support keeps me motivated to share more insights. Let’s grow and learn together—happy trading!

EUR/USD: Double Top Formation with Potential Downside TargetTechnical Analysis:
The EUR/USD chart shows the formation of a double top pattern around the 1.0480 level, which is commonly interpreted as a bearish reversal signal. The price action highlights that the previous resistance level has been tested twice, with an inability to break above this level, suggesting that selling pressure is building. Additionally, a broken trendline (indicated in the chart) supports the likelihood of a downward move.
The price has already broken below the ascending trendline, confirming the weakening bullish momentum. The target for this pattern is located at around 1.0325, which aligns with previous support levels and the projected completion of the pattern.
________________________________________
Fundamental Analysis:
Fundamentally, several factors could contribute to a potential downside for EUR/USD:
Economic Data Releases:
The Eurozone has been facing challenges with economic growth, particularly due to inflationary pressures and the ongoing impact of global supply chain disruptions.
On the other hand, the US economy has shown resilience, with strong labor market reports and consumer spending data that may indicate continued strength. If these trends persist, the USD could gain strength relative to the EUR.
Monetary Policy Divergence:
The European Central Bank (ECB) has been cautious in raising interest rates, with a focus on stimulating growth in the region. This contrasts with the US Federal Reserve, which has been tightening its monetary policy more aggressively to combat inflation.
The divergence in monetary policy could continue to support the USD, adding downward pressure on the EUR/USD pair.
Geopolitical Events:
Ongoing geopolitical uncertainties, including the impact of global trade tensions and regional conflicts, could further affect the Eurozone's economic outlook, while the USD might benefit as a safe haven in times of uncertainty.
________________________________________
Conclusion: With both technical and fundamental factors pointing to a potential bearish scenario for EUR/USD, traders should be cautious of further downside movement. The key support around 1.0325 is critical, and a break below this level could open up further downside towards the next support levels.

GOLD to continue in the downward move?Gold - 24h expiry
Our short term bias remains negative.
The trend of higher intraday lows has also been broken.
Offers ample risk/reward to sell at the market.
50 1hour EMA is at 2871.
The overnight rally has been sold into and there is scope for further bearish pressure going into this morning.
We look to Sell at 2874.5 (stop at 2895.1)
Our profit targets will be 2820.8 and 2809.8
Resistance: 2876.6 / 2890.0 / 2910.0
Support: 2855.0 / 2832.4 / 2815.0
Risk Disclaimer
The trade ideas beyond this page are for informational purposes only and do not constitute investment advice or a solicitation to trade. This information is provided by Signal Centre, a third-party unaffiliated with OANDA, and is intended for general circulation only. OANDA does not guarantee the accuracy of this information and assumes no responsibilities for the information provided by the third party. The information does not take into account the specific investment objectives, financial situation, or particular needs of any particular person. You should take into account your specific investment objectives, financial situation, and particular needs before making a commitment to trade, including seeking advice from an independent financial adviser regarding the suitability of the investment, under a separate engagement, as you deem fit.
You accept that you assume all risks in independently viewing the contents and selecting a chosen strategy.
Where the research is distributed in Singapore to a person who is not an Accredited Investor, Expert Investor or an Institutional Investor, Oanda Asia Pacific Pte Ltd (“OAP“) accepts legal responsibility for the contents of the report to such persons only to the extent required by law. Singapore customers should contact OAP at 6579 8289 for matters arising from, or in connection with, the information/research distributed.

Bullish bounce off pullback support?The Cable (GBP/USD) is falling towards the pivot which has been identified as a pullback support and could bounce to the 1st resistance.
Pivot: 1.2501
1st Support: 1.2328
1st Resistance: 1.2858
Risk Warning:
Trading Forex and CFDs carries a high level of risk to your capital and you should only trade with money you can afford to lose. Trading Forex and CFDs may not be suitable for all investors, so please ensure that you fully understand the risks involved and seek independent advice if necessary.
Disclaimer:
The above opinions given constitute general market commentary, and do not constitute the opinion or advice of IC Markets or any form of personal or investment advice.
Any opinions, news, research, analyses, prices, other information, or links to third-party sites contained on this website are provided on an "as-is" basis, are intended only to be informative, is not an advice nor a recommendation, nor research, or a record of our trading prices, or an offer of, or solicitation for a transaction in any financial instrument and thus should not be treated as such. The information provided does not involve any specific investment objectives, financial situation and needs of any specific person who may receive it. Please be aware, that past performance is not a reliable indicator of future performance and/or results. Past Performance or Forward-looking scenarios based upon the reasonable beliefs of the third-party provider are not a guarantee of future performance. Actual results may differ materially from those anticipated in forward-looking or past performance statements. IC Markets makes no representation or warranty and assumes no liability as to the accuracy or completeness of the information provided, nor any loss arising from any investment based on a recommendation, forecast or any information supplied by any third-party.

Could the price drop from here?USD/JPY is reacting off the pivot and could drop to the 1st support which is a pullback support.
Pivot: 151.18
1st Support: 147.17
1st Resistance: 154.79
Risk Warning:
Trading Forex and CFDs carries a high level of risk to your capital and you should only trade with money you can afford to lose. Trading Forex and CFDs may not be suitable for all investors, so please ensure that you fully understand the risks involved and seek independent advice if necessary.
Disclaimer:
The above opinions given constitute general market commentary, and do not constitute the opinion or advice of IC Markets or any form of personal or investment advice.
Any opinions, news, research, analyses, prices, other information, or links to third-party sites contained on this website are provided on an "as-is" basis, are intended only to be informative, is not an advice nor a recommendation, nor research, or a record of our trading prices, or an offer of, or solicitation for a transaction in any financial instrument and thus should not be treated as such. The information provided does not involve any specific investment objectives, financial situation and needs of any specific person who may receive it. Please be aware, that past performance is not a reliable indicator of future performance and/or results. Past Performance or Forward-looking scenarios based upon the reasonable beliefs of the third-party provider are not a guarantee of future performance. Actual results may differ materially from those anticipated in forward-looking or past performance statements. IC Markets makes no representation or warranty and assumes no liability as to the accuracy or completeness of the information provided, nor any loss arising from any investment based on a recommendation, forecast or any information supplied by any third-party.

Bearish reversal off 50% Fibonacci resistance?The Swissie (USD/CHF) is rising towards the pivot which acts as a pullback resistance and could drop to the 1st support which has been identified as an overlap support.
Pivot: 0.9043
1st Support: 0.8906
1st Resistance: 0.9171
Risk Warning:
Trading Forex and CFDs carries a high level of risk to your capital and you should only trade with money you can afford to lose. Trading Forex and CFDs may not be suitable for all investors, so please ensure that you fully understand the risks involved and seek independent advice if necessary.
Disclaimer:
The above opinions given constitute general market commentary, and do not constitute the opinion or advice of IC Markets or any form of personal or investment advice.
Any opinions, news, research, analyses, prices, other information, or links to third-party sites contained on this website are provided on an "as-is" basis, are intended only to be informative, is not an advice nor a recommendation, nor research, or a record of our trading prices, or an offer of, or solicitation for a transaction in any financial instrument and thus should not be treated as such. The information provided does not involve any specific investment objectives, financial situation and needs of any specific person who may receive it. Please be aware, that past performance is not a reliable indicator of future performance and/or results. Past Performance or Forward-looking scenarios based upon the reasonable beliefs of the third-party provider are not a guarantee of future performance. Actual results may differ materially from those anticipated in forward-looking or past performance statements. IC Markets makes no representation or warranty and assumes no liability as to the accuracy or completeness of the information provided, nor any loss arising from any investment based on a recommendation, forecast or any information supplied by any third-party.

Bullish continuation?The Loonie (USD/CAD) is falling towards the pivot which has been identified as a pullback support and could bounce to the 1st resistance that lines up wit the 61.8% Fibonacci retracement.
Pivot: 1.4348
1st Support: 1.4239
1st Resistance: 1.4537
Risk Warning:
Trading Forex and CFDs carries a high level of risk to your capital and you should only trade with money you can afford to lose. Trading Forex and CFDs may not be suitable for all investors, so please ensure that you fully understand the risks involved and seek independent advice if necessary.
Disclaimer:
The above opinions given constitute general market commentary, and do not constitute the opinion or advice of IC Markets or any form of personal or investment advice.
Any opinions, news, research, analyses, prices, other information, or links to third-party sites contained on this website are provided on an "as-is" basis, are intended only to be informative, is not an advice nor a recommendation, nor research, or a record of our trading prices, or an offer of, or solicitation for a transaction in any financial instrument and thus should not be treated as such. The information provided does not involve any specific investment objectives, financial situation and needs of any specific person who may receive it. Please be aware, that past performance is not a reliable indicator of future performance and/or results. Past Performance or Forward-looking scenarios based upon the reasonable beliefs of the third-party provider are not a guarantee of future performance. Actual results may differ materially from those anticipated in forward-looking or past performance statements. IC Markets makes no representation or warranty and assumes no liability as to the accuracy or completeness of the information provided, nor any loss arising from any investment based on a recommendation, forecast or any information supplied by any third-party.
