This is the underlying trend ...
As you know, the market has a law of its own: Buy Low (when others are fearful), Sell High (when others are greedy)
Technical Section:
The calm before the storm ($82500)
* Medium Term:
BTC is completing the first wave of the fifth wave of a five-wave rally (5).
*Long Term:
BTC is completing the fifth wave of the third wave of a five-wave rally 5.
We will see.
Wave Analysis

Wave 5 Vibes in SPX. Very close to puking my bullish positions and reverting back to being a bear (although I hate to short at these levels, I'd probably wait for a break and rally) but this is possibly a wave 5 spike out.
If it is, then we'll see a big rally to over 6000.
Big attempts at this on now, largely weighted with deep OTM calls so they're cheap to lose.
Wave 5 would be about over now if this is correct.
Otherwise, I think we'll end up trading 5000. Would just be a matter of what path. I'd not short immediately, but I would bail on longs quickly.

XAUUSD Short H4Remember, successful trading relies on proper risk management and a disciplined approach. Use stop-losses to safeguard your assets and carefully plan each trade. Analysis is the key to making informed decisions. Stay updated and continue refining your strategies!

DXY|LONG UPDATEHello to everyone checking out this post!
Drop your thoughts in the comments! My outlook on the Dollar Index (DXY) is bullish. I believe it could start its upward move from the current level and continue its rally over the next few weeks. 📈🔥
Let me know what you think! 👇

XRP Ripple Will Dump More, But Then We Have a ChanceHello, Skyrexians!
Yesterday morning we did a big warning that altcoins will drop again. We expected the dump on Monday, but it has been started the next hour after our post. BINANCE:XRPUSDT is not an exception and dumped with the entire market, but for this coin correction is not likely to be over.
Let's take a look at the daily chart. We can see the clear 5 Elliott wave structure inside the previous wave of growth. The bearish divergence signaled that trend is over and now it's time to fasten your seatbelt. Correction has the shape on zigzag, wave A was impulsive, wave B was ugly and now price is printing wave C, which has to consists of 5 waves as well. The target is $1.5. There we have to see the green dot on the Bullish/Bearish Reversal Bar Indicator for the potential uptrend continuation.
Best regards,
Skyrexio Team
___________________________________________________________
Please, boost this article and subscribe our page if you like analysis!

ARBUSDT BUY OpportunityARBUSDT is moving within an ascending channel. The plan is to accumulate within the designated buy-back area and use the recommended stop loss. Following the success of our last analysis on this coin, we anticipate similar profitable outcomes. Targets to watch are delineated on the chart. Enjoy.
Checkout the last work done on this:

Dmtrusdt buy opportunityDMTR/USDT has broken out from its downtrend trendline and is forming a bullish continuation pattern, highlighted by a significant pennant formation.
This pattern suggests further upward movement towards the internal supply zone. The accumulation zone below presents a strong buying opportunity.
We'd love to hear your thoughts on this coin.

Going Short On gold When analyzing the 1-minute timeframe after the New York session, I scan the entire swing high to swing low to identify liquidity zones. My focus is on liquidity sweeps, which occur about 90% of the time during this period. Price tends to grab liquidity before making its next move, and that’s precisely where I’m looking for opportunities.

GasNatural Gas
Key Points in this Chart :
Bearish Channel
Break of Structure
Elliot Waves
Fibonacci Level - 161.8% / 200.0%
Support Level

Dogecoin once in a lifetime opportunity to scoop more!I believe that Doge might be having one of the holy grail moments to get in and scoop even more. Looking like in 2017 when a correction made the the price dip bellow the guppy emas in a bull market trend (green emas). I am buying more for sure. Be greedy when others are fearful!

GBPAUD → Correction to strong support before continuing growthFX:GBPAUD is forming a range with a consolidation target after breaking the base of the ascending triangle. The pound is correcting due to the dollar
Technically, on the daily timeframe we have a strong bullish structure, the price is trying to accelerate after breaking the trend resistance, but against the background of the dollar correction the pound sterling is also making a small pullback. There are no strong fundamental changes and the general direction may continue.
At the moment the focus is on ob, located in the zone of 2.0285, as well as the liquidity zone, which is located below 2.0285 + weekly low - 2.015, which also hides a huge pool of liquidity that can be tested.
Resistance levels: 2.05088
Support levels: 2.0285, 2.0151
On the background of the uptrend and the correction to the support after the update of the maximum, we can consider the strategy - false breakdown of the support with the purpose of continuation of the growth. Emphasis on 2.0285 - 2.015
Regards R. Linda!

Bulls Will Punish Hard 📉 Recent BITCOIN Move Shaped As a ABC And Wave B Pivot Completed At 95k Area, Currently We Are At Wave C Progress And There Are Two PRZ For This Wave, 75600$ As a First And 68k As a Second Targets
👉 I’m Looking For 75600$ Right Now And Any Breakdown From This Level Will Lead The Price Toward 68k
📥 Friendly Suggestion : Some Times Doing Nothing Is The Best Action In Financial Markets, Trading At Current Market Situation Is Too Risky And I Advise To Dont Do Any Thing Right Now, You Can Spend Your Time With Family And Friends But Don’t Think About Enter Any Position Right Now

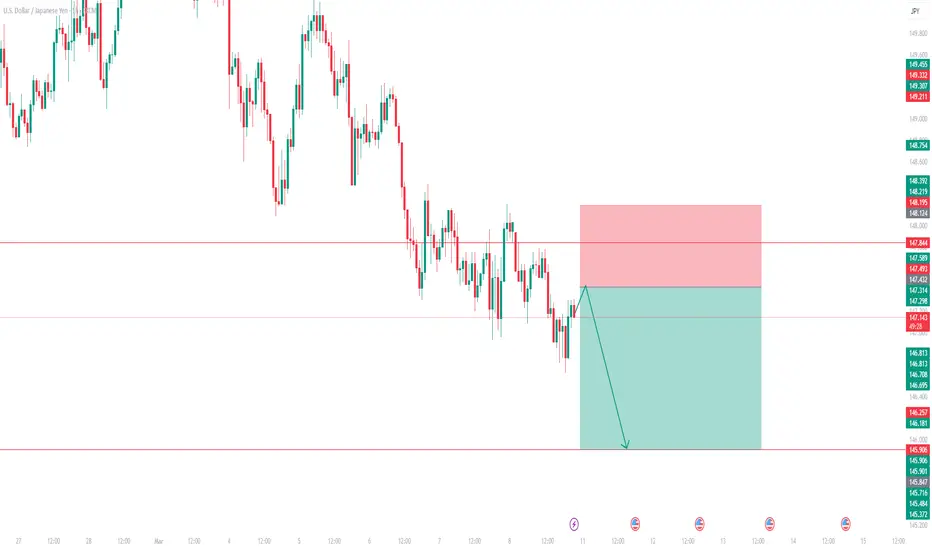
SHORT - USDJPY - TP 146.40USDJPY pair has shown further weakness, it is expected to hit the levels of 146.40 .
GOLD SELL?The market is currently testing the current Daily 0.786 FIB . Based on 4HR TF, the market seems to be forming a possible reversal pattern which could lead to a possible reversal.
We could see SELLERS coming in strong should the current level hold.
Disclaimer:
Please be advised that the information presented on TradingView is solely intended for educational and informational purposes only.The analysis provided is based on my own view of the market. Please be reminded that you are solely responsible for the trading decisions on your account.
High-Risk Warning
Trading in foreign exchange on margin entails high risk and is not suitable for all investors. Past performance does not guarantee future results. In this case, the high degree of leverage can act both against you and in your favor

SP500 Weekly Action Areas & Price Targets 10/03/25In this update, we review the recent price action in the emini S&P 500 futures contract and identify high-probability action areas and price targets for the trading week ahead. To review today's video, click here!

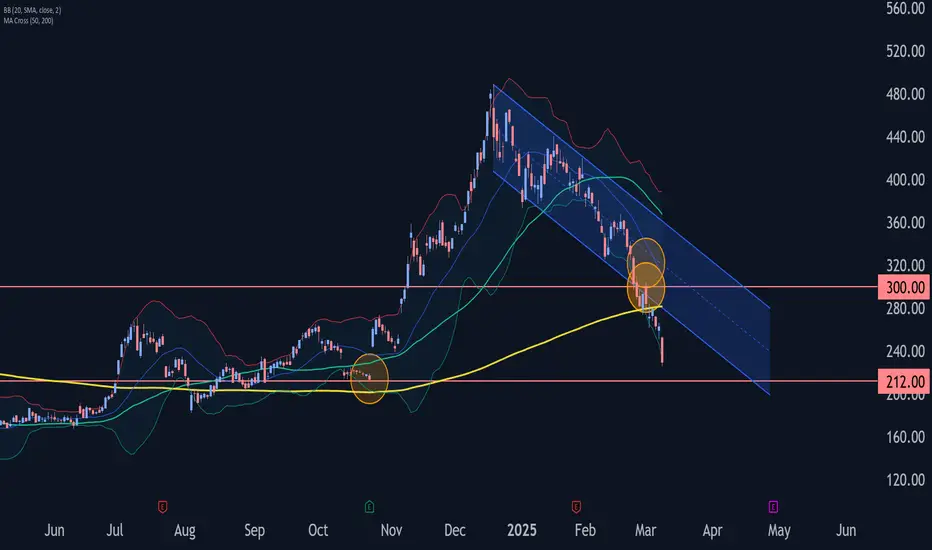
Tesla Wave Analysis – 10 March 2025
- Tesla falling inside sharp impulse waves 5 and (C)
- Likely to fall to support level 212.00
Tesla falling inside the sharp downward impulse wave iii, which started earlier from the round resistance level 300.00 (former support broken in February).
The price earlier broke the support trendline of the daily down channel from December – which signalled the acceleration of the active impulse waves 5 and (C).
Tesla can be expected to fall to the next support level 212.00 (former monthly low from October) and the target for the completion of the active impulse wave 5.
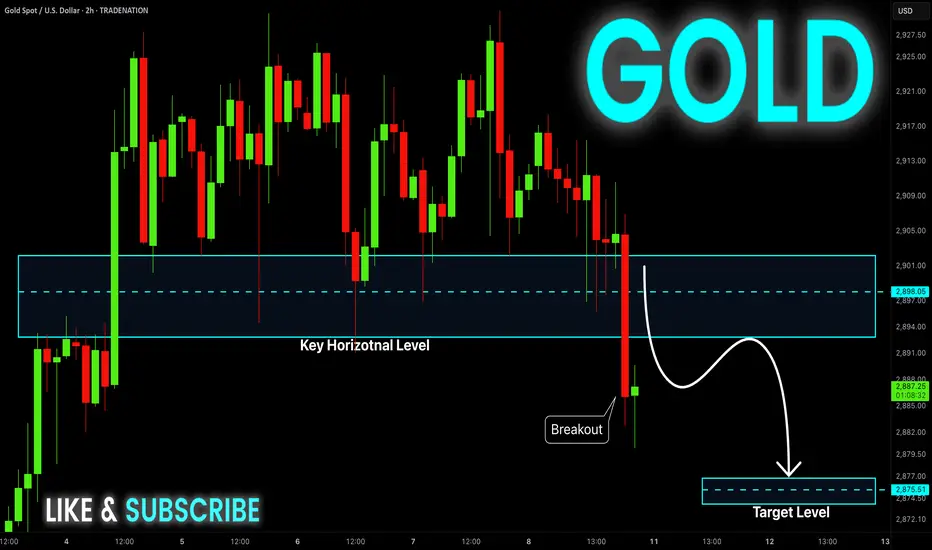
GOLD Risky Short! Sell!
Hello,Traders!
GOLD made a bearish
Breakout of the key
Horizontal level of 2900$
And the breakout is confirmed
So we are locally bearish
Biased and we will be
Expecting a further move down
Sell!
Comment and subscribe to help us grow!
Check out other forecasts below too!
Disclosure: I am part of Trade Nation's Influencer program and receive a monthly fee for using their TradingView charts in my analysis.
NIFTY : Intraday Trading levels and Plan for 10-Mar-2025 NIFTY Closed at: 22,552
Tomorrow's session will be crucial as NIFTY is near key resistance & support zones. We will analyze all three possible opening scenarios and provide actionable trade setups.
📍 Scenario 1: Gap-Up Opening (🔼 +100 points or more)
If NIFTY opens above 22,690, it will start near the Opening Resistance Zone (22,635 - 22,690). A strong bullish momentum can push prices higher, but traders should be cautious of potential rejection.
📌 Plan of Action:
If NIFTY sustains above 22,690 for at least 15 minutes, expect a rally towards 22,819 (Last Intraday Resistance). 📈
If price faces rejection at 22,690, wait for a pullback to 22,635. If it holds as support, consider a long position.
If NIFTY falls below 22,635, it could test 22,545. A break below this level may weaken bullish sentiment.
📢 Trading Tip: In a gap-up scenario, avoid aggressive long positions at opening. Wait for price confirmation to avoid FOMO.
📍 Scenario 2: Flat Opening (±50 points around 22,536)
A flat opening indicates an indecisive market, and price action around the Opening Support Zone (22,500 - 22,476) will be crucial for the next move.
📌 Plan of Action:
If NIFTY holds above 22,536 and breaks 22,545, expect bullish momentum towards 22,635, followed by 22,690.
If NIFTY fails to hold 22,500, expect a slide towards 22,476. If this level is broken, expect further downside towards 22,378. 🔻
For long trades, wait for price to reclaim 22,545 after testing support zones.
📢 Trading Tip: Avoid trading in the first 15-30 minutes. Let the market establish a trend before taking positions.
📍 Scenario 3: Gap-Down Opening (🔽 -100 points or more)
If NIFTY opens below 22,476, sentiment may turn bearish, especially if it sustains below this level.
📌 Plan of Action:
If NIFTY opens near 22,378, watch for price action—a strong bounce can lead to a recovery towards 22,476 - 22,500.
If 22,378 breaks, expect further weakness towards 22,299, which is the last major intraday support.
Any recovery will need to cross 22,500 for a trend reversal. Until then, bearish pressure will dominate.
📢 Trading Tip: In a gap-down scenario, avoid catching falling knives. Let support levels hold before attempting a buy.
🎯 Risk Management Tips for Options Traders
✅ Use Stop Loss: Always exit a trade if your stop loss is hit. Holding onto losing trades can wipe out profits.
✅ Avoid Trading Big Lot Sizes in uncertain conditions—start small & scale up when trends confirm.
✅ Time Decay Awareness: If buying options, avoid holding near expiry unless confident about a strong move.
✅ Hedge Positions: Consider using hedged strategies like Spreads to reduce risk.
📌 Summary & Conclusion
🔹 Above 22,690 → Bullish towards 22,819
🔹 Between 22,500 - 22,690 → Sideways range, wait for confirmation
🔹 Below 22,476 → Bearish towards 22,378 - 22,299
⚡ Patience & Discipline are key to profitable trading. Wait for confirmation before entering trades. 🚀
⚠️ Disclaimer
I am not a SEBI-registered analyst. This trading plan is for educational purposes only. Traders should do their own research or consult a financial advisor before taking any trades.
📢 #Nifty #Nifty50 #StockMarketIndia #OptionsTrading #SwingTrading #TradingView #NSE #IndianStockMarket #PriceAction #StockMarketNews 🚀

CADJPY - Take Advantage of This Clean Correction!CADJPY Daily Timeframe
CADJPY has shown a clear impulse in July 2024. We are now in a massive correction, consisting of 3 major waves, ABC. It appears we have almost completed Wave B and now we are anticipating wave C.
We expect wave C to push up to the corrective highs where we have the 61.8 fib.
Here are some key things to watch:
- Wave Structure: Ensure that Wave B has completed its corrective pattern
- Wave C Confirmation: Look for a strong bullish impulse off the lows of Wave B.
- Volume & Momentum: A rise in volume and bullish divergence in RSI/MACD could confirm Wave C is underway.
Confirmation for Wave C:
Break of Structure (BOS) / Trendline Break
When identifying confirmation for Wave C, a Break of Structure (BOS) or a Trendline Break is one of the strongest signals that the corrective phase is ending.
Break of Structure (BOS) – Key Levels to Watch
Wave B typically forms lower highs and lower lows. A break above the last lower high signals a bullish shift.
Look for a decisive close above the previous swing high on the 4H or daily timeframe. A weak break (with wicks) may indicate hesitation.
A higher low after the break adds extra confirmation.
Trendline Break – Reversal Signal
If Wave B formed a descending trendline, watch for a clean breakout with strong bullish candles (not just wicks).
Retest of the trendline as support after the breakout strengthens the case for Wave C starting.
Trade Idea:
- Watch for Wave C to start using the techniques listed above
- Once entered, keep stops below wave B
- Targets: 107 (500pips), 112 (1000pips)
Goodluck and as always trade safe!
See below for our previous swing setups:
Swing Setup 1
Swing Setup 2
Swing Setup 3

NZDJPY - 2025 Plan. Make It Your Best Year Yet!Here we have the 2 Day chart for NZDJPY.
We've seen a massive impulse mid 2024. We are now in an ABC correction.
We are currently in wave B of the correction, subwave B. Expecting subwave C to complete wave B.
We're looking for a rejection of the fib zone and a drop of over 700pips.
Trade idea:
- Watch for rejection of fib zone
- Once rejection appears, enter with stops above the highs
- Targets: 86 (350pips), 83 (700pips)
Once we've completed this move down, we'll be looking for longs. We'll update this setup if there's enough engagement.
Goodluck and as always, trade safe!

change the trendThe downtrend is expected to end at the current support level, then a start of an uptrend is possible.
Otherwise, a continuation of the downtrend is possible to the next support level.
EURUSD: Short Trade with Entry/SL/TP
EURUSD
- Classic bearish formation
- Our team expects fall
SUGGESTED TRADE:
Swing Trade
Sell EURUSD
Entry Level - 1.0835
Sl - 1.0936
Tp - 1.0653
Our Risk - 1%
Start protection of your profits from lower levels
Disclosure: I am part of Trade Nation's Influencer program and receive a monthly fee for using their TradingView charts in my analysis.
❤️ Please, support our work with like & comment! ❤️

USDCHF Long H4Remember, successful trading relies on proper risk management and a disciplined approach. Use stop-losses to safeguard your assets and carefully plan each trade. Analysis is the key to making informed decisions. Stay updated and continue refining your strategies!
