EURGBP UNPOPULAR OPINIONDISTRIBUTION INSIDE AN ACCUMULATION
I cannot tell you guys in full totality that this schematic is right for sure, it is just an anticipation of the many possibilities offered by the market.
Overall bias is shorts till they sweep the liquidity below.
Interms of intraday perspective I think price will continue down and reverse at 0.8500 zone in preparation of a lpsy.
Enter shorts if and only if price shows signs of a distribution to go lower at the first lpsy.
Wyckoffdistribution

Wyckoff's Accumulation phaseThis is Wyckoff's Accumulation phase that is tricky to understand, Wyckoff's methods are real smart money concept. Actually Wyckoff's understand how SM place their orders. So after a long time by studying markets sir Wyckoff distributed his knowledge between public. And reality is Support and Resistance work but not so nicely SM know how retail traders trade the market. So they break the retail levels induces public and collect their orders and reduce public From trades. Concepts are little bit complicated to apply in real time chart, but it actually works.
If anyone wants to learn those concepts then they can search on Google 'Wyckoff's method'.

POSSIBLE WYCKOFF REDISTRIBUTION SCHEMATICI AM AN AMATEUR SO IGNORE THIS CHART PLS.
MOST PEOPLE THINK WE ARE IN ACCUMULATION HOWEVER LOW VOLUME AND FAILED HH AND RELATIVELY STRONGER DUMPS THAN PUMPS INDICATE THIS IS A REDISTRIBUTION AND WE WILL LEAVE THE 30-40 RANGE SOON AND WILL REDISTRIBUTE BTW 20S AND 30S.
I AM NOT AN EXPERT. JUST PRACTICING AND NOTING FOR FUTURE MYSELF TO CHECK.

XAUUSD 56RR TRADE IDEALiquidity picked on a lower tf. Price at a key P.O.I.
Sell limit placed now we wait.
Risk manangement is key .Max of 1% per trade.

BTC Bottom is In
BTC very clearly followed a support line that broke leading to the flash crash we recently saw. This came after a textbook Wyckoff Distribution phase that lasted about a month or so (please google "Wyckoff distribution" to see related images).
The Wyckoff Distribution has been completed and we now move on to the next phase; accumulation. For the last 6-7 weeks btc has been in an accumulation zone right above a critical and extreme support zone (see chart for labels).
With the start of Q3 we can expect to see BTC make a recovery back above $50,000 and potentially set new all time highs in Q4 (more to come on that though). Market sentiment should reverse back to bullish in the next week or two.
If the price of BTC breaks below critical support we can expect to see $20,000 BTC once again however there is only a 20-30% chance that this occurs. Happy trading and see you on the next update!

USDCAD BULLISHUSDCAD has been on a monthly consolidation. Price was testing the previous low as institutions accummulate orders.
The accumulation cycle has been completed and we are now looking to be very bullish
This is a swing trade and positions will be added along the way
I will make a follow up post and leave a link here for my short-term perspective.

Is The Wyckoff Valid for Bitcoin?What is the Wyckoff Method?
The Wyckoff accumulation is a century old form of technical analysis created by Richard D. Wyckoff. It is based on the principles of supply and demand.
According to Wykoff there are two main phases in a market cycle: The accumulation phase and the distribution phase.
f this was our Wyckoff spring moment then July could be very exciting!
— Lark Davis (@TheCryptoLark) June 22, 2021
The accumulation phase usually follows a big price drop (Phase A) In the accumulation phase the price bottoms out as investors are starting to accumulate share or in this case Bitcoin. The demand and supply are close to even until slowly investors feel more comfortable to buy more and the price rises (Phase D and E in Graph).
The distribution phase can be imagined as the mirrored version of this graph. After a heavy price increase, demand and supply are even and the price stops increasing, over time leading to a larger crash in price.
Wyckoffs method states markets never repeat exact circumstances. So, instead of looking for the market to repeat itself, Wyckoff’s method requires analysts to look at broader sets of patterns. All price patterns vary slightly from previous incarnations either by size or volume to therefore making analysts adopt to different sets of outcomes instead of the same one.
The second rule to the Wyckoff method tells investors and analysts to respect market relativity. Meaning, in order to understand today’s market trend, one must also evaluate the past.
Finally, In the Wyckoff method, Wyckoff introduced three trends. These include up, down, and flat. He also introduced three time frames in his strategy: short term, intermediate, and long term.
Is the Wyckoff Method valid?
According to many experts in the industry, we could soon entering an uptrend in Bitcoin price.
“In terms of the Wyckoff method, this $28.8K lower low is very similar to the $65K higher high. Both cause a maximum emotional effect on market participants.”
Final thoughts
Time will soon tell if the Bitcoin bounce off of 28k support this week is the spring to send Bitcoin back to reach it’s previous all time high. Many in crypto are hoping for a bullish reversal of the market come July.

Distribution and consolidation of Wyckoff. Distribution and consolidation of Wyckoff.
schematically. probably faster.

BTCUSDT 4h, Wyckoff accumulationm, bearish days may be ending?!?This is update of previous idea, so please take a look at related ideas for more information and follow us to be informed of idea updates.
🙋 Please let me know what you think.
🚀 If you would like to be kept updated, please follow us.
🚀 If you like the analysis then do drop a LIKE and a COMMENT. Also do SHARE it with your friends.
🚩 Note - These are my personal notes and in no way a financial advice. Do your own research and Trade wisely

BTCUSD - BUY: Wyckoff theory - The start of the next bull run I guess this explains everything
Go have a look at Wyckoff's theory on google, things will start to make sense
Get ready for the next bull run
Keep buying more during the dip, it's just at a discounted price, and keep holding - do it for the long term
HOLD HOLD HOLD!!!!!!!!!

The One Chart That Hasn't Changed. Money for the chads.To the people that follow i might do request on TA for any pair side note no meme coins please but i might still do it. Get them Sats.

Wyckoff Re-distribution I still believe this is a re-distribution.
Targets and Invalidation clear in the chart.
Lets see how it plays out.
Trade safe and manage risk.
ARMTrades

AUDJPY - NeutralWe are in phase B. This means that we have to do nothing! and wait for more information and getting to phase C.

BTCUSD Large Wyckoff Distribution PatternLarge Wyckoff Distribution pattern still in play, but not yet confirmed.
BTC still looking weak in the 1Day, we're not out of the woods yet.

BITCOIN - From Wyckoff To Trend AnalyzeHere is my analyze of BTC price action, from wyckoff to chart pattern and trend analyze. Hope it is helpfull
Have Fun and trade safe.

BITCOIN - Wyckoff Redistribution UpdateHello everyone, rouzwelt here
Well I have demonstrated Wyckoff Backup Action Events in my last idea as you can see in the screenshot below (full article link at botttom of page), and as of right now we have seen clear rejection from our resistant line at 32300 (PS) , and price action is showing that it's weak and can dump more. and the projection I have shown in the Screenshot is playing out somehow.
I want to note something in the next Screenshot below, and that is as you can see, price action have clearly broke down local trend lines (yellow lines) it could have formed. that's not good but I just wanted to note this so that we can see btc couldn't form a local trend line to find support at. but let's see if the current one can hold or not.
Anyway, Let me say something, whenever price is going up you want to see volume coming in and increase at rallies up and decrease at reactions and vice versa in the opposite direction. Now let's get back to the main chart. I believe that btc is weak right now, we don't see volume coming in at rallies high, actually its the opposite, we see volume at rallies down and decrease at reactions up. And that's what we are seeing right now at the btc 1H chart which I believe is pointing lower levels at this point.
But let me say smoething, that can reverse for a short period of time and we can head high locally to the blue trend line drawn in the main chart, well if we see this happening then I'd like to see the price squeeze around the blue trend line and a break out after that, only in that case I would open a long position for a short-term uprise. But lower levels are the more probable scenario (the red arrow price projection), and if so, we will get the last LPSY in back up action phase of wyckoff method and then I would be opening my swing short position.
Let's end by saying that the blue trend line in the main chart is the most important level for me to break if BTC wants to head high and test 36.5/38/40/42k resistants and potentially showing some strengths after almost 3-4 months.I don't want to sound bearish and actually I hate bear market as much as you do but we need to see some sign of strengths before saying we can see higher levels at least at this stage.

BITCOIN - Wyckoff Redistribution Backup ActionHello everyone, rouzwelt here
As I demonstrated in my last idea which you can see its screenshot below (Full Article Link Bellow) that we need more info and more candles to get printed so we can begin to say wether BTC is in accumulation or redistribution phase. And right now after BTC failed to break Last Point Of Supply and rejected, we are seeing a lower low getting printed, although that's not the best news, but that shows us that we need to be prepared and position ourselves accordingly.
And right now we can clearly see that BTC have entered its backup action phase, where a smaller version of wyckoff method is playing out. I have noted the events in wyckoff method in the chart and projected the price action which is probably going to play out going forward. Price now may rise to middle of the wyckoff channel then gets rejected that forms the LPSY in Backup Action before dumping again to print a local lower low (below SOW - bold red line) or a golbal lower low (below SC - dotted red line) and forming the last LPSY which is where I personally am going to position myself right there.
Although I should note that there is still a chance for this idea to get invalidated if we start rally higher and print a higher high, break above the 35/36k resistant and head to our main resistant area of 42k, and when that happens I'm going to start thinking that this whole price action of last few weeks may have been an accumulation, but we sure need to see BTC break above 42k resistant and print a higher high, that's the key. But for now the chances are low as BTC is close to the bottom of the channel and we don't see buyers showing any sign of strengths. I should note that the higher the volatility at this stage the more chance BTC is in redistribution rather than accumulation.
How much price can dump if this idea plays out? I don't know and I don't care at this moment, all care about is that I can open my position with minimum risk possible, and on that note I'm going to end here.
Have fun and trade safe.

Wyckoff Redistribution or Accumulation??I have been looking closely at the price action since we have fallen down to 30/40k area, as I have demonstrated in the chart as you can see the wyckoff phases, right now as we have bounced from the lower 30/29k area with a wick it may be an early sign of spring, and as we know it if its a spring we should see a macro higher high, that means btc must break 42k resistant and close above it daily. if we get that its a confirmed spring and we can look for buy setup on backup action. but if even we get a spring and head high it would more be a dead cat bounce and can reject at 50/60k area.
but the second scenario is that we have printed a SOW (sign of weakness) and now we are at last point of supply, which means that lower levels are ahead.
I know that might not be the best news for many of us, but we should stay balanced and look for both options, as if you dont pay attention to the worst option you might get wiped out.
As for my own personal opinion, I believe the chart looks more like its redistribution rather that accumulation, I say this because we had an clear UT that rejected badly to 29k area, yes it didnt close below 30k but thats more a sign of weakness to me rather a spring. before this week we had some good bullish news but i think they came at the worst time possible, and now they are forgotten like El Salvador news, so they didnt effect the market as they would have if came at a better time. I dont want to sound bearish but I believe there are many strong resistants up ahead that each of them can reject BTC hardly.
right now Id rather monitor the price action closely to see how candles get printed and then I will plan my entry according to that. thats the best strategy for now at least for mid-term cause that would reduce my risk to minimum, cause the price action in the 30/40k range so far have been haunting everyone's SL.
Anyway let's wait and see what happens and know that if you are using wyckoff as your main strategy, you always wait for confirmation and you make all of your money and profits in between, you dont buy the low, you dont sell the high.
Trade safe and practice risk management all the times.

NASDAQ 100 LIKELY TO CRASHMicheal Barry, Warren Buffet among many others have been predicting a market crash. Bill gates has sold majority of his stocks and many other big market players are withdrawing.
The USTech100 and Us30 follow the same trend as the Nas100.
Gear up for a nasty ride down.

MICRON TECHNOLOGY DISTRIBUTIONI will be using this for study purposes only since the move is slagish and worth very few pips.
Distribution occurs in many forms, The above distribution has a leading diagonal to mislead buyers before tanking.
We are most likely in the last point of supply at the moment

USDJPY | Market outlook
The Bank-of-Japan after concluding a two-day monetary policy review meeting on Friday, kept its monetary policy settings unchanged as widely expected.
BoJ kept its 10-year Japanese Government Bond (JGB) yield target around 0% and a short-term interest rate target at -0.1%.
The central bank extended the pandemic-relief program beyond the current September deadline by six months to March 2022.

Wyckoff DistributionLearning Wyckoff so may not have all the labels correct.
Only issues is the SL is too high but best I could do on 1M TF.

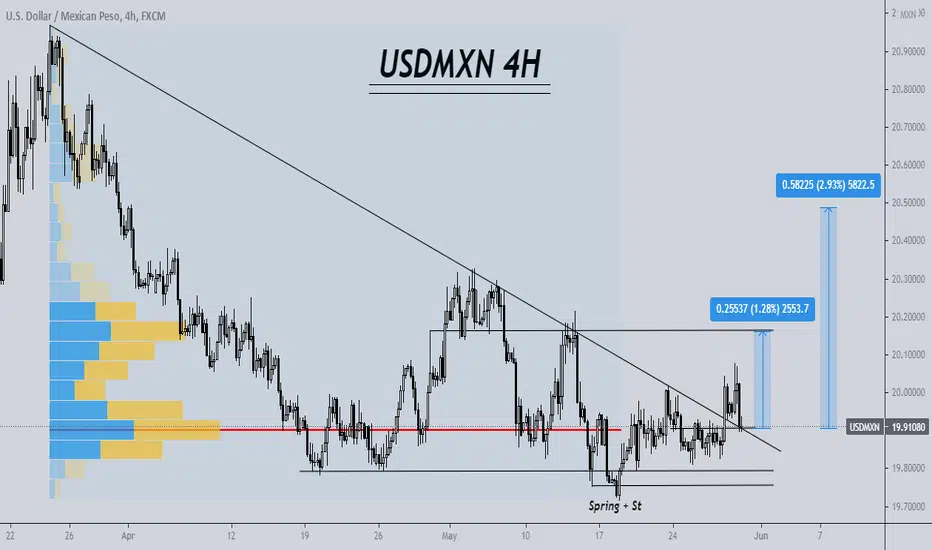
USDMXN WYCKOFF DISCTRIBUTION ANALYSISTrade Proposal:
There is a probability of first tp to the proposed ( 20.16 ) Direction line. So, Traders can set orders based on Price Action and expect to reach short term goals.
Technical analysis: USDMXN Waiting for the Range Bound and the beginning of the Ascension Trend.