Wyckoffdistribution


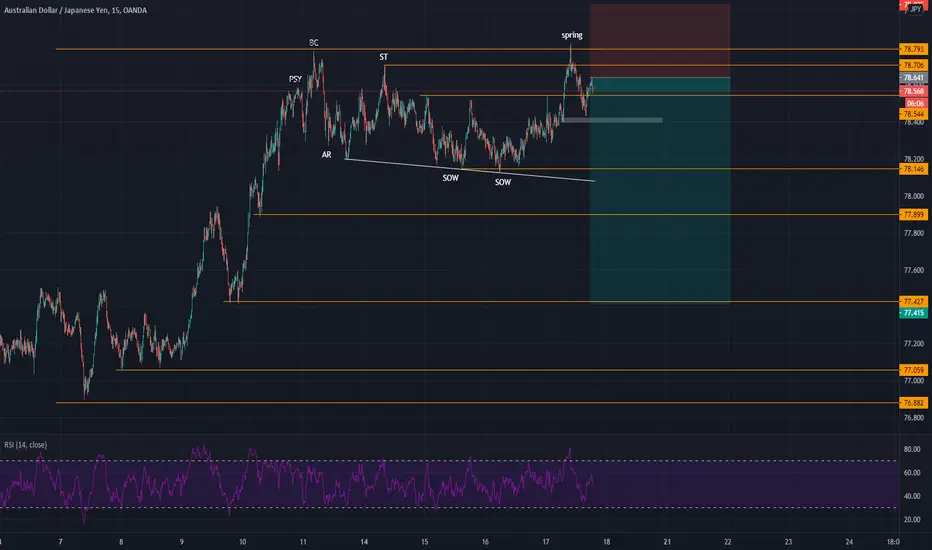
NIFTY IN WYCKOFF DISTRIBUTIONNifty first became overbought in the primary trend channel and now in distribution phase of wyckoff cycle. All the components of distribution phase are labelled.
PSY = Primary Supply
BC = Buying Climax
AR = Automatic reaction
ST = SEcondary test
SOW = Sign of weakness
UTAD = Upper thrust after distribution

GBPUSD SHORT STILL HOLD MY SHORT BIAS ALTHOUGH WASNT AS MUCH CONVICTION AS ID LIKE TO SEE OFF THE MOVE YESTERDAY, A FINAL TEST OF THE HIGHS BEFORE A SELLL OFF WOULDNT SURPRISE ME SO ILL BE LOOKING FOR THAT SWEEPING REJECTION WITH RSI DIV

WYCKOFF DISTRIBUTION ON GBPCHF NOT AS HIGH PROBABILITY FOR ME NOW AS UTAD DIDNT SWEEP THE HIGHS WITH RSI DIVERGENCE THATS AN IDEAL SHORT FOR ME FOLLOWING DOWN WITH A HIGH MOMENTUM MARKDOWN TREND CONTINUATION TECHNIQUE

EURJPY POTENTIAL WYCKOFF ACCUMULATION Potential manipulation before mark up phase and mark up trend following

eurusdDxy is currently rallying to make a break of bearish structure on 4h at 91.010, eur zone central banks are dovish, in monetary policy trying to save their neck from deflation they have had a negative gdp and now a gdp of 12.5% their central bank are accepting QE in other to have money in the economy devalue the euro, USD is going to approach inflation way before eur and increase interest rate, and so far their QE has been positive on economy yielding higher gdp of 33.7% and and higher consumer spending, but BOT for usd has been negative,eurusd interest rate differential is negative with respect to usd having a stronger rate to euro, now my technical support is wychoff distribution on eurusd h4, and and redistribution on xauusd h1, volume has eluded the highs of the consolidation but resided on the lows.
Remember, you have to follow-up the fomc release as well as changes in ecb interest rate, but if all factors remains the same the dollar is going to rally further against the eur

bearish idea Wyckoff + ICT smart moneyWyckoff distribution , sessional tendency of EUR bearish and price action is beautiful

Wyckoff Distribution SchemeTime to go down. I think we're in a Wyckoff distribution scheme. Target around 36K but might drop even more.


the real second wave and USOILPotential path of distribution schematic for usoil. Early in the supposed schematic and this idea is a loaded assertion, one that is counter to the mm narrative of soon to be administered (forced) vaccinations. Oil retreating again to such lows would be due to another shut down of the global economy beyond the scale constituted by current lockdowns. This pattern could be foreshadowing things to come for economic activity whether due to renewed and tighter lockdowns as we enter 2021, civil unrest, COVID manifesting into the menace that mm and governments portray it to be or, else.
For me, this analysis will pose simply as a cautionary barometer for any long CAD and AUD positions as USOIL price upthrusts and (if schematic holds to UT) again upthrusts after distribution.


Wyckoff - Price CycleTextbook educational example of the Wyckoff Price Cycle, focusing on; Accumulations, Distribution, Markups, Markdowns, The Spring and UTAD.
The graphic doesn't take into consideration the finer details of both the accumulation &/or distribution schematics nor does it focus on the re-accumulation / re-distribution schematics.
Please see our other ideas for a specific breakdown of the above ^
Please also feel free to comment or reach out to us.
Trade Smart!
Phantom

BTC SHORTWe currently mitigating an institutional candle at the time of this post and since we had a break of structure earlier... we expect a further move to the down

AUDJPY Short Setup Wyckoff pattern for short trade has been formed in H4, while entry point is sighted in H1 and M15. Let's grow together! FX:AUDJPY


AJ DISTRIBUTION SELL - WYCKOFFWE CAN SEE THE BEGINNING OF A TEXTBOOK ABC DOWNTREND MOVE AFTER THE TEST FROM THE SPRING.
GBPUSD Short - H1 Divergence and Breakout - Enter off imbalance4 minutes ago
Hey guys
Please give me some feedback, I would much appreciate it
- Price broke weekly key level then rejected down
- Price showed indication of distribution
- Looking at divergence on the 1hr timeframe signifying down trend
- Break to the downside of rising wedge
- Imbalance candle on 15m timeframe lined up with 50% fib retracement.
If you feel the same or disagree with me, please share your analysis with me!

wyckoff distributionyou can see on the chart a classic btc distribution, right now is the perfect moment to short. 17800-17900 should be the max for the last point of support.
very juicy gains in the making if you take this short. i think the target will be between 13k and 14k

BTC/USD: Advanced Wyckoff Accumulation AnalysisIn this post, I will be analyzing Bitcoin's hourly chart based on the Wyckoff accumulation gradient of rising bottoms.
Terminology
- Preliminary Support (PS): This is where substantial buying begins to provide pronounced support after a prolonged downtrend.
- Selling Climax ( SC ): This is the point at which widening spread and selling pressure usually climaxes and heavy panic selling by the public is being absorbed by larger professional interests near the bottom.
- Automatic Rally (AR): This is where intense selling pressure is greatly diminished.
- Secondary Test ( ST ): A point in which price revisits the area of the Selling Climax ( SC ) to test the supply and demand balance at these levels.
- Last Point of Support ( LPS ): The low point of a reaction or pullback after a SOS (Sign of Strength)
Analysis
- Phase A: This phase marks the stopping of the prior downtrend. Up to this point, supply has been dominant.
- Phase B: This phase serves as a function of a new uptrend. This is where professional interests accumulate, at relatively low prices, in preparation for the next markup.
- Phase C & D: This is where Bitcoin's price goes through a decisive test of the remaining supply, allowing smart money investors to confirm a markup. If the analysis is correct, this is the phase in which consistent demand dominates supply
- Phase E: The asset breaks out, leaving the trading range, and the markup is obvious to everyone in the market.
Don't try to predict the market. Take it by levels, and play by probabilities.
If you like this analysis, please make sure to like the post, and follow for more quality content!
I would also appreciate it if you could leave a comment below with some original insight :)
