Wyckoff Accumulation Schematic on BTCHi guys,
You can spot a clear schematic of accumulation behaviour on BTC market. you can find references about the very similar schematic on famous websites. BUT
BUT
there are signs of weakness in this pattern formed in BTC. first of all (but not least important), on ST points (Secondary test points), we have two exceptions:
1. We have more than 2 ST points, which is not a very bad sign by itself, but the problem is that we prefer to see low selling pressure or volume (or at least low price tails below recent supports (which neither are met in this pattern)
2. third ST point is totally unrelated to a swing. its a drop. with high momentum but with most of the volume at the very bottom. so we can't relate to that either.
there is an exception in SC too. we'd prefer to see a more clear SC. but Selling climax has built a zone instead of a valid clear support. that's why in higher timeframes we can't really spot a major low (to consider in our drawings)
Feel free to ask questions in Comment section below!
Wyckoffmethod

PG Hello friends! now let 's analyze the PG company my Wyckoff Line indicator, which you can access and which clearly defines the liquidity zone of professionals , as well as with which you can determine the liquidity zones and, accordingly, understand where the accumulation is .
Where is the distribution absolutely clearly and determined the repulsion from the liquidity zone at the very bottom
You can also see that I recently made a deal on the chart , this mark is marked with the mark b 1 ,
which also absolutely clearly indicated the purchase before the decline
On the right we see the relative strength index , which shows that at the moment the company is still in a negative moment relative to the market and it is not yet ripe for purchase at the moment and we must definitely wait until the price reaches the liquidity zone , after which we will already look at the relative strength index and certainly by sector
Thank you all
Click like subscribe necessarily if the review came in! Then I will post more ideas .
My chat of learning and analysis Wyckoff Analytics search in chats and subscribe
Friends, I conduct training in an individual format and in a limited number of students, since a large number will interfere with my trading!
The training course includes :
The Wyckoff Method
Demark method
VSA
A trading method tailored to your psychotype
Psychology of trading
For details, write in a personal message
I can also introduce you to my own unique indicators , of my own design
Wykoff Zone (You determine the activity and zones of smart money and also gives buy and sell signals )
is a Demark indicator that has no analogues on the platform - since most of the indicator are far from the essence of the Dymerka technique and are too simplified , which violates the basics of the principle
For investors, I can shift a 2-week lazy investor course where you can learn how to invest correctly and in which stocks + the tic-tac-toe method
supplemented
with your own developments taking into account the imbalance of supply and demand

BTC-USDT(Accumulation zone-Wyckoff Method)
Accumulation schematics by Wyckoff represents a primary model for accumulation(coin collection).it works to represent and examine the accumulation process.Besides,accumulation schematics also provide important phases to guide us through the trading position.
Phase A:
Indicates the pause of the downtrend(trading range).Till this point,supply remains dominat,which is witnessed in a decrease in coin prices for a short time accompanied by a heavy trading volume .You can see these events on price charts where heavy volumes are visible due to large tranfers of coins by the traders.here selling pressure also results in a slow downtend and an increased trading volume indicates the beginning of this phase.
Phase B:
this phase is based on Wyccoffs law cause and effect,as it is normally seen as a cause that results in an effect.The composite man gathers the highest volume of coins during phase B.During this stage,the market tests both support and resistance levels of trading range(TR).In simple terms,the price changes are wild and affected by higher volumes.Eventually,when the supply of coins is exhausted,the coin is ready to switch to phase C.
Phase C:
During face C, spring (shakeout)the price below the support level og the trading range quickly reverses and moves back into the trading range.You can consider spring as a period of the coin below the support zone to attract traders and investors.Its a final attempt to purchase the coin at the lowest rates before the rates rise again.its also notable that the bear trap attracts inexperienced investors to sell coins at low rates and wait the dump which evantually does not occur and price instead rise from that point without actually reaching that dumping point.In simple terms, spring (shakeout)is not always useful as trading volume remains unpredictable.
Phase D:
This phase is a transition between cause and effect,as its stands between phase C accumulation zone and the breakout of the trading range phase E.During phase D,an investor should keep the dominating demand over supply under consideration.During this phase ,the price rises to the top of trading range,you should strictly follow the potential dominance of demand over supply,the price normally moves to the top of the trading range and last point support provides excellant platforms for making a hefty profit.However,it is also notable that there can be more than one point where a downtrend is excpected to be paused due to an increased buying demand(last point support)phase D.
Phase E:
Is the final stage in which the coin leaves the trading range and demand comes in action.You can observe some typical reactions during these phases,such as most investors temporarily quitting their coins.

Short-Term NASDAQ P&F Targets 4-11% DownThe above chart is a summary of my short-term P&F targets for $NQ. These targets are actually clusters of targets taken from recent distributional patterns that are visible on the 5 minute P&F chart, shown below (click to expand):
The Point & Figure chart spans just over a week, from May 15th. Being volatility adjusted, a P&F chart captures trading range structures better than regular bar charts. We can also use them to forecast possible price targets. A P&F target is where price could go before pausing in another trading range, based on the Wyckoff principle of effort and result.
You can see that on the P&F chart, I have drawn four trading ranges bounded by blue lines. From left to right, we see two re-distributional structures, one small accumulation, and the most recent prospective distribution. I'm calling this prospective because there's still a chance that the current decline could become a spring within an accumulation. We need to bear this in mind and keep our options open, but given the bearish background and what I'm seeing so far, I'd put it 70/30 in favor of distribution.
Using the Wyckoff P&F counting technique, I have projected several price targets from each structure. There are conservative targets and more aggressive targets for each (follow the arrows down from the count lines to the shaded target areas). As shown by the blue balloons, the most conservative targets for the first two distributions each projected the price level for the subsequent trading range pretty well.
It is good to keep a note of the more aggressive targets as these can be hit later on. The chart sows that multiple targets have clustered around two price areas, 10,950-11,310, and 10,455-10,770. These confirmatory counts give increased credibility to the target clusters.
Assuming the most recent trading range is distribution, then the most conservative count targets 11,670. Commonly, in a distribution, this is where we can get a Major Sign of Weakness (MSOW) - an intermediate reaction before price collapses faster (Wyckoff Phase E). We could get a MSOW at 11,670. Or, a new trading range could form and may even be an accumulation. We will just need to read the chart as price unfolds. However, given the bearish background and lower P&F target zones that are yet to be reached, I'm betting on more weakness ahead and am short the NASDAQ via puts on QQQ.
I'll add more analysis as the story unfolds - please remember to like and subscribe!
Good luck out there!

Potential Accumulation FormingGold - Potential accumulation forming, i want to see another SOS/candle close above before a pullback into the TR then i'll look to take this long!
Let me know your thoughts!
* Disclaimer **
These ideas I never trade until the end target with my initial lots, I focused on high probable entries with higher lots and use a specific partial taking strategy giving me a very high win rate and take most of my profits very early, I only leave a small % of my capital to run the entire trade. On the flip side im constantly monitoring LTF momentum and will close early if things change, these analysis's are for research purposes only.

VIEW Looking good to short in the ... Short ViewWhether this is a level 2 Wyckoff Method with a further rise to Level 3 ($1.30 range) or an M top formation, a retrace is do after it's insane 40% rise these past few days.

How far could FaceBook face plant? Down to the 2019 low.Firstly, a hat-tip to Wyckoff Analytics for identifying this Meta Platforms short as structural trade, comparing it to the structure of NFLX. Pure genius!
Today, that seems to be paying off with FB down as much as 9.36% in extended hours trading.
The above chart shows my analysis of possible targets using Wyckoff P&F charting method. You can see that the first target from the original apex distribution, which started in August 2021, has been met pretty perfectly by this current (prospective) re-distribution structure. The Wyckoff methodology has us look out for a trading range at the target, and that is exactly what we got.
That trading range is looking a lot like re-distribution, especially given the overnight price action. So, I have added some targets based on this re-distribution structure. Price is already in the zone of the most conservative target. That might mean that there is some consolidation here as a Major Sign of Weakness (MSOW). Two more aggressive counts are provided of 138-150, and 99-138. I will look at some "fine tuning" of these with intra-day counts later.
The structural analog targets around $115, which is the center of my most aggressive P&F count and targets the 2019 low. It's really powerful when two separate techniques confirm each other.
As always, we need to judge the market by its own actions. The analog and P&F counts could both fail, and we might find that the current structure is actually accumulation. So, keep on your toes, but I'm personally short FB and I'm not exiting yet.

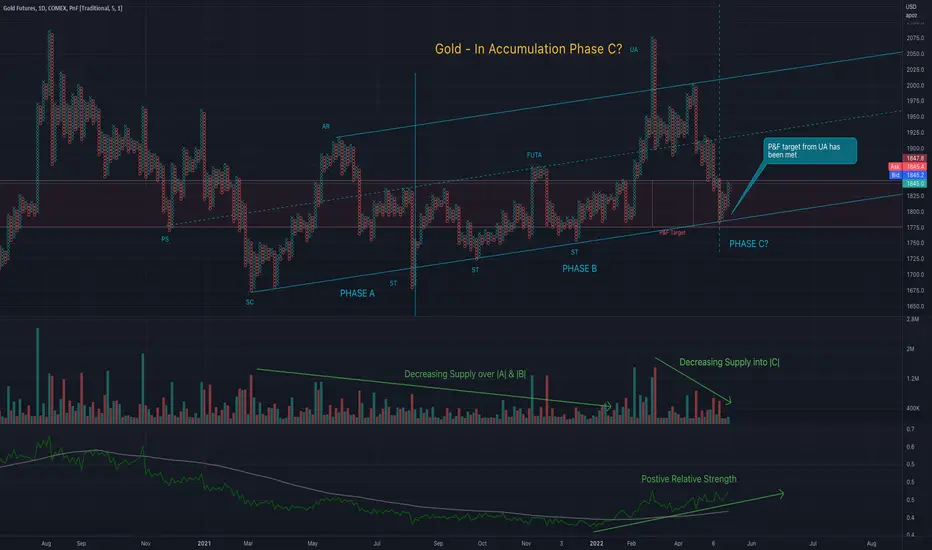
Is gold in Wyckoff accumulation Phase C and ready to rally?This Point and Figure chart shows that gold may be in Wyckoff Phase C. It is still a little early to say for sure, but there are some positive signs. Supply has been reducing over what looks like Phase A and B, which is consistent with an accumulation structure. There has been reducing supply into the prospective Phase C. If the structure were distribution, we would expect to see supply increasing here. There has also been positive relative strength vs. equities all year.
After a hypodermic top in March, gold has been moving down with pressure from the USD and rising interest rates. However, there are signs that rates may have peaked for the short term. The USD has also shown climactic behavior. Plus, gold is getting a bid from the possible (and likely, in my opinion) general capitulation in equities that is about to happen.
My downside P&F target for the hypodermic top has now been met, so at the very least we should expect some consolidation here. Yesterday's Sign of Strength bar was a hint that demand is coming in. I will be looking closely at any local accumulation structure that is made here, to set targets for the next leg up into a Last Point of Support. What we need to see next is a commitment above 1860 to act as a confirmation.
AU Pa Breakdown, and Idea!Here i'm breaking down AU as well as give you an idea of where it might go next!

Spread triple top and BottomThe normal triple top has no gaps between
the tops. The same philosophy applies in this pattern as in the triple top. In
each case, the stock rises to a certain price level and is repelled two times.
The third attempt at that price is successful by the stock’s moving through
the level shown by a column of X’s exceeding the point of resistance. since
the stock was repelled twice at that same level, there are apparently sell
orders there. The reason is not important. What is important is that there
are sellers at that particular level. The only way to know if demand can
overtake the selling pressure is to see how the stock negotiates the level
again. simply stated, if the stock is repelled again at this level of resistance,
the sellers are still there. You need not know any more. If the stock exceeds
that level, then demand has overcome the supply that previously caused it
to reverse. This is why we always wait for a particular level to be exceeded
before we make a long or short commitment in the stock.
Friends, I conduct training in an individual format and in a limited number of students, since a large number will interfere with my trading!
The training course includes :
The Wyckoff Method
Demark method
VSA
A trading method tailored to your psychotype
Psychology of trading
For details, write in a personal message
I can also introduce you to my own unique indicators , of my own design
Wykoff Zone (You determine the activity and zones of smart money and also gives buy and sell signals )
is a Demark indicator that has no analogues on the platform - since most of the indicator are far from the essence of the Demark technique and are too simplified , which violates the basics of the principle
For investors, I can shift a 2-week lazy investor course where you can learn how to invest correctly and in which stocks + the tic-tac-toe method
supplemented
with your own developments taking into account the imbalance of supply and demand

BTC in Phase B of a Wyckoff Re-Distribution Trading RangeIn my previous publication, I opened a long position at what I thought at the time was a selling climax (SC). My analysis was incorrect, as what I thought was a SC was, in fact, a preliminary supply (PS) like event. The PS is known as the first concerted attempt to stop the down trend. Lesson learned.
Nevertheless, the BTC price has entered another Wyckoff re-distribution trading range, which is to be confirmed or to fail based on market events.
We are in Phase B as we’ve observed the SC and the automatic rally (ARa). Therefore, I’d expect the price to test the lower boundary of the trading range in the form of a secondary test (ST). This idea is consistent with the Phoenix Ascending (PA) indicator, given in the lower panel. I expect the red line to be rejected near level 50 then turn back down and for the green line to continue moving downward. The energy fall below 50 soon, indicating downward pressure on the price.
Significant bars, which help define important areas of support and resistance, are given by the blue shading.
Wyckoff abbreviations: automatic rally (ARa), selling climax (SC), secondary test (ST), upthrust (UT), upthrust after distribution (UDAT), preliminary supply (PS), failed upthrust (FUT), last point of supply (LPSY), shakeout (SO), sign of weakness (SOW), Phase A (Ph A), Phase B (Ph B), Phase C (Ph C), Phase D (Ph D), Phase E (Ph E).
This is not financial advice. I am not your financial advisor. This is my opinion.

Wyckoff Distribution Schematic On DJIWhich comes first, the chicken or the egg?
With recession talk being forced upon the economy, and many negative economic factors likely playing a huge role, it begs the question.
With a understanding of Wyckoff and how large institutions transfer money, one could see how the looming recession may not be such a unlucky series of events?


Multi-year Wyckoff patternAt this point in time we still need to confirm our ST - but as we are currently highly oversold I'm expecting a bounce here.
According to Wyckoff, this bounce should then bounce us all the way up to the AR level - after which we expect to fall down and ignite that spring reversal.
I'm expecting the spring to be around the 20k level as it will break the 200 weekly SMA to shake out weak hands and create max pain whilst still maintaining market structure by staying above the previous ATH.
As the title suggests, this pattern will take years to play out - giving current financial, economic and geopolitical adversities a chance to cool down and providing unseen opportunities for institutions to get in at a low price when regulations are finally set in place.
I wouldn't be surprised that when the spring occurs, the fed will pivot dovish, a physical BTC ETF will launch and geopolitical unrest cools off - all around the same time, creating a bull run unlike any other; finally passing the chasm on the adoption curve.

♻️ Wyckoff, again, again and AGAIN ⁉️ - #LDTP 8.2Let's do the point !
I will go straight to the point : I don't like this Wyckoff Accumulation Pattern at all ! Let me explain and I will be brief : Volume are constant so ... we expect a spring most of the time. Take a look at the spring area and ... it's terrible.
To remind, we are just on the primary support of the weekly upward channel which is the yellow line between the two grey support areas, we are just over the support of the bullish trend which is the grey area of $33,000 - $28,200 and the last barrier before the bear side of the strenth. I believe in Wyckoff BUT I don't believe in the psychology of this market (for the moment) and when I see the spring area just under the support area, ... I don't believe it can hold the flush or in other way : Could institutionnals absorb all the selling exhaust ? Believe me, if it happen, this will be the biggest volume that we ever seen on BTC for sure.
So multiples options to don't see that happen :
Another cycle inside the range with falling volumes to avoid this possibility of spring
Too strong support of weekly channel which mean we can't go retest the support area of Wyckoff and so avoid the spring and precipitate the bull breakout
Break the support area of Wyckoff and see directly a strong pressure of the grey support area to create a STB and possibly a bull breakout or falling volumes (like June 2021)
Do a short spring which mean reach only the top of the spring area. It could avoid the flush by not breaking the support area.
I hope for everyone that, if we have a spring, you have your stomach well attached because it's going to be sporty (and maybe sweaty). Either way, it's the goal of this pattern to play with psychology of the market, so what's best to put it on the key level of the market ?!
In the case Wyckoff fail, it will be a new perspective of the market, a perspective where we will have to project to the bear side.
Don't forget : "Making money in trading is math and respect of strategy, so never let your emotions guide you in uncomfortable positions"
Like, follow or comment if you like, it give me some strength to continue !
I will update this idea with evolution of the pattern.

Possible ? AUDUSD MONTHLY TFWhat do you think ?
.
.
This is Not Financial Advice
.
🧅JUST AN OPINION OF THE ONION.🧅

DAILY TF OverviewPossible?
.
what do you think?
.
.
This is Not Financial Advice
.
🧅JUST AN OPINION OF THE ONION.🧅

Wyckoff method - lets see whats happns ok guys we still dont know where exactly spring is or when phase c , d , e will be created but when we locate the spring ... it will be so ez

Bitcoin 4H range. My thoughtsBitcoin has been consolidating inside of a range since the beginning of 2022. This range is showing obvious signs of a distribution phase (manipulated highs/higher highs).
Right now it seems like there are equal lows at around 37k ready to be wiped for liquidity. There is also a daily supply zone at 46-48k which I think price is very likely to tap for one more higher high before topping out and moving lower. Now whether 37k gets manipulated first or 46-48k I have no clue tbh but it makes more sense for it to move up to the daily supply before going down to tap the lows at 36k and later 30k. So if I had to choose, money is on 46-48k first then 37k. Now do with that information as you will, and as always, gl traders!
NOT FINANCIAL ADVICE!

Long BTC at Selling ClimaxPreviously, I’ve demonstrated stepping-stone descending horizontal Wyckoff re-distribution trading ranges for BTC. Interestingly, the last 3 transitions from Wyckoff re-distribution Phase E to Phase A were similar. In all 3 cases, we observed a climatic level of volume. In all 3 cases, we observed sell bars with a large spread. The percent change in price for these Phase E/Phase A transitions were -26.84%, -21.28%, and -24.98% in Dec 2021, Jan 2022, and May 2022, respectively. In all 3 cases, we observed a selling climax (SC), which serves the purpose of stopping the down trend, followed by an automatic rally (ARa). I expect that we will observe an ARa to the first area of important resistance, which is the open of the May 9 sell bar ($33,945).
I have opened a long position at $30,476 and I have a take profit target of $33,945, which is an 11.38% profit.
Significant bars, which help define important areas of support and resistance, are given by the blue shading. The blue arrows point to volume spikes.
Wyckoff abbreviations: automatic rally (ARa), selling climax (SC), secondary test (ST), upthrust (UT), failed upthrust (FUT), last point of supply (LPSY), shakeout (SO), sign of weakness (SOW), Phase A (Ph A), Phase B (Ph B), Phase C (Ph C), Phase D (Ph D), Phase E (Ph E).
This is not financial advice. I am not your financial advisor. This is my opinion.

LUNA/USDT Effort v. ResultBottoms are usually resultant from increased effort and less result. The current candle suggests that a bottom may be forming for a bounce at the least, if not a full reversal. We will need to see how the daily closes.

BTC/USD Wyckoff Accumulation Updated May 2022Let me start by saying this is not financial advice and this prediction is purely based Wyckoff Accumulation theory. Current Bearish sentiment and global financial state could change everything anytime so please DYOR before making investment decisions. Also please do not take the price point and timeline literally because this is a pattern prediction.
This prediction is based on assuming BTC has found some support at 30k or in this area which makes an ST in phase B. Based on this, BTC looks like forming the following Wykoff Auumulation patterns -
Schematics 1 - Green
Schematics 2 - Orange
According to Schematics 1 - Spring could be anywhere between 20k to 30k depending on market sentiment and assuming 30k is the ST in phase B.

BTC Short Near Trading Range SupportThis chart builds on previous ideas I’ve shared regarding the BTC price action since October, 2021. In a previous publication, I stated that we likely had observed a shakeout (SO)/sign of weakness (SOW) in potential Phase D of Wyckoff re-distribution. I presented a scenario that would confirm my idea (solid red line). According to this scenario, we would observe a last point of supply (LPSY) event followed by the price breaking the trading range support to the downside. I presented a scenario that would disconfirm my idea (solid green line). According to this scenario, we had observed a SO/Spring event, which would be followed by a sign of strength (SOS) rally. The price data from over the last 12 days seems to confirm my idea of stepping-stone BTC Wyckoff re-distribution.
Given the observation of a likely LPSY, we may open a short position near the trading range support (approximately $41,000) or at the present price. The take profit targets are at the next support levels; specifically, $37,400 (-5.4%), $33,700 (-14.4%), and $29,900 (-25.2%).
The upper and lower boundaries of the trading ranges are given by the solid black lines and black dotted line. Significant bars, which help define important areas of support and resistance, are given by the blue shading. The blue arrows point to volume spikes.
Wyckoff abbreviations: automatic rally (ARa), automatic reaction (ARe), buying climax (BC), secondary test (ST), upthrust (UT), failed upthrust (FUT), last point of supply (LPSY), shakeout (SO), sign of weakness (SO), Phase A (Ph A), Phase B (Ph B), Phase C (Ph C), Phase D (Ph D), Phase E (Ph E).
The Phoenix Ascending (PA) indicator by @WyckoffMode is given in the bottom panel. The projected path for the red relative strength index (RSI), blue least squared moving average (LMSA), and energy (E), are given by the red, blue, and grey dotted lines.
This is not financial advice. I am not your financial advisor. This is my opinion.
