Wyckoff Anatomy of a Trading RangeRichard Demille Wyckoff (1873–1934) was an early 20th-century pioneer in the technical approach to studying the stock market. He is considered one of the five “titans” of technical analysis, along with Dow, Gann, Elliott and Merrill.
Analyses of Trading Ranges
One objective of the Wyckoff method is to improve market timing when establishing a position in anticipation of a coming move where a favorable reward/risk ratio exists.
Trading ranges (TRs) are places where the previous trend (up or down) has been halted and there is relative equilibrium between supply and demand. Institutions and other large professional interests prepare for their next bull (or bear) campaign as they accumulate (or distribute) shares within the TR. In both accumulation and distribution TRs, the Composite Man is actively buying and selling - the difference being that, in accumulation, the shares purchased outnumber those sold while, in distribution, the opposite is true. The extent of accumulation or distribution determines the cause that unfolds in the subsequent move out of the TR.
PS—preliminary support , where substantial buying begins to provide pronounced support after a prolonged down-move. Volume increases and price spread widens, signaling that the down-move may be approaching its end.
SC—selling climax , the point at which widening spread and selling pressure usually climaxes and heavy or panicky selling by the public is being absorbed by larger professional interests at or near a bottom. Often price will close well off the low in a SC, reflecting the buying by these large interests.
AR—automatic rally , which occurs because intense selling pressure has greatly diminished. A wave of buying easily pushes prices up; this is further fueled by short covering. The high of this rally will help define the upper boundary of an accumulation TR.
ST—secondary test , in which price revisits the area of the SC to test the supply/demand balance at these levels. If a bottom is to be confirmed, volume and price spread should be significantly diminished as the market approaches support in the area of the SC. It is common to have multiple STs after a SC.
Note: Springs or shakeouts usually occur late within a TR and allow the coin or stock’s dominant players to make a definitive test of available supply before a markup campaign unfolds. A “spring” takes price below the low of the TR and then reverses to close within the TR; this action allows large interests to mislead the public about the future trend direction and to acquire additional shares at bargain prices. A terminal shakeout at the end of an accumulation TR is like a spring on steroids. Shakeouts may also occur once a price advance has started, with rapid downward movement intended to induce retail traders and investors in long positions to sell their shares to large operators. However, springs and terminal shakeouts are not required elements.
Test —Large operators always test the market for supply throughout a TR (e.g., STs and springs) and at key points during a price advance. If considerable supply emerges on a test, the market is often not ready to be marked up. A spring is often followed by one or more tests; a successful test (indicating that further price increases will follow) typically makes a higher low on lesser volume.
SOS—sign of strength , a price advance on increasing spread and relatively higher volume. Often a SOS takes place after a spring, validating the analyst’s interpretation of that prior action.
LPS—last point of support , the low point of a reaction or pullback after a SOS. Backing up to an LPS means a pullback to support that was formerly resistance, on diminished spread and volume. On some charts, there may be more than one LPS, despite the ostensibly singular precision of this term.
BU—“back-up” . This term is short-hand for a colorful metaphor coined by Robert Evans, one of the leading teachers of the Wyckoff method from the 1930s to the 1960s. Evans analogized the SOS to a “jump across the creek” of price resistance, and the “ back up to the creek ” represented both short-term profit-taking and a test for additional supply around the area of resistance. A back-up is a common structural element preceding a more substantial price mark-up, and can take on a variety of forms, including a simple pullback or a new TR at a higher level.
Wyckoffmethod

UAVS looking Saucy....I made a key code of the price action then found an exact match to this move in the past.... one that matched at lease 95% or better. That way if the move is that close to the same shape we have now it must mean the sentiment of the market was the same at that time. Therefore, the outcome should be the same coming out of the move. I then used PTP which is Past Trend Prediction by tracing the trend it made after this move in the past and projecting it forward on to the current move.
Then I took the same move on the Daily which is a different Time frame then the first..and found the same move with out a key and traced its path and projected it forward as well.
Sometimes I use about 5 other Price Action tricks I have have developed over the last 10 months or chart out the Curve and what Stage it is in. The Curve is my own brain child and I compare that to Wycoff method. Taking all of these into account You have several different approaches to confirming direction and intent of the institutional buyers and where Retail resides during this move.
If you would like to have more information or videos on Any of the ways I chart pls comment below. Like, follow, Subscribe...share.
Thank you,
iCantw84it
06.07.2021

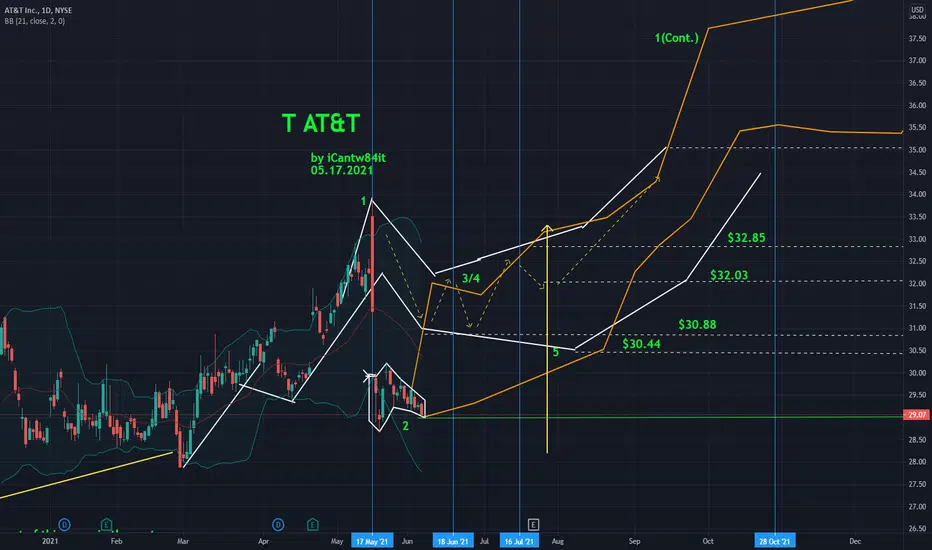
T AT&T I wasnt interested in, until it did this...I wanted to put a chart that you could track this with to go with the video.. SO here it is.
I made a key code of the price action then found an exact match to this move in the past.... one that matched at lease 95% or better. That way if the move is that close to the same shape we have now it must mean the sentiment of the market was the same at that time. Therefore, the outcome should be the same coming out of the move. I then used PTP which is Past Trend Prediction by tracing the trend it made after this move in the past and projecting it forward on to the current move.
Then I took the same move on the Daily which is a different Time frame then the first..and found the same move with out a key and traced its path and projected it forward as well.
Sometimes I use about 5 other Price Action tricks I have have developed over the last 10 months or chart out the Curve and what Stage it is in. The Curve is my own brain child and I compare that to Wycoff method. Taking all of these into account You have several different approaches to confirming direction and intent of the institutional buyers and where Retail resides during this move.
If you would like to have more information or videos on Any of the ways I chart pls comment below. Like, follow, Subscribe...share.
Thank you,
iCantw84it
06.07.2021
T AT&T I wasn't interested in...until it did this!I made a key code of the price action then found an exact match to this move in the past.... one that matched at lease 95% or better. That way if the move is that close to the same shape we have now it must mean the sentiment of the market was the same at that time. Therefore, the outcome should be the same coming out of the move. I then used PTP which is Past Trend Prediction by tracing the trend it made after this move in the past and projecting it forward on to the current move.
Then I took the same move on the Daily which is a different Time frame then the first..and found the same move with out a key and traced its path and projected it forward as well.
Sometimes I use about 5 other Price Action tricks I have have developed over the last 10 months or chart out the Curve and what Stage it is in. The Curve is my own brain child and I compare that to Wycoff method. Taking all of these into account You have several different approaches to confirming direction and intent of the institutional buyers and where Retail resides during this move.
If you would like to have more information or videos on Any of the ways I chart pls comment below. Like, follow, Subscribe...share.
Thank you,
iCantw84it
06.07.2021

AHT by Request PTP and KeyCode Basic Breakout to high Re-AccumI see a text book break out past a previous high that will go into consolidation and Re-accumulate to reabsorb the float then go for a new high again.
I made a key code of the price action then found an exact match to this move in the past.... one that matched at lease 95% or better. That way if the move is that close to the same shape we have now it must mean the sentiment of the market was the same at that time. Therefore, the outcome should be the same coming out of the move. I then used PTP which is Past Trend Prediction by tracing the trend it made after this move in the past and projecting it forward on to the current move.
Then I took the same move on the Daily which is a different Time frame then the first..and found the same move with out a key and traced its path and projected it forward as well.
Sometimes I use about 5 other Price Action tricks I have have developed over the last 10 months or chart out the Curve and what Stage it is in. The Curve is my own brain child and I compare that to Wycoff method. Taking all of these into account You have several different approaches to confirming direction and intent of the institutional buyers and where Retail resides during this move.
If you would like to have more information or videos on Any of the ways I chart pls comment below. Like, follow, Subscribe...share.
Thank you,
iCantw84it
06.07.2021


BTC to $30000KHey Team,
I have been monitoring BTC for sometime and reviewed the previous re-distribution on the early 2018 drop.
I am calling a low from here with a couple of key things noted on the chart.
* I have noted 3 rallies; just by visually observing you can see structural weakness. The last rally has been cumbersome on really bad volume.
* Look at the down swings; smooth and big spreads.
* No evidence of demand anywhere; for any move UP we need a dump for liquidity.
* End of rally 3 sees strength to the bears with a smooth long move downwards and poor recovery.
* Latest move of 34000 has a very low volume
Overall I think we see a drop lower. It could be a case where it is a ease of movement move and we drift lower as there is just no demand of significance in the market.

MGI KeyCode 45 min Path for MoneyGram to send you money's... I made a key code of the price action then found an exact match to this move in the past.... one that matched at lease 95% or better. That way if the move is that close to the same shape we have now it must mean the sentiment of the market was the same at that time. Therefore, the outcome should be the same coming out of the move. I then used PTP which is Past Trend Prediction by tracing the trend it made after this move in the past and projecting it forward on to the current move.
Then I took the same move on the Daily which is a different Time frame then the first..and found the same move with out a key and traced its path and projected it forward as well.
Sometimes I use about 5 other Price Action tricks I have have developed over the last 10 months or chart out the Curve and what Stage it is in. The Curve is my own brain child and I compare that to Wycoff method. Taking all of these into account You have several different approaches to confirming direction and intent of the institutional buyers and where Retail resides during this move.
If you would like to have more information or videos on Any of the ways I chart pls comment below. Like, follow, Subscribe...share.
Thank you,
iCantw84it


RKT looking like its ready for lift off at this spot..T-minus 5 before this takes off, but does it have rocket boosters or just rocket thrust.....I have two paths here that could be possible.
I left the unique pattern it was making as keys to where the same moved happened in the past and carried their trendlines forward.

AIKI by request Key Code PTP 45 min chart will show price action best on the yellow... White in the Daily. Hope this helps.
by iCantw84it
06.03.2021


PYPL so I made a key code for this and guess what I found.A whole herd of Giraffes about to do a bull run.
by iCantw84it
06.03.2021

I made a key code of current price action,& this is what I foundSo amongst all the other weird things I see in the market everyday I would like to add this one. I found it amusing. What if you could make a key code of current price action to determine when to get in, by basing it off past price action that fit insdie the key code you just made? See as instituionals are trading a stock, 100s or even 1000s of algos are running simultaneously creating a unique pattern in the price action. It repeats itself over and over until one of the major ones leave the stock or change their algo. That said finding an easy way to find these moves and what happens next is the next step. if it repeats itself more than once....it stands the chance of repeating itself again.....
So there lies the basis of my whole trading strategy, cross hatch that with wycoff method and the Curve plus about 5 other weird things I have seen in the market that holds true still to this day and you have what i do on a daily basis.
is it right or wrong I personally don't care. As it works for me and I make a living off it. Will it work for you, idk.... I have acquired savant syndrome, what looks plain as day to me might look greek someone else. Idk.
That said I enjoy doing these so even if you can't see what I see, you will have a constant flow of these always to look at.
by iCantw84it
06.02.2021
pls like/ subscribe / share/ comment below / request a breakdown of a stock... as its the only way I can gauge if you want more of these or not.

BNB weekly forecastslowly making its way to mitigate daily supply zone, high probability trade can be taken at ~306-336 - buy and hodl

ADA weekly forecastApproaching daily supply zone, unless price break through 2.1, we still remain bearish bias

GOLD SHORTVery Bearish move following at sign of weaknes on 1/6/2021. expect price go up slowly to 1895

BITCOIN 😲 Wyckoff Accumulation 👍 Still in ProgressFinally, Bitcoin flips the 1H 200 EMA to support. A few bullish volume spikes show clues that retail traders may be flipping bullish. Just need more volume now.
✅1) Need to flip that 1H - 200 EMA to Support
🟡2) Volume should start increasing as retail traders take positions.
🟥3) Price needs to get to the $23,000 Resistance Line
🟥4) Reversal is only confirmed with a huge Volume Spike at Sign of Strength... 🔥🚀

Gold - Wyckoff DistributionIdea for Gold (XAUUSD):
- This is a Wyckoff Distribution Forecast of Gold.
Wyckoff Definitions:
BC - Buying Climax
SOW - Sign of Weakness
UT - Upthrust
LPSY - Last Point Of Supply
Wyckoff Phases:
Phase A - Stopping of prior uptrend
Phase B - Building a cause for preparation for a new downtrend
Phase C - Test of remaining demand
Phase D - Supply showing dominance
Phase E - Unfolding of the downtrend
GLHF
- DPT


Crude Oil Headed Towards $70 p/bThe price of crude consolidated above $68.00 following yesterday's OPEC conference, which underpinned growing demand driven by robust global recovery.
The price is currently trading at its highest level in over a year (since before the coronavirus crash), which could cause volatile fluctuations nears this historic resistance.
Traders looking to join the rally need to utilise trend continuation strategies under the Wyckoff Cycle method.

RIO looks like a dream vacation waiting for you to disembark!RIO @jljpsp this was by request and part of a group of well found stocks. Thank you.
by iCantw84it
06.01.2021
