Bullish on EURUSDMonday opened with a massive bearish gap on Asian session after Trump's tariff saga.
Entry 1.02
TP1 1.03
TP2 1.05
Forex market

GBP/JPY long Currently approached a strong support and there is still a massive fvg gap to be filled so I am looking for long until the gap is closed.
Entry 190.7
Sl 190.5
TP 192

Trading Both Ways on the Same DayMark your 5 minute level and 15 minute level. Then SELL with a 12-pip SL and a 24-pip TP. Do the same a BUY.

Euro/USD model 1 distributionPotential wyckoff model 1. I'm waiting for another deviation of the high and a tap in the supply zone from december 18. I would enter a short with a BOS.

GBPUSD is still bullish, the tariffs didn't make it bearishThe chart is quite clean. We will cover this gap this week and probably close above it. Trump just gave you opportunity to buy in discount.
Dont let the fear mongers make you miss out on this trade.

EURUSD / SHORT / 30.01.25⬇️ SELL EUR/USD 30.01.25
💰 Entry: $1.04294
🎯 Goal: $1.02664
⛔️ Stop: $1.04678
Entry reasons:
— Week maximum.
Monday. PMI. Capture liquidity PDH.
— Price is consolidated below weekly open.
— Full inverted bearish daily imbalance and made daily bearish imbalance.
— Daily bearish imbalance has tested.
Goal is previous weekly low: $1.02664
Strategy: #osok
Entry: #daily-range

CHF/JPY BULLISH BIAS RIGHT NOW| LONG
Hello, Friends!
The BB lower band is nearby so CHF/JPY is in the oversold territory. Thus, despite the downtrend on the 1W timeframe I think that we will see a bullish reaction from the support line below and a move up towards the target at around 169.720.
✅LIKE AND COMMENT MY IDEAS✅

EURUSD H4 Technical Observations | FOREX BEE Looking at the EUR/USD H4 chart, here are some key observations:
Fibonacci Levels:
The 0.618 Fibonacci level near 1.0456 appears to be a potential bullish target if price rallies from current levels.
Key Support Zone:
The green support zone around 1.0200-1.0230 looks significant, where buyers may defend the area. A bounce from here could trigger upward momentum.
Trendline Dynamics:
The blue descending trendline may continue to act as resistance if the price moves upward, aligning with the 0.786 Fibonacci level near 1.0531.
Potential Scenarios:
Bullish Case: If the price sustains above the current support, it may target 1.0450 and higher levels.
Bearish Case: A break below the red zone near 1.0200 could indicate further bearish pressure toward 1.0100 or lower.
This setup highlights an interesting reversal or breakdown possibility. Watch for confirmation of support/resistance levels before entering trades.

USDJPY IN SHORT TREND AT 155.53USDJPY Forecast & Level Analysis
USDJPY has tested its resistance zone and formed a strong bearish candle, indicating a potential further decline. The technical target for this pair is 151.00.
Resistance Levels:
156.00 (First Resistance)
157.60 (Second Resistance)
Support Zones:
154.60 (First Support)
153.00 (Second Support)

USDJPY HEAVY SELL OFFFor INTRADAY follow Pivots Strategy.
For LONG TERM sell as from 155.000, Follow me if you find my analysis very interesting, like and always drop your comments, thanks.

USDJPY Analysis February 3USDJPY pullback is approaching the support zone of 154.600. We can set a BUY signal at this price zone. Buyers are waiting in this zone very large. 155.300 becomes a strong resistance zone which is also the TP zone of this BUY signal.

EURUSD 3 Feb 2025 W6 - Intraday Analysis - Taste of Trade WAR!This is my Intraday analysis on EURUSD for 3 Feb 2025 W6 based on Smart Money Concept (SMC) which includes the following:
Market Sentiment
4H Chart Analysis
15m Chart Analysis
Market Sentiment
" Strike the bound, and the free will take heed "
Market Volatility and Geopolitical Strategy: Assessing the Implications of a Trump Presidency
Recent market movements underscore a critical narrative: A second Trump administration carries significant potential to reignite the trade policy volatility that defined his first term. Historical precedent offers a clear lens—within weeks of taking office in 2017, President Trump implemented tariffs on imports from Canada, Mexico, and China, upending decades of trade consensus. Investors initially dismissed these measures as negotiation tactics, but markets are now pricing in a more structural shift. As of this week’s open, risk-on sentiment reflects renewed acceptance of Trump’s uncompromising stance, particularly following his social media assertion that “the pain from tariffs will be worth the price.”
A Businessman’s Approach to Geopolitics
Trump’s career as a dealmaker suggests a presidency anchored in transactional realism. His administration’s “America First” doctrine—evident in the rapid escalation of the U.S.-China trade war—demonstrates a willingness to weaponize economic policy to recalibrate global alliances. This strategy aligns with a proverb often cited in Egyptian diplomacy: “Strike the bound, and the free will take heed.” By aggressively targeting key partners (the “bound”), the U.S. signals resolve to broader adversaries (the “free”), including Europe and emerging economies.
Strategic Outlook for Investors
With 205 weeks remaining in a hypothetical term, market participants should prepare for sustained turbulence. The 2018-2019 trade war eroded nearly $1.7 trillion in global equity value; a second iteration could prove more disruptive given today’s fragmented supply chains and inflationary pressures.
In conclusion, while Trump’s policies may inject short-term uncertainty, they also recalibrate the playbook for global engagement. Investors who disentangle rhetoric from actionable strategy will be best positioned to navigate this paradigm.
4H Chart Analysis
1️⃣
🔹Swing Bullish
🔹INT Bearish
🔹At Swing Extreme
🔹Swing Pullback
2️⃣
🔹With Risk-On sentiment, market opened with a gap down reaching the extreme Swing Low.
🔹The expected move is done with the market open. More development is required on LTFs.
3️⃣
🔹Expectations is to continue bearish as long the Risk-On sentiment is still active and no soft tone from Trump in regards to Tariffs.
15m Chart Analysis
1️⃣
🔹Swing Bearish
🔹INT Bearish
🔹Swing Pullback
2️⃣
🔹Swing turned bearish signaling the 4H/Daily bearish continuation.
🔹After a BOS we expect a Pullback, but currently the Risk-On sentiment is the main theme (Technical will follow sentiment) so not currently expecting a valuable pullback phase for the bearish BOS.
3️⃣
🔹Expectations is set for price to continue bearish and fulfill the Daily Bearish continuation.

EURUSD analysis The markets are hit with a big tariff today.price dropped and rejected a big demand zone nicely.entries just because it's a major demand zone but with good money management.tp at a small supply zone

USDJPY SELL!!!!UJ sentimental is bearish today, and early morning it just grabbed liquidity of the Asian session. Now, let take a short position
We first aim for 1:1 the 1:2 after securing some profits

USDCAD, Is 1.47 available ?Hello Traders, Happy new year in advance, I Hope you have a great year ahead with your family.
let's go for USDCAD analysis:
for upcoming weeks, we'll probably see a downward correction to Specified level at first and then it will start another Rally. so with a proper trigger we can open a short position at first and after that a long position with TP around 1.4700.
And finally tell me what do you think ? UP or DOWN ? leave your comment below this post.
If this post was helpful to you, please like it and share it with your friend.
THANKS.

AUD/JPY "Aussie vs Japanese" Forex Market Heist Plan on Bullish🌟Hi! Hola! Ola! Bonjour! Hallo!🌟
Dear Money Makers & Robbers, 🤑 💰
Based on 🔥Thief Trading style technical and fundamental analysis🔥, here is our master plan to heist the AUD/JPY "Aussie vs Japanese" Forex market. Please adhere to the strategy I've outlined in the chart, which emphasizes long entry. Our aim is the high-risk Red Zone. Risky level, overbought market, consolidation, trend reversal, trap at the level where traders and bearish robbers are stronger. Be wealthy and safe trade.💪🏆🎉
Entry 📈 : Traders & Thieves with New Entry A bull trade can be initiated on the MA level breakout of 98.400
However I advise placing Buy limit orders within a 15 or 30 minute timeframe. Entry from the most recent or closest low or high level should be in retest.
Stop Loss 🛑: Using the 4H period, the recent / nearest low or high level.
Goal 🎯: 101.300 (or) Escape Before the Target
Scalpers, take note 👀 : only scalp on the Long side. If you have a lot of money, you can go straight away; if not, you can join swing traders and carry out the robbery plan. Use trailing SL to safeguard your money 💰.
Fundamental Outlook 📰🗞️
AUD/JPY is a popular currency pair that can be influenced by various fundamental and macroeconomic factors. Here's a brief analysis to help you make an informed decision:
Fundamental Analysis---
Interest Rate Differential: The Reserve Bank of Australia (RBA) has been keeping interest rates relatively high compared to the Bank of Japan (BOJ). This difference can make the AUD more attractive to investors, potentially driving up the value of AUD/JPY.
Commodity Prices: Australia is a major exporter of commodities like iron ore, coal, and gold. An increase in commodity prices can boost the Australian economy and support the AUD.
Economic Growth: Australia's economy has been showing signs of resilience, with a growing services sector and a rebound in consumer spending. Japan's economy, on the other hand, has been facing challenges, including a declining population and low inflation.
Macroeconomic Analysis---
Global Risk Sentiment: AUD/JPY is often considered a risk-on/risk-off pair. When investors are risk-averse, they tend to sell AUD and buy JPY, causing the pair to decline. Conversely, when risk appetite increases, AUD/JPY tends to rise.
Yield Curve: The yield curve in Australia has been relatively steep compared to Japan, which can attract investors seeking higher returns.
Central Bank Policies: The RBA has been maintaining a hawkish stance, while the BOJ has been keeping its ultra-loose monetary policy. This contrast can influence the AUD/JPY exchange rate.
Technical Analysis---
The AUD/JPY chart is showing a bullish trend, with the pair trading above its 200-day moving average. The Relative Strength Index (RSI) is around 60, indicating a moderate bullish momentum.
Conclusion---
Based on the fundamental and macroeconomic analysis, it seems that AUD/JPY might continue its bullish trend. However, it's essential to keep an eye on global risk sentiment, commodity prices, and central bank policies, as these factors can influence the pair's direction.
Trading Alert⚠️ : News Releases and Position Management 📰 🗞️ 🚫🚏
As a reminder, news releases can have a significant impact on market prices and volatility. To minimize potential losses and protect your running positions,
we recommend the following:
Avoid taking new trades during news releases
Use trailing stop-loss orders to protect your running positions and lock in profits
Please note that this is a general analysis and not personalized investment advice. It's essential to consider your own risk tolerance and market analysis before making any investment decisions.
Keep in mind that these factors can change rapidly, and it's essential to stay up-to-date with market developments and adjust your analysis accordingly.
💖Supporting our robbery plan will enable us to effortlessly make and steal money 💰💵 Tell your friends, Colleagues and family to follow, like, and share. Boost the strength of our robbery team. Every day in this market make money with ease by using the Thief Trading Style.🏆💪🤝❤️🎉🚀
I'll see you soon with another heist plan, so stay tuned 🫂

AUDUSD, What will hapen in upcoming weeks ?Hello Traders, Happy new year in advance, I Hope you have a great year ahead with your family.
let's go for AUDUSD analysis:
for upcoming weeks, we'll probably see an upward correction to Specified level at first and then it will start another fall. so with a proper trigger we can open a short position.
And finally tell me what do you think ? UP or DOWN ? leave your comment below this post.
If this post was helpful to you, please like it and share it with your friend.
THANKS.

NZD/USD, Long, 2h✅ NZD/USD is forming a clear falling wedge pattern, signaling a potential bullish breakout. The price is expected to move higher toward the next resistance level.
LONG 🚀
✅ Like and subscribe to never miss a new analysis! ✅

GBPJPY BUY!!!!GJ sentimental is bullish today, and early morning, it price dropped from 192.24 to 190.91 and let a big gap which has to be filled Now, let's take a long position
We first aim for 1:1 the 1:2 after securing some profits

Possibility of correction The price is expected to fluctuate within the current range. If the price can cross the 100% level, it will be possible to continue the upward trend up to the 138% level.
IDEA USDJPY LONG POSITION Hi Traders
Pair: USDJPY
📈 Position: LONG (BUY )
✅ Entry: 153.800
🔺 SL: 153.400
🎯 Take Profits:
• TP 1: 154.2
• TP 2: 154.6
• TP 3: 154.0 (Trailing SL)

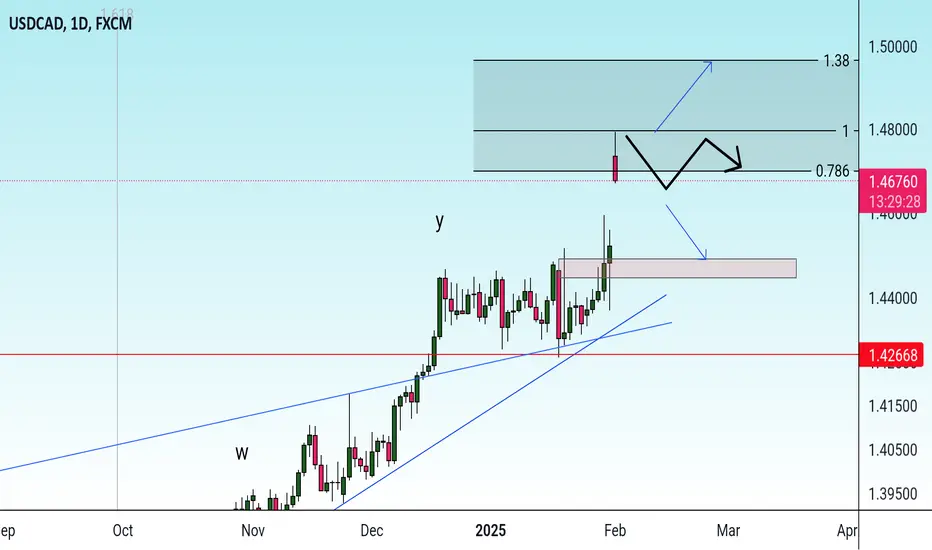
Trump’s Tariffs Push USD/CAD to a 22-Year HighTrump’s Tariffs Push USD/CAD to a 22-Year High
As promised during his election campaign, US President Donald Trump introduced tariffs just two weeks after his inauguration:
→ 25% on goods from Canada and Mexico, prompting both countries to vow retaliatory measures.
→ 10% on Chinese goods, with China announcing plans to challenge the decision at the World Trade Organization.
The tariffs will take effect on 4 February. Trump acknowledged potential economic pain but justified the measures as necessary to combat illegal immigration and drug trafficking, arguing that the long-term benefits would outweigh the costs.
Trump’s decision:
→ Led to a decline in US stock indices, as analysts fear a potential trade war and global stagflation (sluggish economic growth amid high inflation). Further tariffs on Europe may follow.
→ Strengthened the US dollar, which gained around 1% against major currencies.
According to the USD/CAD chart, the Canadian dollar is trading around 1.4700 against the US dollar—a level last seen in early 2003.
On 30 January, our USD/CAD technical analysis highlighted the significance of a key trendline supporting the uptrend since last autumn. Now, by drawing a parallel line through December’s peak (A), we can identify a resistance level where the pair is currently stabilising.
A large bullish gap has also formed on the chart. The lower boundary around 1.4600 may act as technical support in the short term, though broader price movements will likely be driven by fundamental factors.
Trade on TradingView with FXOpen. Consider opening an account and access over 700 markets with tight spreads from 0.0 pips and low commissions from $1.50 per lot.
This article represents the opinion of the Companies operating under the FXOpen brand only. It is not to be construed as an offer, solicitation, or recommendation with respect to products and services provided by the Companies operating under the FXOpen brand, nor is it to be considered financial advice.

Market Analysis: EUR/GBP Falls Into The RedMarket Analysis: EUR/GBP Falls Into The Red
EUR/GBP is declining and trading below the 0.8400 support level.
Important Takeaways for EUR/GBP Analysis Today
- EUR/GBP is declining and showing bearish signs below 0.8400.
- There is a key bearish trend line forming with resistance at 0.8370 on the hourly chart at FXOpen.
EUR/GBP Technical Analysis
On the hourly chart of EUR/GBP at FXOpen, the pair struggled to gain pace for a move above 0.8420. The Euro settled below 0.8400 and started a fresh decline against the British Pound.
There was a clear move below the 0.8350 pivot level. The EUR/GBP chart suggests that the pair settled below the 50-hour simple moving average and 0.8340. A low is formed near 0.8307 and the pair is now consolidating losses.
Immediate resistance is near the 50% Fib retracement level of the downward move from the 0.8389 swing high to the 0.8307 low at 0.8350.
The next major resistance could be near the 50-hour simple moving average and the 61.8% Fib retracement level of the downward move from the 0.8389 swing high to the 0.8307 low at 0.8370. There is also a key bearish trend line forming with resistance at 0.8370.
A close above the 0.8370 level might accelerate gains. In the stated case, the bulls may perhaps aim for a test of 0.8420. Any more gains might send the pair toward the 0.8450 level.
Immediate support sits near 0.8325. The next major support is near 0.8305. A downside break below the 0.8305 support might call for more downsides. In the stated case, the pair could drop toward the 0.8265 support level.
Trade on TradingView with FXOpen. Consider opening an account and access over 700 markets with tight spreads from 0.0 pips and low commissions from $1.50 per lot.
This article represents the opinion of the Companies operating under the FXOpen brand only. It is not to be construed as an offer, solicitation, or recommendation with respect to products and services provided by the Companies operating under the FXOpen brand, nor is it to be considered financial advice.
