GBPUSDThis MG seems to be ready for that buy a break to upside I am taking that buy.
VHT YOUR MENTOR SIGNING OUT
Forex market

AUD-NZD Resistance Ahead! Sell!
Hello,Traders!
AUD-NZD is going up now
And will soon hit a horizontal
Resistance of 1.1100 from
Where we will be expecting
A local bearish pullback
Sell!
Comment and subscribe to help us grow!
Check out other forecasts below too!


EURCAD REVERSALTechnically:
EURCAD printing double top
EURCAD printing bearish divergence
EURCAD break double top neckline when it retrace again we take entry
Fundamentally:
According COT data
EXY is bearish
CXY is bullish

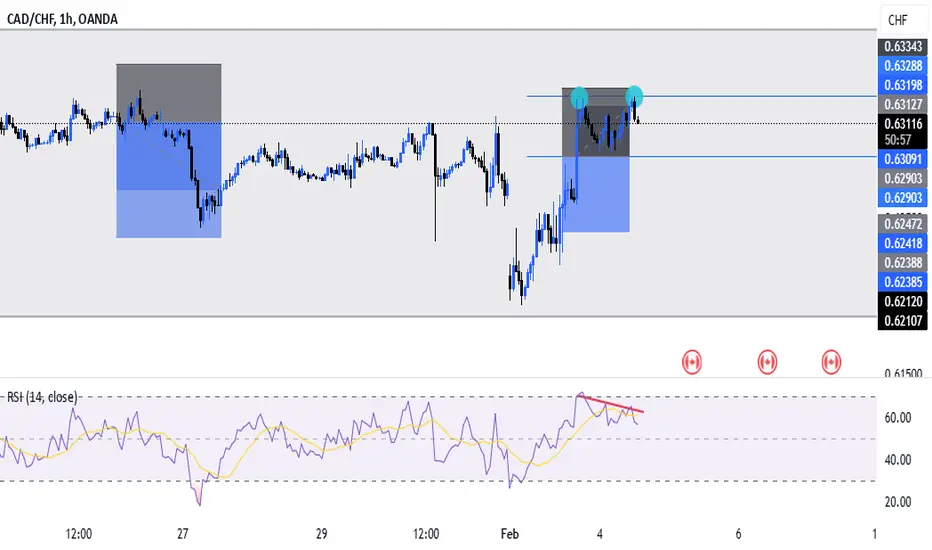
CADCHF SHORT TERM REVERSALTechnically:
CADCHF printing double top.
CADCHF printing bullish divergence.
USD/CAD remains on the backfoot after tariffs delayThe USD/CAD has extended its drop after reversing sharply the day before on the back of Trump's U-turn on imposing tariffs on Canada, delaying it for at least a month. Today's weaker US JOLTS job openings data has further pressured the US dollar.
The FX pair had initially surged on Monday, breaking above both the March 2020 high of 1.4668 and January’s peak of 1.4690, reaching a session high of 1.4793 before swiftly reversing as news emerged of tariff delays. The resulting price action formed a long-legged inverted hammer candle—typically seen at major swing highs.
For the bears, a decisive move lower would now be needed to confirm that at least a near-term top has been established.
Crucially, the USD/CAD has breached the key 1.4400 pivotal zone, where prior support converges with the 21-day exponential moving average and a rising trendline. A daily close well below this level could open the door to fresh technical selling, potentially driving the pair below the recent low of 1.4261 in the days ahead, if not even lower.
On the upside, immediate resistance now comes in around the 1.4370-1.4400 area, with a more significant zone sitting around 1.4500, which was tested earlier in the session and has held—for now. Beyond that, the next key resistance area lies between the 2020 and 2016 highs, within the 1.4668-1.4690 range, making it a critical zone to watch.
By Fawad Razaqzada, market analyst with FOREX.com

''EUR/USD 4H | Elliott Wave Playbook"
The pair appears to be carving out a textbook 5-wave Elliott structure. Here’s the breakdown:
- **Wave 1, 2, and 3** are in the books, and Wave 4 is now developing, testing the **38.2%-50% retracement zone** (highlighted in orange).
- **Wave 5 Target**: Eyeing **1.0100-1.0090** as the likely destination for the final push lower.
**Trade Plan:**
- Monitoring the sell zone at **1.0373-1.0466**, which aligns with the Wave 4 retracement.
- Any rejection here provides a short setup, with stops above **1.0466** and targets down to **1.0100**.
- R:R is solid, making this a high-probability play for the disciplined trader.
**Market Context:**
- Structural resistance and Fibonacci confluence strengthen the case for shorts.
- Patience is key—waiting for confirmation of Wave 4 completion before entry is paramount.
**Reminder:** This is an analytical outlook, not financial advice. Manage risk diligently.
---
Would this work for your audience, or shall I refine it further?

GBPNZD LONGGN formed a bullish flag with price respecting the support zone..trade safe and be blessed

Potential Incoming BullsAs we see a complete impulse to the upside with a pullback followup. This tells us that, the market if finalising the small small details ready to touch the sky for Wave 3. All eyes at 61.8% & 78.6 Fib for an entry.

GBPUSD - Pull Back As for EUR we can have a pull back with target to 1.29
Trigger is break of top
Volatility can be increase .. attention

gbpusd buy tradeThe Relative Strength Index (RSI) is showing an upward trend, indicating increasing momentum. Additionally, the Moving Average Convergence Divergence (MACD) is showing a bullish crossover, further supporting the potential for an upward move.

EURUSD is with the bulls at the moment.
I bought in Long as I could see it turning about 60 hours ago even despite a rallying USD as it looked overextended.
This daily chart is strong and all its timeframes are similar. The only little hurdle is some resistance it is just below.
But I think it will blow through some smoke and mirrors and shoot higher.

nzdjpy buy tradeThe Relative Strength Index (RSI) is showing an upward trend, indicating increasing momentum. Additionally, the Moving Average Convergence Divergence (MACD) is showing a bullish crossover, further supporting the potential for an upward move.

usdzar sell tradeThe Relative Strength Index (RSI) is showing a downward trend, indicating weakening momentum. Additionally, the Moving Average Convergence Divergence (MACD) is showing a bearish crossover, further supporting the potential for a downward move

EURNOK: Buy Setup at Key Support ZoneOANDA:EURNOK is currently testing a significant demand zone. Previously, this area has acted as strong support, leading to bullish reactions. The recent decline into this zone suggests a potential for buyers to step in and drive prices higher.
A bullish confirmation, such as a strong rejection pattern, bullish engulfing candles, or long lower wicks, would increase the probability of a rebound. If buyers regain control, the price could move toward 11.7300 level.
This is not financial advice but rather how I approach support/resistance zones. Remember, always wait for confirmation, like a rejection candle or volume spike before jumping in.
Please boost this post, every like and comment drives me to bring you more ideas! I’d love to hear your perspective in the comments.
Best of luck , TrendDiva


USDCHF BEARISH FOR 100PIPSA forecast for a 100-pip bearish move on USD/CHF suggests you’re expecting the price to decline significantly in the near term. If you're looking to forecast this move, a few key factors to consider might include:
Technical Analysis: Are there any key levels of support or resistance you’re watching? For instance, if USD/CHF is approaching a strong resistance zone, a pullback or bearish move could be likely.
Moving Averages: Are the shorter-term moving averages crossing below the longer-term ones? This could signal a bearish trend.
Trendlines: Is there a trendline or channel that price has recently broken, suggesting further downward movement?
Economic Data: Any upcoming data or news releases that could impact USD or CHF? For example, economic reports, interest rate decisions, or geopolitical events.
RSI or MACD: Is the RSI overbought, indicating a potential reversal? Or is the MACD showing bearish momentum?

EURUSD - Bullish RunPotential bullish run. I have already entered of a structure on the 15 minute time frame yesterday after price touched 61.8%. I moved stop loss to break even as I am in significant profit to hold position through NFP for potential upside based on technical analysis.
My fib is reverse because I don't like pulling out the extension every time however 38.2 is the 61.8
This trade is based off the weekly/daily time frame with an entry on the 15 minute time frame.
I expect price to incrementally push up to 1.06

NZDJPYNZDJPY is in bullish trend.
Potentially printing HH and hL
No sign of reversal here.
strong sign of trend continuation .
Alligator also indicates here trend will go up .
we buy at CMP.

EURUSDEURUSD is in strong bullish trend.
Potentially printing HH and HL.
No sign of reversal here.
Aligator also indicates trend will go further upward.
we buy at CMP.

Timing is important, but hey 1R is 1RJust to show that all your trades don't exactly pan out the way you want/think, here's an example if your timimg is off what can happen, but hey whatever it's just 1R
Next!

GBPCHFGBPCHF is in strong bearish trend.
Potentially printing LH and LL.
NO sign of reversal.
Aligator face is open which also help us to determine trend will go further downward.
we sell at CMP.
