Long EURGBP if price comes to 0.864Price should continue its bullishness if a new 3 day high is made
Forex market

Cable H4 | Pullback at 61.8% Fibonacci retracementCable (GBP/USD) is falling towards a pullback support and could potentially bounce off this level to climb higher.
Buy entry is at 1.3533 which is a pullback support that aligns with the 61.8% Fibonacci retracement.
Stop loss is at 1.3490 which is a level that lies underneath a pullback support.
Take profit is at 1.3612 which is a swing-high resistance that aligns closely with the 38.2% Fibonacci retracement.
High Risk Investment Warning
Trading Forex/CFDs on margin carries a high level of risk and may not be suitable for all investors. Leverage can work against you.
Stratos Markets Limited (tradu.com ):
CFDs are complex instruments and come with a high risk of losing money rapidly due to leverage. 63% of retail investor accounts lose money when trading CFDs with this provider. You should consider whether you understand how CFDs work and whether you can afford to take the high risk of losing your money.
Stratos Europe Ltd (tradu.com ):
CFDs are complex instruments and come with a high risk of losing money rapidly due to leverage. 63% of retail investor accounts lose money when trading CFDs with this provider. You should consider whether you understand how CFDs work and whether you can afford to take the high risk of losing your money.
Stratos Global LLC (tradu.com ):
Losses can exceed deposits.
Please be advised that the information presented on TradingView is provided to Tradu (‘Company’, ‘we’) by a third-party provider (‘TFA Global Pte Ltd’). Please be reminded that you are solely responsible for the trading decisions on your account. There is a very high degree of risk involved in trading. Any information and/or content is intended entirely for research, educational and informational purposes only and does not constitute investment or consultation advice or investment strategy. The information is not tailored to the investment needs of any specific person and therefore does not involve a consideration of any of the investment objectives, financial situation or needs of any viewer that may receive it. Kindly also note that past performance is not a reliable indicator of future results. Actual results may differ materially from those anticipated in forward-looking or past performance statements. We assume no liability as to the accuracy or completeness of any of the information and/or content provided herein and the Company cannot be held responsible for any omission, mistake nor for any loss or damage including without limitation to any loss of profit which may arise from reliance on any information supplied by TFA Global Pte Ltd.
The speaker(s) is neither an employee, agent nor representative of Tradu and is therefore acting independently. The opinions given are their own, constitute general market commentary, and do not constitute the opinion or advice of Tradu or any form of personal or investment advice. Tradu neither endorses nor guarantees offerings of third-party speakers, nor is Tradu responsible for the content, veracity or opinions of third-party speakers, presenters or participants.

EURGBP SHORT DAILY FORECAST Q3 D11 W28 Y25EURGBP SHORT DAILY FORECAST Q3 D11 W28 Y25
It’s Fun Coupon Friday! 💸🔥
Professional Risk Managers👋
Welcome back to another FRGNT chart update📈
Diving into some Forex setups using predominantly higher time frame order blocks alongside confirmation breaks of structure.
Let’s see what price action is telling us today! 👀
💡Here are some trade confluences📝
✅Daily Order block identified
✅4H Order Block identified
✅1H Order Block identified
🔑 Remember, to participate in trading comes always with a degree of risk, therefore as professional risk managers it remains vital that we stick to our risk management plan as well as our trading strategies.
📈The rest, we leave to the balance of probabilities.
💡Fail to plan. Plan to fail.
🏆It has always been that simple.
❤️Good luck with your trading journey, I shall see you at the very top.
🎯Trade consistent, FRGNT X

Fundamental Market Analysis for July 11, 2025 USDJPYThe dollar is holding steady at 146.500 against the yen: another rise in US yields and stable demand for safe US assets following comments from the Fed are fueling appetite for the USD, while demand for the JPY remains sluggish.
The tariff front exacerbates the imbalance: the White House has already imposed 25% tariffs on Japanese goods, and new ideas for “umbrella” tariffs are heightening fears of a trade war, forcing investors to flow into financing currencies. Reuters notes that the yen weakened to 146.400, recording a weekly decline of more than 1%.
At the same time, the Bank of Japan is not yet ready for aggressive tightening: a decline in inflation to 1.8% y/y and weak real wage dynamics make it difficult to raise rates above 0.5%. The divergence in monetary policy and expectations for Japanese macro data (machine tool orders, industrial production) until July 14 form the fundamental basis for the pair's growth to 147.500 and above, while the risks of correction are limited to the 145.900 zone.
Trading recommendation: BUY 146.500, SL 145.900, TP 147.500

AUDUSD – The Spring Is Loading!AUDUSD has just pulled off an impressive rebound from the 0.6460 support zone, bouncing cleanly off the ascending trendline — like a compressed spring ready to launch. The repeated appearance of Fair Value Gaps after recent upward moves reveals a critical clue: smart money is stepping back in, and this time, they want control.
The price is now testing the familiar resistance at 0.6616 — a zone that has previously rejected several bullish attempts. But this time feels different. The US dollar is clearly losing steam after softer CPI data, pushing bond yields lower and giving AUD a tactical edge.
If the 0.6520 support holds strong, the next breakout won’t just be about overcoming resistance — it could be the spark for a new bullish wave. And when that wave hits... it won’t go unnoticed.

GBPJPY – Correction Pressure Is Building UpGBPJPY is still trading within a well-defined ascending channel on the H4 chart. However, recent signals suggest a potential short-term correction. The price has repeatedly rejected the upper boundary of the channel and is now forming a distribution pattern with lower highs. The FVG zone near 200.400 may act as a short-term take-profit area before price pulls back toward the support zone around 198.400, which also aligns with the lower trendline.
Additionally, the upcoming UK GDP data this week could strongly impact GBP. If the data comes in weaker than expected, downside pressure may intensify and reinforce the developing correction scenario. Traders should monitor price action around 198.400 for confirmation of the pullback.

XABCD Double Top
Hello traders! I hope you’ve had a productive trading week.
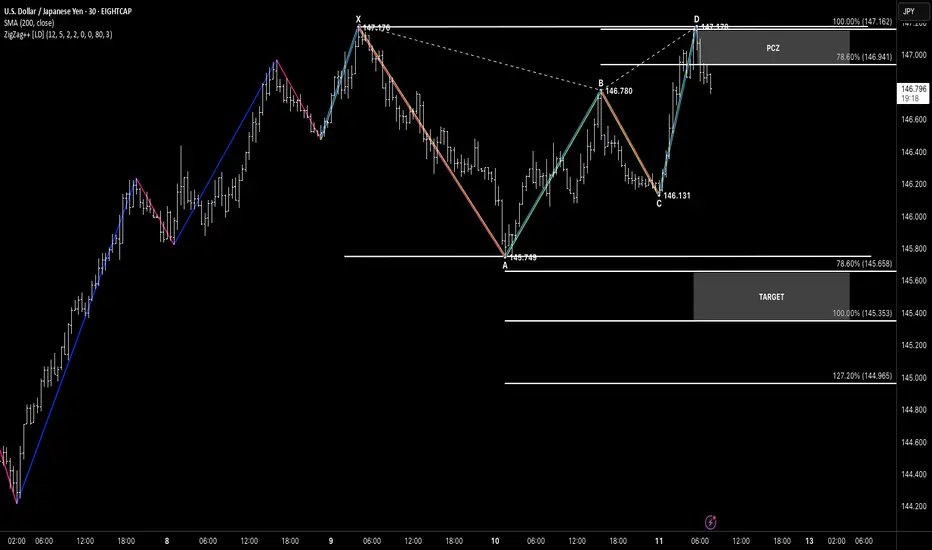
Let’s take a look at USDJPY, where we’re wrapping up the week with a textbook XABCD Double Top formation.
📍 Structure Overview
Price action completed an extended XABCD formation, with D printing a perfect double top around the 147.17 level.
The move from C to D aligns closely with the prior XA leg, showing strong symmetry in price.
D terminates precisely within the PCZ (Potential Completion Zone), aligning with both 78.6% and 100% extensions.
🎯 Bearish Targets Below
If this Double Top confirms with bearish follow-through, the structure offers a clean setup with downside targets:
Target 1: 145.35 (100%)
Target 2: 144.96 (127.2%)
A break below point C (146.13) would further validate the bearish thesis.
🧠 Pattern Highlights
XABCD geometry
Strong price symmetry
Completion into previous high (resistance)
Clear target zone for risk-defined trades
EURJPY SHORT DAILY FORECAST Q3 D11 W28 Y25EURJPY SHORT DAILY FORECAST Q3 D11 W28 Y25
It’s Fun Coupon Friday! 💸🔥
Professional Risk Managers👋
Welcome back to another FRGNT chart update📈
Diving into some Forex setups using predominantly higher time frame order blocks alongside confirmation breaks of structure.
Let’s see what price action is telling us today! 👀
💡Here are some trade confluences📝
✅Daily Order block identified
✅4H Order Block identified
✅1H Order Block identified
🔑 Remember, to participate in trading comes always with a degree of risk, therefore as professional risk managers it remains vital that we stick to our risk management plan as well as our trading strategies.
📈The rest, we leave to the balance of probabilities.
💡Fail to plan. Plan to fail.
🏆It has always been that simple.
❤️Good luck with your trading journey, I shall see you at the very top.
🎯Trade consistent, FRGNT X

EUR NZD SHORT RESULT Price had already rejected one from the resistance Trendline and order block so I expected it to retest it and dump, unfortunately it pumped and uptrended hitting our sl.
Better Set-ups to come 🔥💪
_THE_KLASSIC_TRADER_.

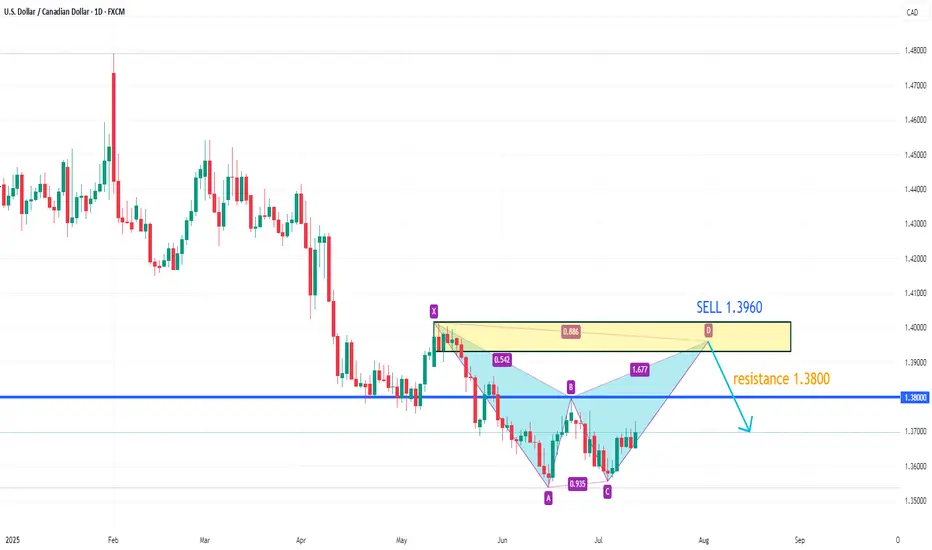
USDCAD upside target 1.3960On the 4-hour chart, USDCAD stabilized and moved upward, with bulls taking the upper hand. The current market has formed a potential double bottom pattern. In the short term, attention can be paid to the resistance near 1.380. A breakthrough will hopefully continue to move higher, with the upward target around 1.3960. When the price reaches 1.3960, attention can be paid to the bearish bat pattern.
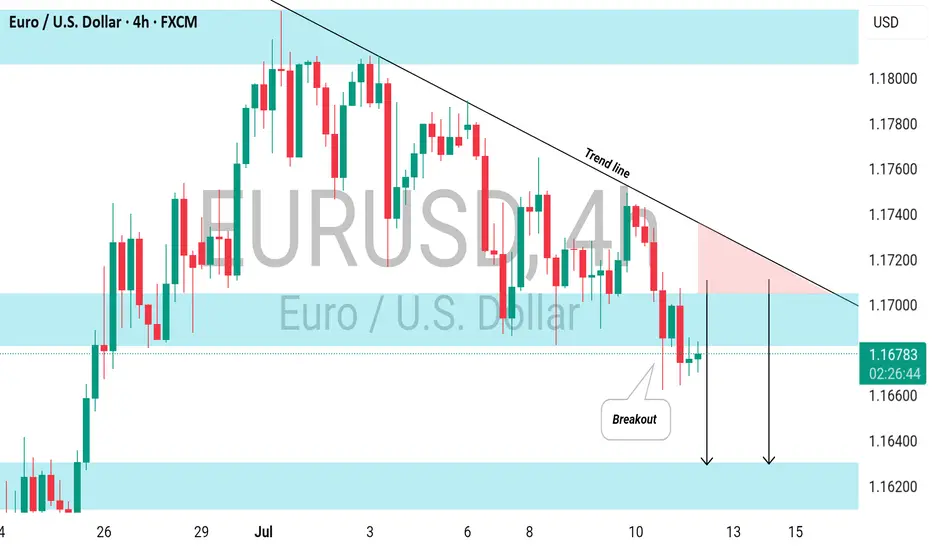
EURUSD: Bearish Continuation Ahead EURUSD is expected to maintain a bearish trend following a confirmed breakout below a significant horizontal support level.
The broken structure, along with a descending trend line, creates a contracting supply zone, indicating a strong likelihood of further downward movement.
The next target is 1.1620 support
GBPNZD: One More Pullback Trade I notice another potentially profitable pullback trade opportunity on 📉GBPNZD.
The price formed a double top pattern after testing a significant daily/intraday resistance and has broken through its neckline.
Currently, we are witnessing a retest, and the pair could pull back to the 2.2391 level.

AUDUSD SHORT & LONG FORECAST Q3 D11 W28 Y25AUDUSD SHORT & LONG FORECAST Q3 D11 W28 Y25
It’s Fun Coupon Friday! 💸🔥
Professional Risk Managers👋
Welcome back to another FRGNT chart update📈
Diving into some Forex setups using predominantly higher time frame order blocks alongside confirmation breaks of structure.
Let’s see what price action is telling us today! 👀
💡Here are some trade confluences📝
✅Daily Order block identified
✅4H Order Block identified
✅1H Order Block identified
🔑 Remember, to participate in trading comes always with a degree of risk, therefore as professional risk managers it remains vital that we stick to our risk management plan as well as our trading strategies.
📈The rest, we leave to the balance of probabilities.
💡Fail to plan. Plan to fail.
🏆It has always been that simple.
❤️Good luck with your trading journey, I shall see you at the very top.
🎯Trade consistent, FRGNT X

USDCAD LONG DAILY FORECAST Q3 D11 W28 Y25USDCAD LONG DAILY FORECAST Q3 D11 W28 Y25
It’s Fun Coupon Friday! 💸🔥
Professional Risk Managers👋
Welcome back to another FRGNT chart update📈
Diving into some Forex setups using predominantly higher time frame order blocks alongside confirmation breaks of structure.
Let’s see what price action is telling us today! 👀
💡Here are some trade confluences📝
✅Daily Order block identified
✅4H Order Block identified
✅1H Order Block identified
🔑 Remember, to participate in trading comes always with a degree of risk, therefore as professional risk managers it remains vital that we stick to our risk management plan as well as our trading strategies.
📈The rest, we leave to the balance of probabilities.
💡Fail to plan. Plan to fail.
🏆It has always been that simple.
❤️Good luck with your trading journey, I shall see you at the very top.
🎯Trade consistent, FRGNT X

#AN018: Summer shock, tariffs, Fed delays, and the dollar's shif
In recent days, the forex world has experienced a sequence of key events that could redefine the global currency landscape in the coming months. Risk to the dollar has become structural, the threat of tariffs is multiplying again, and the combination of geopolitical uncertainty and monetary policy creates an extremely risky mix for exchange rates.
Let's start with the Fed minutes: Jerome Powell attributed tariff risk to the main reason for postponing possible rate cuts. Market expectations are realigning toward a longer rate cycle, fueling a climate of global uncertainty. At the same time, Goldman Sachs warns that the dollar is increasingly moving as a "risky" currency, correlated with equity markets—an emerging market rather than a safe haven.
On the geopolitical front, President Trump has relaunched the trade war: announcements of tariffs of up to 35% on Canada, up to 20% on Europe, and 50% on copper from Brazil have caused futures volatility to soar and sent the dollar into a short-term rally. But Deutsche Bank is sounding the alarm: the summer period of low liquidity and rising trade tensions represents a potential trigger for prolonged currency turbulence.
The Financial Times envisions a scenario in which the dollar loses ground as the dominant currency, ushering in a multipolar currency world in which the euro, renminbi, gold, and even cryptocurrencies could gain ground.
The impact on Forex:
USD: The narrative is changing: no longer a net safe haven, but an asset correlated with political and risk cycles. The weakness of the DXY index in the first half of 2025 (-10%) reflects this transition.
EUR/USD: Potentially favored if the dollar continues its consolidation. However, new tariffs and US-EU uncertainty could provide temporary support for the greenback.
USD/JPY and USD/CHF: These crosses will be subject to greater volatility, with the next catalyst being the Fed minutes and the timing of tariffs. Safe-haven currencies strengthen during periods of uncertainty.
CAD, AUD, NZD: penalized by tariffs on Canada and Brazil and a weak dollar. OPEC+ and geopolitical tensions could boost commodities, but data confirmation is needed.
Commodity cross-correlation: USD/CAD could rebound if oil loses momentum, while AUD/JPY is sensitive to both the RBA and increased global risk.
Conclusion:
The current currency environment appears unstable and sensitive to political and trade developments. Summer volatility could persist, and those who can read the macro and institutional signals (Fed, tariffs, geopolitics) will have the opportunity to enter accurately. Until a stable direction emerges, EUR/USD looks like the most interesting cross to capture a potential structural correction in the dollar.

USDJPY LongWe have a break of structure. the pair is forming a Elliot wave pattern. We are joining at the current market to complete the 4th wave. Lets see how it goes.

EUR USD SHORT RESULT Price faked out of the resistance Trendline of the major 4HTF ascending range and showed signs of weakness in momentum and to the downside.
From where I took the short position, it moved down nice but the NFP news volatility took out my trailing stop. But overall moved in our direction 🔥
_THE_KLASSIC_TRADER_.

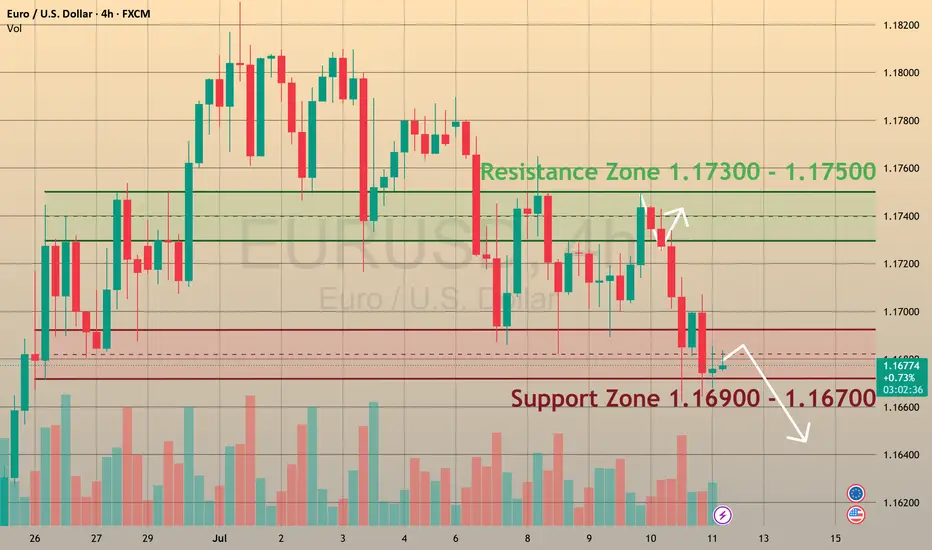
EURUSD is ready to break supportCMCMARKETS:EURUSD
The Euro fell to 1.1670 on Friday, positioning for nearly a 1% weekly loss 📊, as investors recalibrated risk exposure amid escalating trade tensions ⚔️ and shifting monetary policy signals 🏦.
📉 Market Structure:
🔻 EURUSD has traded in a bearish trend since July 1.
🔹 Support levels: 1.1680 and 1.1590.
🔹 Retested the 1.1680 support zone on Friday.
💡 How to Trade This:
✅ If the pair rebounds from support 🔄, consider BUYING with a Take Profit near the next resistance level.
❌ If the support breaks with confirmation 🩻, consider SELLING to target lower support zones.
📰 What’s Driving the Move?
🏦 Monetary Policy:
Chicago Fed President Austan Goolsbee pushed back against calls for aggressive rate cuts 🗣️, reaffirming the Fed’s focus on its dual mandate of maximum employment and price stability ⚖️. His cautious stance adds uncertainty 🤔 to the policy outlook for the second half of the year as markets weigh inflation risks vs. growth slowdown signals.
💼 Economic Data:
The labor market remains solid 💪, but recent jobless claims data show early signs of cooling 🧊, following last week’s strong NFP report.
💵 Dollar Strength:
The dollar advanced sharply against the euro 🚀, driven by risk aversion, relative yield advantages, and investor positioning ahead of upcoming inflation data and the Fed’s next policy signals 📈.
🚨 Watch for:
🔸 A confirmed breakout or rebound at 1.1680 to guide trade entries.
🔸 Upcoming U.S. inflation data 🪙 for direction on Fed policy and USD strength.
🔸 Further developments in trade tensions 🌐, which could drive risk sentiment.
Let’s enter this position with **confidence and discipline**.✅ **The price has cleanly pulled back to 146.900**, which is exactly what we were waiting for.
We are in the **right zone, right signal, right timing.**
Let’s go. 💪📈

Eurousd techinical analysis.This EUR/USD chart (1-hour timeframe) presents a technical analysis setup involving key levels, trendlines, and a forecasted bearish move. Here's a breakdown:
Key Observations:
1. Descending Triangle Formation:
The chart shows a descending triangle pattern formed by a downward-sloping resistance trendline (blue) and a horizontal support zone around 1.1670 (purple box).
This is typically a bearish continuation pattern.
2. Resistance Levels:
Immediate resistance is near 1.1700, followed by a stronger resistance at around 1.1745–1.1755.
These are previous support zones turned resistance after the breakdown.
3. Support Zone:
Strong support around 1.1670 has been tested multiple times, indicated by the purple rectangle at the bottom.
4. Projected Move:
The blue squiggly arrows suggest a potential pullback or consolidation, followed by a rejection at the descending trendline, leading to a downward breakout below the support zone.
5. Market Sentiment:
The momentum is currently bearish, with recent lower highs and lower lows.
The price action is respecting the trendline resistance, which strengthens the case for a downward breakout.
---
Possible Scenarios:
Bearish (Likely) Scenario:
Break below 1.1670 → Target zones could be 1.1650 or lower, depending on volume and market reaction.
Could trigger stop-losses below the consolidation zone and fuel further selling.
Bullish (Invalidation) Scenario:
Break above descending trendline and 1.1700 → Could challenge 1.1745–1.1755 resistance.
Would invalidate the bearish triangle and suggest potential reversal.
---
Conclusion:
This chart suggests a bearish bias, with traders potentially looking for a short entry on a rejection from the descending trendline or a confirmed break of the 1.1670 support zone. Watch for volume confirmation and price reaction around these levels.

11.07.25 Morning ForecastPairs on Watch -
FX:EURUSD
FX:EURCAD
FX:EURAUD
A short overview of the instruments I am looking at for today, multi-timeframe analysis down to what I will be looking at for an entry. Enjoy!

Bullish reevrsal?EUR/NZD has bounced off the pivot and could rise to the 61.8% Fibonacci resistance.
Pivot: 1.93667
1st Support: 1.93001
1st Resistance: 1.94871
Risk Warning:
Trading Forex and CFDs carries a high level of risk to your capital and you should only trade with money you can afford to lose. Trading Forex and CFDs may not be suitable for all investors, so please ensure that you fully understand the risks involved and seek independent advice if necessary.
Disclaimer:
The above opinions given constitute general market commentary, and do not constitute the opinion or advice of IC Markets or any form of personal or investment advice.
Any opinions, news, research, analyses, prices, other information, or links to third-party sites contained on this website are provided on an "as-is" basis, are intended only to be informative, is not an advice nor a recommendation, nor research, or a record of our trading prices, or an offer of, or solicitation for a transaction in any financial instrument and thus should not be treated as such. The information provided does not involve any specific investment objectives, financial situation and needs of any specific person who may receive it. Please be aware, that past performance is not a reliable indicator of future performance and/or results. Past Performance or Forward-looking scenarios based upon the reasonable beliefs of the third-party provider are not a guarantee of future performance. Actual results may differ materially from those anticipated in forward-looking or past performance statements. IC Markets makes no representation or warranty and assumes no liability as to the accuracy or completeness of the information provided, nor any loss arising from any investment based on a recommendation, forecast or any information supplied by any third-party.

Bullish bounce off overlap support?EUR/GBP is falling towards the pivot, which has been identified as an overlap support and could bounce to the 1st resistance, which acts as a pullback resistance.
Pivot: 0.8569
1st Support: 0.8538
1st Resistance: 0.8640
Risk Warning:
Trading Forex and CFDs carries a high level of risk to your capital and you should only trade with money you can afford to lose. Trading Forex and CFDs may not be suitable for all investors, so please ensure that you fully understand the risks involved and seek independent advice if necessary.
Disclaimer:
The above opinions given constitute general market commentary, and do not constitute the opinion or advice of IC Markets or any form of personal or investment advice.
Any opinions, news, research, analyses, prices, other information, or links to third-party sites contained on this website are provided on an "as-is" basis, are intended only to be informative, is not an advice nor a recommendation, nor research, or a record of our trading prices, or an offer of, or solicitation for a transaction in any financial instrument and thus should not be treated as such. The information provided does not involve any specific investment objectives, financial situation and needs of any specific person who may receive it. Please be aware, that past performance is not a reliable indicator of future performance and/or results. Past Performance or Forward-looking scenarios based upon the reasonable beliefs of the third-party provider are not a guarantee of future performance. Actual results may differ materially from those anticipated in forward-looking or past performance statements. IC Markets makes no representation or warranty and assumes no liability as to the accuracy or completeness of the information provided, nor any loss arising from any investment based on a recommendation, forecast or any information supplied by any third-party.
