$SPY Tomorrow's Trading RangeNo words tonight - just the chart for tomorrow. 1hr 200MA and the 50DMA above us
ETF market

Market Outlook for 2025: SPY Price TargetsMarket Outlook for 2025: SPY Price Targets
As we navigate through 2025, investors and traders are closely monitoring the S&P 500 ETF (SPY) for signs of where the market might head. Here’s a detailed monthly breakdown of expected price movements:
January:
Downside Target: $574.15
Upside Target: $593.15
Outlook: The new year begins with a cautious note, with a narrow trading range expected. The market might see early profit-taking or a response to late-year 2024 policy news.
February:
Downside Target: $563.75
Upside Target: $589.13
Outlook: February might continue the cautious trend from January, with potential for a slight recovery if early-year economic indicators are positive.
March:
Downside Target: $561.78
Upside Target: $601.45
Outlook: Spring might bring some optimism, with the upside target suggesting a possible rally, perhaps due to seasonal adjustments in investment strategies.
April:
Downside Target: $538.23
Upside Target: $567.03
Outlook: This month could see a dip, reflecting concerns over quarterly earnings or macroeconomic data. However, the upside potential indicates a possible quick recovery or stabilization.
May:
Downside Target: $549.27
Upside Target: $592.61
Outlook: Traditionally, May can be volatile, but the significant upside target suggests optimism, possibly fueled by positive corporate guidance or sector performance.
June:
Downside Target: $572.31
Upside Target: $614.92
Outlook: Summer starts with promise, with a wide range between targets, indicating potential for significant market movements based on mid-year reviews or policy changes.
July:
Upside Target: $618.20
Downside Target: $597.21
Outlook: July might see continued growth from June, with the upside target slightly higher, suggesting sustained investor confidence.
August:
Upside Target: $623.45
Downside Target: $593.93
Outlook: The summer could end on a high note, but with a notable downside risk, reflecting market reactions to economic reports or geopolitical events.
September:
Downside Target: $598.52
Upside Target: $615.57
Outlook: Historically, September is a turbulent month for markets. The narrow range suggests cautious trading with a slight bias towards an upward trend.
October:
Upside Target: $629.96
Downside Target: $597.17
Outlook: October might see a recovery or continuation of September's trends, with a significant upside potential if the market absorbs positive economic news.
November:
Upside: $631.56
Downside Target: $618.20
Outlook: Late-year optimism could drive prices up, with the downside target still above previous months' peaks, indicating a bullish sentiment.
December:
Upside Target: $645.83
Downside Target: $632.32
Outlook: The year might end on a high, with both targets suggesting a market that's resilient or buoyed by end-of-year adjustments and holiday spending.
Conclusion:
This outlook for 2025 suggests a year of volatility with significant potential for both gains and corrections. Investors should remain vigilant, adapting to both the micro and macroeconomic environments, and be ready to capitalize on or hedge against these projected movements in SPY. Remember, these targets are speculative and should be used in conjunction with broader market analysis and individual investment goals.

SPY at a Pivotal Level! Key Trade Setups Before Next Week's EvenSPY is trading within a descending wedge, testing the $591-$592 resistance zone. The chart shows mixed signals, with the MACD trending slightly bearish and the Stochastic RSI approaching overbought territory, suggesting potential near-term weakness. Volume has been steady, but the upcoming Presidential inauguration next week may bring increased volatility.
The $593-$595 range aligns with significant call resistance, while $590-$588 remains critical support, as indicated by gamma exposure (GEX) and options positioning. These levels are likely to guide SPY's movement heading into the politically significant week.
Key Levels to Watch:
* Resistance Levels:
* $593-$594: Immediate resistance, aligning with strong GEX call walls.
* $595-$598: Extended resistance zone with significant gamma exposure.
* Support Levels:
* $591: Near-term support level.
* $590-$588: Strong support zone with the highest negative GEX and put positioning.
* $576: Extended downside support.
GEX Insights:
* Gamma Exposure (GEX):
* Positive GEX at $593-$595 acts as a ceiling, limiting upward momentum.
* Negative GEX at $590-$588 provides strong support, but a break could trigger accelerated selling.
* Options Activity:
* IVR: Low at 16.3, indicating reduced implied volatility.
* Put/Call Ratio: Elevated at 40.3%, reflecting bearish sentiment among options traders.
Trade Scenarios:
Bullish Scenario:
* Entry: Break above $593 with volume confirmation.
* Target: $595 (first target), $598 (extended target).
* Stop-Loss: Below $591.
Bearish Scenario:
* Entry: Break below $590 with increased selling pressure.
* Target: $588 (first target), $576 (extended target).
* Stop-Loss: Above $593.
Directional Bias:
The bias leans bearish for the short term, with SPY likely to test lower levels before the inauguration. Political uncertainty and potential market volatility may keep SPY range-bound between $588 and $595 this week.
Heading into the next week, a decisive break of the $595 resistance could signal bullish momentum, while a breach of $588 support may lead to a sharper selloff as traders react to political developments and policy announcements.
Actionable Suggestions:
* For Scalpers: Focus on trading the $590-$593 range, aligning with GEX levels and intraday trends.
* For Swing Traders: Position for a potential breakout or breakdown from $588-$595 next week, depending on the political backdrop and market reaction.
Disclaimer: This analysis is for educational purposes only and does not constitute financial advice. Always do your own research and manage your risk before trading.

IWM Testing Resistance! Key Trade Setups Ahead Analysis:
IWM is consolidating within a narrowing wedge pattern near the $224-$225 resistance zone. The stock is showing signs of a potential breakout or breakdown as it approaches the apex of the wedge. The MACD is neutral but trending slightly bearish, while the Stochastic RSI is in the mid-range, suggesting indecision among buyers and sellers.
Volume has been steady, with resistance near $227 and strong support at $222. A break above or below these levels will likely dictate the next directional move.
Key Levels to Watch:
* Resistance Levels:
* $225-$227: Strong resistance zone, aligning with the second call wall and positive GEX levels.
* $228: Extended resistance target.
* Support Levels:
* $223: Immediate support near the wedge’s lower trendline.
* $222: Key support level aligned with the highest negative GEX.
* $220: Extended downside support.
GEX Insights:
* Gamma Exposure (GEX):
* Positive GEX peaks at $227-$228, indicating significant overhead resistance.
* Negative GEX levels at $222-$220 provide critical support and signal increased volatility if breached.
* Options Activity:
* IVR: Low at 17, reflecting reduced implied volatility.
* Put/Call Ratio: Low put activity at 3.3%, indicating bullish sentiment is stronger.
Trade Scenarios:
Bullish Scenario:
* Entry: Break above $225 with strong volume.
* Target: $227 (first target), $228 (extended target).
* Stop-Loss: Below $223.
Bearish Scenario:
* Entry: Break below $223 with increasing selling pressure.
* Target: $222 (first target), $220 (extended target).
* Stop-Loss: Above $225.
Directional Bias:
Neutral bias as IWM remains within the wedge pattern. A breakout above $225 or a breakdown below $223 will confirm the next directional move.
Actionable Suggestions:
* For Scalpers: Focus on quick trades near $223-$225, watching for volume surges.
* For Swing Traders: Look for a confirmed breakout or breakdown from the wedge pattern before committing to a position.
Disclaimer: This analysis is for educational purposes only and does not constitute financial advice. Always do your own research and manage your risk before trading.

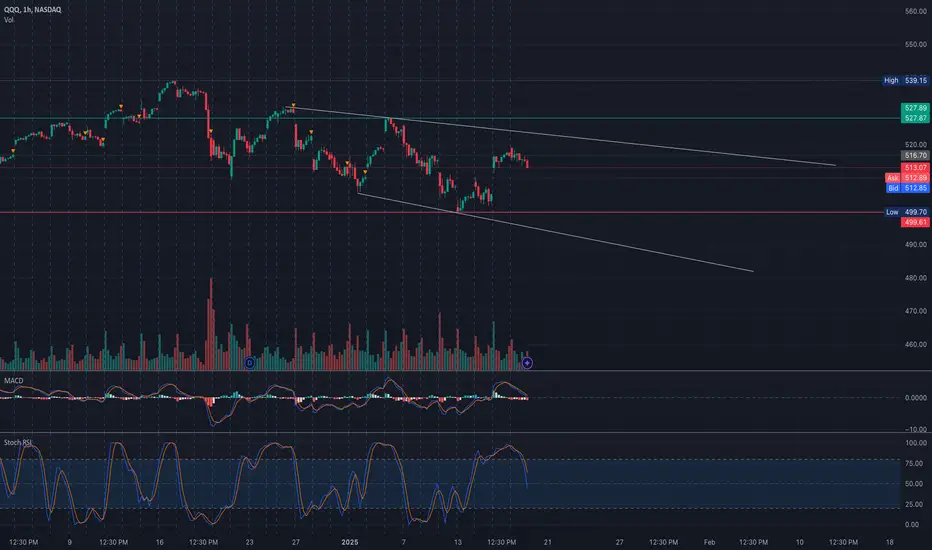
QQQ Approaching Critical Levels! Trade Setups to Watch Analysis:
QQQ has been trending downward within a descending channel, currently trading near the $512-$513 level. This range aligns with key GEX resistance and put support, indicating a balance between buyers and sellers. The MACD is bearish, showing downward momentum, while the Stochastic RSI suggests the potential for a relief bounce as it approaches oversold conditions.
Volume indicates indecision, with sellers maintaining control but showing some hesitation near the $510-$513 zone.
Key Levels to Watch:
* Resistance Levels:
* $516-$518: Immediate resistance, aligning with GEX call walls.
* $520-$522: Critical resistance with strong gamma positioning and call walls.
* Support Levels:
* $513: First support level.
* $511-$512: Key support with significant negative GEX positioning.
* $508: Extended downside support within the channel.
GEX Insights:
* Gamma Exposure (GEX):
* Positive GEX peaks near $520-$522, indicating strong overhead resistance.
* Negative GEX at $511-$512 provides a key support zone but signals potential volatility if breached.
* Options Activity:
* IVR: Low at 16.2, suggesting reduced implied volatility.
* Put/Call Bias: Puts dominate at 25.1%, showing bearish sentiment.
Trade Scenarios:
Bullish Scenario:
* Entry: Break above $516 with volume confirmation.
* Target: $520 (first target), $522 (extended target).
* Stop-Loss: Below $513.
Bearish Scenario:
* Entry: Break below $511 with increasing selling pressure.
* Target: $508 (first target), $505 (extended target).
* Stop-Loss: Above $514.
Directional Bias:
The bias is cautiously bearish as QQQ continues to trade within the descending channel. However, a break above $516 could signal a short-term relief rally.
Actionable Suggestions:
* For Scalpers: Focus on the $511-$516 range for quick trades in either direction.
* For Swing Traders: Monitor key levels around $508-$522 for breakout or breakdown opportunities.
Disclaimer: This analysis is for educational purposes only and does not constitute financial advice. Always do your own research and manage your risk before trading.
$TLT Bullish CypherReal nice look here on TLT for a wave 1 and 2, forming the bullish cypher at the lows.
This is an update to our trade from Oct 23 and a secondary entry here on the 3day, with triple bullish divergence on the weekly.
Macro momentum hasnt turned up quite yet, but obviously on the higher time frames thats going to be lagged pretty good. The daily however is just now beginning to cross up, and will continue rising above 85, with an expectation of exhaustion as high as 130.
The daily ADX is also rolling over and signaling the end of the bearish trend. Volatility is still contracting on the daily, so it could take a little time to get an expanding environment of the lows, which would be inline with a type 2 reaction / db locally here at the 886.
Theres always a chance youll get a sweep of the lows for a spring event, but that isnt being suggested here. If this happens i would consider it an opportunity for options, if the break lower is rejected and the range is reclaimed as support.
A lot of implications here if we see this play out.

IWM ResistanceShort entry at the start of resistance. To enter or not depends on price action. Planned this trade using the daily chart. Target is the gap on the daily which also happens to be around were the 1hr 20ema is.

The dragon is breathing FIREAMEX:YINN & AMEX:CHAU : READY TO PUMP!
Mark your calendars, people—THIS is the week to go BIG! 📅 I’m calling it now: AMEX:YINN and AMEX:CHAU are set to explode within the next few days. The key dates are 1/17, 1/21, and 1/27. These are the moments to watch as the Chinese market heats up like never before! 💥🔥
Economic recovery? ✅ Policy support? ✅ Market momentum? ✅ The stage is set for a MASSIVE breakout, and I’m riding this wave with 3x leverage all the way to the moon, options are in, wait for it! 🌕✨
Forget hesitation—this is your golden ticket. The dragon is breathing FIRE, and AMEX:YINN and AMEX:CHAU are about to melt faces with gains. 🐉🔥 Don’t miss the rocket launch! 🚀
#YINN #CHAU #ChinaStocks #BullRun2025 #MassiveGains #PumpItUp

ALL IN: $YINN & $CHAU to the MOON!This is it, folks! Chinese stocks are about to go absolutely ballistic! 💥 I'm loading up on AMEX:YINN and AMEX:CHAU because I believe this is THE breakout moment we've been waiting for! 📈✨
AMEX:YINN (3x leveraged Chinese large-cap stocks) and AMEX:CHAU (3x leveraged China A-shares) are primed to deliver insane gains as China’s market heats up. With economic recovery in full swing and policy tailwinds pushing hard, these ETFs are my tickets to the BIG leagues! 🌟💸
The dragon is awake, and it’s ready to FLY! 🐉🚀 Forget the sidelines—I'm riding this rocket straight to the stars! 🌌💯
Who's with me? LET'S GO! 💪🔥
#YINN #CHAU #ChinaStocks #StockMarketMadness #NextLevelGains #TradingMomentum

SPY SHORT $550 TargetThe ascending wedge has clearly broken down, with the previous bullish wave running out of steam after a buy climax. Selling into this weakness triggered the breakdown and a shift in market character, as seen in after-hours trading. SPY is failing to generate bullish order flow, and I expect it to reach 550 by March.

$spy $ag $slv What is going on here?What caused this stock to decouple from the price of silver? Why can they not make money in this environment? This should be at 20. Anybody know what is going on with AG?

Double Bottom in UtesDouble bottom has completed within a broadening wedge in Utilities. Pattern length was 28 days. Price objective are 80.49 and 82
AMEX:XLU

Up is more likely Smooth landing for Donny, these are my thoughts. Spy might have a large bull back later but need stability for the President.

QQQ ending wave 4 wave 5 561.8to 563 max min 553I am now in a 100 % to 110 % long calls position We are only a few hours away from the start of the final 5th wave to mark the HIGH for the YEAR 2025 .I am now working on the spiral date and I am looking for a 3.5 to 6 week rally from this Low Best of trades WAVETIMER

SPY/QQQ Plan Your Trade For 1-16 : Momentum Rally PatternToday's pattern suggests the markets will continue a rally phase - trending on the momentum from yesterday. It is likely the SPY/QQQ will attempt to rally and break away from the downward-sloping price channel I show on my charts.
Remember, my broader cycle pattern research suggests the SPY/QQQ will attempt to rally into Jan 20-23, then peak and roll downward/sideways into a Feb 9-10 V-Bottom pattern.
As I highlight in this video, the markets appear to be moving into a consolidation phase within the current downward-sloping price channel. I'm watching to see if the new Trump administration brings a BUMP (like last time) that breaks the US markets away from this consolidation trend.
Remember, the data on the US economy and earnings continues to be strong. A Trump-Bump will likely happen again, pushing the US markets into even greater dominance as the 900-lb Gorilla compared to other global economies.
However, until global central banks can move their economies to become more independent of US economic demand and imports, the process of working through the excesses of the COVID/Spending-spree administration (Biden) will continue as long as wealth in the US goes unchallenged (by some crisis or economic event).
So, again, expect the 900lb Gorilla to continue to dominate while there is no major crisis event in the future.
Gold and Silver should rally today on a RALLY pattern as well.
I believe BTCUSD is struggling to find support and may move downward over the next 10+ days.
We'll see what happens.
Get some.
#trading #research #investing #tradingalgos #tradingsignals #cycles #fibonacci #elliotwave #modelingsystems #stocks #bitcoin #btcusd #cryptos #spy #es #nq #gold

$SPY January 16, 2025AMEX:SPY January 16, 2025
15 minutes.
Yesterday gap open was held.
For the last rise from 578.97 to 592.96 AMEX:SPY retraced to 589.5 before achieving the target 594 for yesterday's move.
598.5 represents 23.6% fall for the last rise and took support at 61.8% retracement for the fall 597.74 to 575.35.
Hence it is important that AMEX:SPY holds 589 levels for upward movement.
For the extension 575 to585 to 578.35, 594 was achieved being 1.618 levels for the first rise.
At the moment we have 200 averages above 50 and 100 in 15 minutes, hence I expect AMEX:SPY to consolidate between 590 to 593 levels today for a further up movement tomorrow.
Also, we have an oscillator divergence from 592.9 to 593.9 levels
No trade day for me today.

SPY: Week of Jan 13th Lots of thoughts but generally undecided.
In summary:
I expect a bit of a bounce up to the 582 range.
I expect a ton of volatility given the economic catalysts which will make it incredibly challenging for day traders attempting to trade it.
I would caution starting a short position if you are not already short and wait to see how it treats the bearish triangle it has broken down from.
Expect upside to the reference target at least at 582 ish.
Expect a whole lot of whipsaw!
Safe trades everyone!
And those wanting the implied range from options indicator:

$SMHGetting very coiled back in the old triangle after a break out and very steep, harsh retest after a failed breakout. We held the bottom of the triangle and seem primed to launch of the vwap/volume. If we can springboard back out of the triangle there is an old volume gap from ~$262-272, right above early january highs. a $20 point move could happen quickly

SPY Gap-Up Analysis and GEX InsightsMarket Overview:
* SPY experienced a strong gap-up today, signaling bullish momentum driven by improved market sentiment and possibly favorable news/events.
* Sector Performance: Leadership is evident in growth and technology sectors, while defensive plays are relatively lagging.
* Volume: Notable increase in volume during the breakout, confirming institutional participation.
Technical Analysis:
1-Hour Chart:
* Trend: SPY continues its upward trajectory, testing resistance near $593-$595.
* Indicators:
* MACD: Displays positive momentum, but the histogram shows early signs of weakening.
* Stochastic RSI: Overbought at 96.72, indicating potential for short-term consolidation.
30-Minute Chart:
* Price Action:
* SPY is consolidating below $595 resistance after breaking above $584.
* The bullish gap-up aligns with recent strength, but momentum could face resistance at higher levels.
* Pattern: SPY appears to be forming a rising wedge, a potential bearish reversal pattern if confirmed.
Key Levels to Watch:
Support Levels:
* $590: Immediate support zone and HVL (Highest Volume Level).
* $584: Strong support aligned with the 2nd PUT Wall.
* $576: Key support, marking the lower trendline of the wedge.
Resistance Levels:
* $593-$595: Immediate resistance, coinciding with the 2nd CALL Wall and highest positive NETGEX.
* $596-$600: Major resistance zone, with $600 as a psychological level and 3rd CALL Wall.
Gamma Exposure (GEX) Insights:
Key Gamma Levels:
* Positive Gamma Walls (Resistance):
* $595: 71.53% GEX (2nd CALL Wall).
* $596-$600: High resistance zone, with $596 holding 68.17% GEX (3rd CALL Wall).
* Negative Gamma Levels (Support):
* $590: Strong support, holding 15.01% GEX9.
* $584: Critical support zone with PUT dominance (-0.39% GEX).
Options Metrics:
* IVR: 16.4, reflecting low implied volatility.
* IVx: 14.4, below average, indicating stable market expectations.
* Call/Put Bias: Puts dominate at 42.1%, signaling cautious sentiment.
Trade Scenarios:
Bullish Scenario:
* Entry: Above $595 with confirmation of volume.
* Target: $596-$600.
* Stop-Loss: Below $590 to manage risk.
Bearish Scenario:
* Entry: Rejection at $595 or breakdown below $590.
* Target: $584-$576.
* Stop-Loss: Above $596 to minimize losses.
Directional Bias:
* Bullish Momentum: SPY is poised for further gains if $595 resistance is cleared, targeting $596-$600.
* Caution for Pullback: Overbought conditions and rising wedge formation suggest potential consolidation or retracement toward $584-$590 support.
Weekly Outlook:
* SPY's bullish momentum is likely to continue if market sentiment remains positive, with $600 as the major target by week's end. However, a failure to hold $590 may trigger a retest of lower support levels, presenting short-term opportunities for traders.
Disclaimer:
This analysis is for educational purposes only and does not constitute financial advice. Always conduct your research and trade responsibly.

USO Climbs to Resistance! Can Bulls Maintain Momentum?Technical Analysis Overview:
1-Hour Chart:
* Trend: USO is in a strong uptrend, reaching $84.36 near the upper trendline.
* Indicators:
* MACD: Positive momentum, with the MACD line above the signal line.
* Stochastic RSI: Overbought at 92.16, suggesting a potential pullback or consolidation.
30-Minute Chart:
* Price Action:
* USO is trading near resistance at $84.50, with support around $82.80.
* Increasing volume supports the recent bullish move.
Key Levels to Watch:
Support Levels:
* $82.80: Immediate support zone.
* $78.89: Strong support level.
* $77.05: Key support from prior consolidation.
Resistance Levels:
* $84.50: Immediate resistance at the upper trendline.
* $86: Next resistance level if $84.50 is breached.
Trade Scenarios:
Bullish Scenario:
* Entry: Break above $84.50 with volume confirmation.
* Target: $86-$88.
* Stop-Loss: Below $82.80 to limit risk.
Bearish Scenario:
* Entry: Rejection at $84.50 or breakdown below $82.80.
* Target: $80-$78.89.
* Stop-Loss: Above $84.50 to minimize losses.
Directional Bias:
* USO’s upward momentum suggests bullish strength, but the overbought Stochastic RSI warns of potential consolidation or a pullback near $84.50 resistance.
Conclusion:
USO is trading near critical resistance at $84.50. A breakout could propel prices toward $86, while failure to hold current levels may lead to a retest of support at $82.80 or lower. Monitor volume and momentum indicators for actionable setups.
Disclaimer:
This analysis is for educational purposes only and does not constitute financial advice. Always conduct your research and trade responsibly.

Dow Jones ETF ($DIA) Nears Resistance! Can Bulls Push Higher?Technical Analysis Overview:
1-Hour Chart:
* Trend: DIA has broken out of a descending wedge pattern and is approaching resistance near $433.
* Indicators:
* MACD: Bullish momentum is weakening, with the histogram contracting.
* Stochastic RSI: Overbought, indicating a possible short-term pullback or consolidation.
30-Minute Chart:
* Price Action:
* DIA is trading near $433, a key resistance level, with support around $427.
* The breakout from consolidation has been supported by increasing volume.
Key Levels to Watch:
Support Levels:
* $427: Immediate support zone, also the HVL (highest volume level).
* $424: Strong PUT support level (-4.92% GEX).
* $419: Major support aligned with the 3rd PUT Wall.
Resistance Levels:
* $433: Immediate resistance, coinciding with the highest positive NETGEX level.
* $437: Next resistance zone (GEX7).
* $440: Major resistance aligning with the 3rd CALL Wall.
GEX Insights:
Key Gamma Levels:
* Positive Gamma Walls (Resistance):
* $433: Key resistance and the highest positive NETGEX.
* $437: 55.86% GEX (2nd CALL Wall).
* $440: 39.89% GEX (3rd CALL Wall).
* Negative Gamma Levels (Support):
* $427: Immediate support zone (-23.78% GEX).
* $424: Strong PUT Wall (-4.92% GEX).
* $419: Significant support level (-3.33% GEX).
Options Metrics:
* IVR: 22.6, reflecting low implied volatility.
* IVx: 14.5, well below average, indicating muted price fluctuations.
* Call/Put Bias: Puts dominate at 29.2%, indicating mixed sentiment.
Trade Scenarios:
Bullish Scenario:
* Entry: Above $433 with volume confirmation.
* Target: $437-$440.
* Stop-Loss: Below $427 to limit risk.
Bearish Scenario:
* Entry: Rejection at $433 or breakdown below $427.
* Target: $424-$419.
* Stop-Loss: Above $437 to control losses.
Directional Bias:
* DIA’s breakout above the descending wedge indicates bullish potential. However, the overbought Stochastic RSI suggests caution near $433 resistance. A confirmed breakout could lead to $437-$440, while a rejection may pull prices back to $427 or lower.
Conclusion:
DIA is at a critical resistance level near $433. Traders should monitor volume and momentum for a breakout or rejection. The gamma landscape supports further upside if $433 is cleared, but a failure to hold could lead to a retest of $427-$424.

Change in market theme. Bullish Variables in Favor:
+2 rate cuts probabilities now above the 0 rate cuts. 3 rate cuts 100% increase. Reversal in trend from Jan 13
+TLT has breakout the downtrend coming from DEC, correlated too with the US10Y failing to break 2024 Highs.
+PPI lower than expected 0.2 vs 0.4 m/m
+CPI 2.9 as expected / Core lower 0.2 vs 0.3
+Risk On Assets Turning, Total2 ( Crypto marketcap excludingBTC) is up 15% from Jan 13
+Risky sectors outperfoming ARKK.
+Vix -30% from Jan 13
+DT possesion on Monday 20
Techinal variables:
+ Failed breakdonw in market indexes levels Cat 8-9
+ RSI at 30 in the 4h plus cross of the MA, positive.
+ Squeeze momentum to the downside over, near 0
+Reclaim above of the monthly vwap on QQQ-SPY
Still in look:
+Downtrendline coming from DEC ATH, Market testing now
+Retail sales tomorrow
In my case because I'm long from yesterday it will be easier to hold into tomorrow, but for a position opened today I'm less sure. Because of the retail sales and the trendline, can be normal to have a pullback, and pick momentum on friday into monday.

Possibly Breaking out of down trendI see a somewhat double rejection at 500-501 on the Daily. Right now, we are hovering around the Upside of this trend Channel & resistance level 516. I’m looking for a buy up to 519 then a reversal To 516 for double bottom to Break out of the trend we’ve been in. If we fail to a double bottom at 516 And Sell through 516 we remain in a Weekly down trend for . 519 is the level to get on the other side of. Also keep in mind Donald Trump will be inaugurated on Monday. I think this will affect the markets volatility. We May see Strong buys.
