XLE Coming to Supply zone Seems to be in a sideways trend. Did i follow the plan?
Entry
Exit
How did it go?
ETF market

$XLV - potential head and shoulderAMEX:XLV it could bounce to $145 but that could also mean a potential right shoulder could form. There are other easier trades. Pass.

Next 4 Year OutlookAs I types this we are Six days away from the inauguration of President Donald Trumps Second Term. His threats to impose 25% Tariffs on his NA allies, Canada and Mexico looms over (if I were a betting man, Loose air). Besides the matter, I still hold the ideology, that the United States will remain the dominant and leading financial market in the world economy.

China’s Internet Revival?KraneShares CSI China Internet ETF is exhibiting strong bullish momentum, with a gap forming around the $27.00 level. A breakout above the $32.60 daily resistance would confirm further strength, positioning the ETF to target $46.19. This trade setup offers an excellent risk-to-reward ratio, with a stop-loss set at $24.82 to manage downside risk.
KWEB provides exposure to China’s leading internet and technology companies, which are poised for growth as the Chinese economy recovers and consumer demand strengthens. As regulatory pressures ease and innovation accelerates across key industries like e-commerce, digital finance, and cloud services, this ETF stands to benefit significantly.
For a deeper dive into this setup, check out my YouTube breakdown, where I analyze the technical trends and discuss the fundamentals driving this opportunity.
With its combination of technical momentum and favorable macroeconomic conditions, KWEB presents an attractive opportunity for traders and investors aiming for $46.19.
AMEX:KWEB

2025 Recession, SPY to Crash But Not YetEvery finance youtuber has been singing about an incoming market crash, recession and all sorts of doom for the past year during this unprecedented (very precedented?) bull run after yields inverted.
Just going by the usual patterns and the technicals I would guess that the real pain wont start until April or May, that is based on how bonds uninverted in both 2000 and 2008.
I think it makes sense, there is a lot of excitement around Trump and what he will do, all this make America Great and panama and tax cuts and IRS. The first 100 days of the Trump Presidency could have some hope which keeps the market afloat, and as a twist of fate the end of the 100 days lines up with the typical crash timing after an uninversion, that being around May of this year.
If we do crash and go to recession I expect some big action from the Fed, after all we have Trump and he will be flaming Powel all day long, so the Fed may react quickly with a big cut that pumps the market up and then 1 more drop to gap fill us around 4300 level (SPY 430).
Overall I expect a year of pain for the SNP500, but It won't start just yet, this has been a massive run up and so a topping pattern will take time to form, wait for signs of distribution lower low followed by lower high, sell in May and Stay Away.
We will see if/how it plays out.
Good Luck, Safe Trades, God Bless.

Time to buy the dipBrutal amplification through MSTX.
We are entering a sharp growth, which means % will add up quickly, especially with a leveraged ETF.
This is a highly risky bet and when using options, you should ensure at least 3-6 months until expiration.
Also make sure that at the expiration, you have enough liquidity to get more if necessary.

SPY Consolidates Near Key Resistance! Can Bulls Break Out?Technical Analysis Overview:
1-Hour Chart:
* Trend: SPY is trading in a descending wedge pattern, with resistance at $583 and support near $579.
* Indicators:
* MACD: Neutral with minimal momentum, indicating consolidation.
* Stochastic RSI: Moderately overbought at 61, suggesting a potential pause or pullback.
30-Minute Chart:
* Price Action:
* SPY is consolidating near $582, with immediate resistance at $583.
* Key support levels at $579 and $577 are holding steady.
* Volume: Slightly declining, indicating market indecision near resistance.
Key Levels to Watch:
Support Levels:
* $579: Immediate support zone, aligning with HVL.
* $577: Secondary support, coinciding with the 2nd PUT Wall.
* $575: Strong support near the 3rd PUT Wall.
Resistance Levels:
* $582: Immediate resistance zone, aligning with the 2nd CALL Wall.
* $583: Key resistance level.
* $584-$586: Major resistance zone with GEX walls.
GEX Insights:
Key Gamma Levels:
* Positive Gamma Walls (Resistance):
* $582: Immediate resistance aligned with the highest positive NETGEX.
* $583-$584: Key resistance zone with 21.23% GEX (2nd CALL Wall).
* $586: Long-term resistance zone (18.39% GEX).
* Negative Gamma Levels (Support):
* $579: Strong support backed by HVL.
* $577: Key PUT Wall support (-43.2% GEX).
* $575: Significant PUT Wall support (-39.18% GEX).
Options Metrics:
* IVR: 29.6, indicating low implied volatility.
* IVx: 19.8, reflecting subdued market expectations.
* Call/Put Bias: PUTs dominate at 49.2%, suggesting cautious sentiment.
Trade Scenarios:
Bullish Scenario:
* Entry: Above $583 with volume confirmation.
* Target: $584-$586.
* Stop-Loss: Below $579 to limit downside risk.
Bearish Scenario:
* Entry: Rejection at $583 or a breakdown below $579.
* Target: $577-$575.
* Stop-Loss: Above $584 to manage risk.
Directional Bias:
* SPY is consolidating near a critical resistance zone at $583. A breakout could lead to bullish momentum toward $584-$586, while failure to clear resistance may result in a pullback toward $579 or lower.
Conclusion:
SPY is at a pivotal level near $583. A breakout above this resistance could signal further bullish continuation, while a rejection might trigger consolidation or a pullback. Traders should closely monitor price action and volume for confirmation.
Disclaimer:
This analysis is for educational purposes only and does not constitute financial advice. Always conduct your research and trade responsibly.

QQQ Tests Resistance! Where will it head to?Technical Analysis Overview:
4-Hour Chart:
* Trend: QQQ is in a short-term recovery, testing resistance at $506 within a broader downtrend.
* Indicators:
* MACD: Bullish momentum is building, with a positive histogram.
* Stochastic RSI: Overbought at 67, suggesting potential short-term consolidation.
30-Minute Chart:
* Price Action:
* QQQ is consolidating near $505-$506, facing resistance at $508.
* Support at $503 is holding firmly, aligning with the highest negative NETGEX.
* Volume: Slightly increasing on the recovery, signaling cautious bullish participation.
Key Levels to Watch:
Support Levels:
* $503: Immediate support, aligning with HVL and gamma support.
* $500: Strong support zone, coinciding with GEX10.
* $498: Critical support near the 3rd PUT Wall.
Resistance Levels:
* $506: Immediate resistance zone, aligning with CALL resistance.
* $508: Key resistance, aligning with the 2nd CALL Wall.
* $527: Major resistance level, coinciding with prior highs.
GEX Insights:
Key Gamma Levels:
* Positive Gamma Walls (Resistance):
* $506: Immediate resistance, aligning with CALL resistance.
* $508: 14.62% GEX (2nd CALL Wall).
* $527: Long-term resistance zone.
* Negative Gamma Levels (Support):
* $503: Strong support backed by the highest negative NETGEX.
* $500: Key PUT Wall support (-13.95% GEX).
* $498: Significant PUT Wall support (-14.92% GEX).
Options Metrics:
* IVR: 28.1, indicating low implied volatility.
* IVx: 24.6, below average, reflecting a calmer trading environment.
* Call/Put Bias: PUTs dominate at 31.2%, showing cautious sentiment.
Trade Scenarios:
Bullish Scenario:
* Entry: Above $506 with volume confirmation.
* Target: $508-$515.
* Stop-Loss: Below $503 to limit risk.
Bearish Scenario:
* Entry: Rejection at $506 or a breakdown below $503.
* Target: $500-$498.
* Stop-Loss: Above $508 to manage risk.
Directional Bias:
* QQQ's consolidation near $505-$506 signals a critical inflection point. A breakout above $506 could drive bullish momentum toward $508 and beyond, while a failure to clear resistance may lead to a retest of $503 or lower.
Conclusion:
QQQ is testing a pivotal resistance zone near $506. A breakout could signal further bullish continuation, while a rejection might trigger consolidation or a pullback. Traders should watch volume and price action closely for confirmation.
Disclaimer:
This analysis is for educational purposes only and does not constitute financial advice. Always conduct your research and trade responsibly.

IWM Eyes Resistance! Will the Bulls Break Through?Technical Analysis Overview:
4-Hour Chart:
* Trend: IWM is recovering within a rising channel, currently testing resistance near $220.
* Indicators:
* MACD: Bullish momentum continues with a positive histogram.
* Stochastic RSI: Overbought at 88, indicating potential short-term consolidation or pullback.
30-Minute Chart:
* Price Action:
* IWM is consolidating near $220, just under key resistance at $221.
* Support at $218 has held steady, showing buyer strength at lower levels.
* Volume: Moderate, consistent with the ongoing recovery.
Key Levels to Watch:
Support Levels:
* $218: Immediate support zone, aligning with GEX7.
* $216: Secondary support, coinciding with the 3rd PUT Wall.
* $215: Strong support near the HVL.
Resistance Levels:
* $220: Immediate resistance, aligning with the highest positive NETGEX.
* $221-$223: Key resistance zone, highlighted by the 3rd CALL Wall.
* $227.5: Major resistance aligning with prior highs.
GEX Insights:
Key Gamma Levels:
* Positive Gamma Walls (Resistance):
* $220: Highest positive NETGEX and immediate resistance.
* $221: 24.67% GEX (3rd CALL Wall).
* $223: 3.14% GEX (2nd PUT Wall).
* Negative Gamma Levels (Support):
* $218: Support backed by GEX7 (7.71%).
* $216: Key PUT Wall support (-0.7% GEX).
* $215: Strong support with HVL alignment.
Options Metrics:
* IVR: 34.2, indicating moderate implied volatility.
* IVx: 29.3, close to average, suggesting stable conditions.
* Call/Put Bias: PUTs dominate at 6.6%, showing caution in the market.
Trade Scenarios:
Bullish Scenario:
* Entry: Above $220 with volume confirmation.
* Target: $221-$223.
* Stop-Loss: Below $218 to limit downside risk.
Bearish Scenario:
* Entry: Rejection at $220 or a breakdown below $218.
* Target: $216-$215.
* Stop-Loss: Above $221 to control losses.
Directional Bias:
* IWM's consolidation near $220 suggests bullish momentum, but the resistance zone at $220-$221 is critical. A breakout could lead to a rally toward $223 and possibly $227, while a failure to clear resistance may result in a pullback to $218 or lower.
Conclusion:
IWM is at a pivotal resistance zone near $220. A breakout could signal further bullish continuation, while a rejection might trigger consolidation or a retracement. Traders should closely monitor volume and price action for confirmation.
Disclaimer:
This analysis is for educational purposes only and does not constitute financial advice. Always conduct your research and trade responsibly.

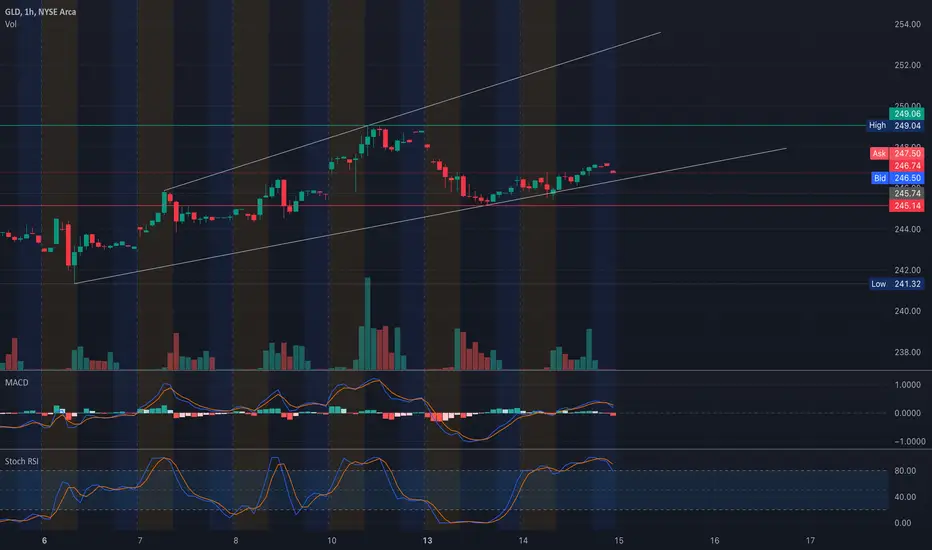
GLD Approaches Key Resistance! Will the Rally Continue?"Technical Analysis Overview:
1-Hour Chart:
* Trend: GLD is in a steady uptrend, trading within a rising channel and approaching the $248-$249 resistance zone.
* Indicators:
* MACD: Slight bullish momentum, but the histogram is flattening, indicating reduced strength.
* Stochastic RSI: Overbought at 89, suggesting a potential short-term consolidation or pullback.
30-Minute Chart:
* Price Action:
* GLD is consolidating near $247, with key resistance at $248-$249.
* Immediate support at $245 has shown strength in recent sessions.
* Volume: Moderate volume, consistent with the gradual upward movement.
Key Levels to Watch:
Support Levels:
* $245: Immediate support zone, aligning with the HVL and 2nd PUT Wall.
* $243: Secondary support, coinciding with the 2nd PUT Wall (-5.96% GEX).
* $240: Strong support near the 3rd PUT Wall.
Resistance Levels:
* $248: Immediate resistance, aligning with the 2nd CALL Wall.
* $249-$250: Key resistance zone, highlighted by the highest positive NETGEX.
* $253: Long-term resistance, supported by the 3rd CALL Wall.
GEX Insights:
Key Gamma Levels:
* Positive Gamma Walls (Resistance):
* $248: 56.42% GEX (2nd CALL Wall).
* $249-$250: Highest positive NETGEX and immediate resistance.
* $253: 39.99% GEX (3rd CALL Wall).
* Negative Gamma Levels (Support):
* $245: Immediate support backed by HVL and gamma support.
* $243: Strong support with PUT activity (-5.96% GEX).
* $240: Key PUT Wall support (-2.96% GEX).
Options Metrics:
* IVR: 57.2, indicating relatively high implied volatility.
* IVx: 15.2, below average, signaling a stable environment.
* Call/Put Bias: Calls dominate at 49%, reflecting bullish sentiment.
Trade Scenarios:
Bullish Scenario:
* Entry: Above $248 with volume confirmation.
* Target: $249-$253.
* Stop-Loss: Below $245 to limit risk.
Bearish Scenario:
* Entry: Rejection at $248 or a breakdown below $245.
* Target: $243-$240.
* Stop-Loss: Above $249 to control losses.
Directional Bias:
* GLD's continued uptrend and consolidation near $247-$248 suggest bullish momentum, but the resistance zone at $248-$249 is critical. A breakout could lead to a rally toward $250-$253, while a failure to clear resistance may result in a pullback toward $245-$243.
Conclusion:
GLD is approaching a pivotal resistance zone at $248-$249. A breakout could signal further bullish continuation, while a rejection might trigger consolidation or a retracement. Traders should monitor volume and price action closely for confirmation.
Disclaimer:
This analysis is for educational purposes only and does not constitute financial advice. Always conduct your research and trade responsibly.
NVDA Multi-Asset Income StrategyRecently, I've been looking a lot at Yield Max ETFs and other options-based yield ETFS more generally such as QDTE, XDTE, RDTE, QQQI, SPYI, YQQQ (inverse), etc.
One possible way to outperform SPY & QQQ, may be to consider investing in such ETFs, though this is purely theoretical s tradingview does not provide a quality backtesting software for a complex multi-asset, multi-directional strategy like this. Nothing in this strategy should be considered financial advice and there are various factors to consider, such as beta decay, mismanagement of the ETFs, tax advantages/disadvantages, reinvestment risk, risks associated with options in income-based derivatives, risks with leveraged assets, and the obviously risks with inverse assets.
In this chart, we are looking at the leveraged ETF NVDL, which tracks NVDA. It's important to note that this asset will decay whenever NVDA trades sideways or goes down over substantial periods of time, and when NVDA goes down the negative % returns are multiplied. Therefore a trader or "sophisticated investor" (FINRA term) needs to not only optimize their position size for a trading period, but also optimize the timing of entry's and exits on multiple position. They will also want to model, volatility, decay, and reinvestment risk (arguably the hardest in this case. This post will not discuss the specifics of those and instead, these topics should be considered as a form of "homework" for you, the reader to think about and discuss in the comments as food for thought.
In this theoretical multi-asset income strategy, risk is managed through the use of income based ETFs that are either bullish or bearish, I think of this as " directional income ". In this case, NVDY is the bullish income asset and DIPS is the bearish income asset, both of which pay dividend monthly and their price performance behaves very similar to a leveraged ETF, in the sense that they only really increase when the underlying the underlying asset moves in the direction of the income derivative. Theoretically, by managing position size with the use of a modified Kelly Criterion which accounts for fed rates, the decay of the asset, and timing (through technical analysis, seasonality and quantitative analysis), I wonder if a trader could swing-trade between various income-based derivatives and leveraged assets, in order to optimize both income and grow irrespective of market conditions.
In truth, I'm still not sure if this is a completely degenerate idea no different to the way banks stacked bad loans together in 2008 and slapped a Grade A rating, and in the process over valued quantitative methods (see the book "Quants") as a sort of grad delusion to completely avoid risks, like a doctor wishing to delete pain from the world with an addictive pill, shilled by Big Pharma... Only in this case, instead of CMBS, it's ETF, leveraged ETFs, options on both, creating a derivative, then stacking more derivative on top of that...
Who knows, though... Maybe this could be a way to profit from this madness?
I honestly don't know.
What I do know is, I find the idea of " directional income " as a hedge more appealing than an inverse leveraged ETF and I'm curious how to apply this to either a single asset or multi-asset portfolio. It's a very interesting idea and I plan to spend the year exploring this idea at the cost of my own capital, rather than someone else's capital.

SPY Mid week analysis 1/14/25SPY - Monthly reversal is now being negated as we moved back above the monthly 2-2d trigger at Prev Month Low. We are also now failed 2D coming back through previous week range. The daily went 2-2 rev, but closed failed 2u as we made higher highs, but closed red near mid range of the day. The question for tomorrow is do we continue pushing back through last weeks range to expand the BF created by the 3 from last week, or do we take the failed 2u - 2D reversal, reconfirm the Monthly reversal down as well as the weekly 3-2D. We have a 3-1 setup on the 4HR as well as an inside bar 60 which is what I will be watching going into open tomorrow assuming no gap up or down. Should be an exciting rest of the week as we look to see if bears can reclaim control on the W and M, or if Bulls are setting up for a recovery back to ATH.
Levels to watch: Current 60 inside bar High and Low, Current 4HR bar high and low, Prev month low, 585.96 for upside which is the 2-2U rev target we did not get to today, but may compound 2Us tomorrow to get to if the bull scenario is playing out.

Earning pump Gotta nice inverse that can play out here. Targets would be 590 break that and 596 can happen🫡

SMH @ 200 Day SMAAs we have always said Semis are the new transports. SMH hit the 200 Day SMA on the daily chart. It has been forming a symmetrical wedge pattern. It has an equal opportunity to break out towards upside or downside. The RSI has been oscillating between 60 and 40 since Nov 2024. Watchout the SMH chart to confirm if stock market bull market is intact.

Opening (IRA): EWZ January 17th 23 Short Put... for a .71 credit.
Comments: Here, I'm just trying to reduce my cost basis in my shares of stock (which is kind of an "ugh" at 31.65), so looking to take assignment at $23/share. Because of this, I will look to run this all the way to expiry, at which point I either get assigned or it expires worthless.
Metrics:
Break Even/Buying Power Effect: 22.29
Max Profit: .71
ROC at Max: 3.19%

SPY 24hr potterboxesSPY 24hr potterboxes. Well, the spy is trying to claw its way back to the top. Right now, it's a key level. If you look to the left, there is some noise around the 583.12 Ish spot and that is where it's trading now. well, we will just keep an eye on it. Happy Trading

XOP To The Moon?As we have seen, XOP has struggled to maintain itself even with all of the middle east tensions going on. I still believe we will see a higher high soon enough. Patience is key. I am going to let the chart do its thing.

Notice Anything In Correlation Of Elections And Oil?If a Democrat takes office, we are going to see oil continue on its way up. Elliott Wave is guiding the way. I called this out a while ago, and if you have bought since then, you have a better average cost than me.
I am sure everyone will be tuning in to the election. No one knows who will win.
Red Vertical Lines: Republican Wins
Blue Vertical Lines: Democrat Wins

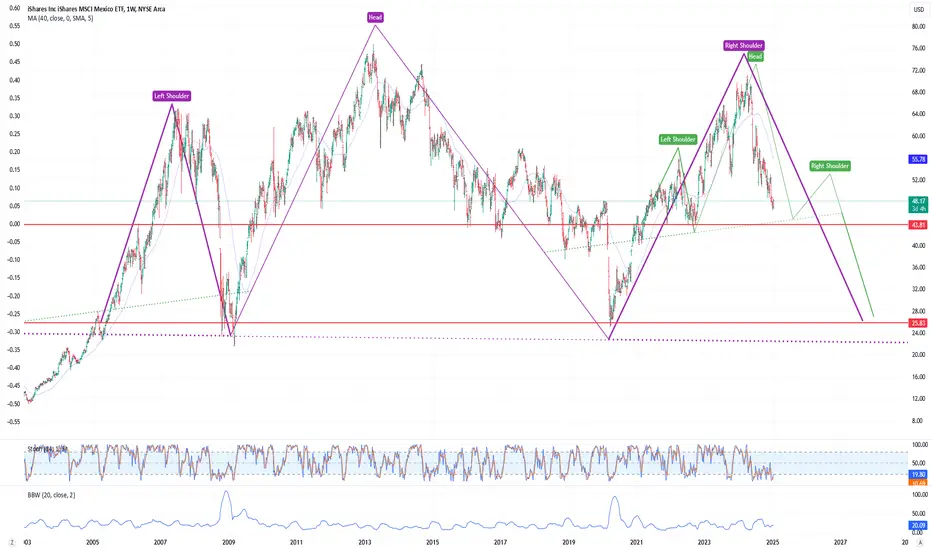
EWW - Another Long-Term ViewThe new president tauted her first 100 days in office mexiconewsdaily.com yet the stock remains in a downtrend. On a chart pattern look, it appears that we are in the midst of a larger-term Right shoulder of a massive head and shoulders formation.
The shorter-term formation also appears to be a head and shoulders formation with the neckline coming in just below 44. From there, it could pattern out the right shoulder before dropping again below 30.
Trump hasn't even taken office yet and Mexico is feeling the pain. While things might turn around, it's hard to feel positive in a socialist political environment. Should interest rates in the US continue to rise, negatively affecting US stocks, EWW tumbling down to the $30 level wouldn't be too much of a surprise.
Who is interested in Selling Puts under $20 ?Inauguration is coming.
Do we know if Trump will give Elon what he is expecting?
Place your bets.
I will be buying below $ 20.
Selling Puts to get paid just in case.

Opening (IRA): IBIT February 21st 47 Covered Call... for a 44.52 debit.
Comments: Adding to my position at strikes/break evens better than what I currently have on, selling the -75 delta strike against shares to emulate the delta metrics of a 25 delta short put, but with the built-in defense of the short call.
Metrics:
Break Even/Buying Power Effect: 44.52/share
Max Profit: 2.48
ROC at Max: 5.57%
50% Max: 1.24
ROC at 50% Max: 2.79%
Will generally look to take profit at 50% max, roll out short call on take profit point test.

$SPY 4hr 200MA breaking downAMEX:SPY 4hr 200MA breaking down
Testing that 4hr 200MA here…. Look to the 35EMA on the weekly timeframe for support if it does break under

MSTZ....well positioned for a quick profitIf BTC drops a bit more (low 90k), MSTZ should have at least 5-10% upside. All the TAs nicely align to an upside, but we'll have to see what big papa bear goes....
stay tuned, but this looks real sweet!
All the best and safe trading!
