Stock Market | TSLA NVDA AAPL AMZN META GOOGL MSFTStock Market | TSLA NVDA AAPL AMZN META GOOGL MSFT
ETF market

SPY: 597, then 585 or lowerSPY appears to be in a descending wedge (bullish) or a descending triangle (bearish). I'm expecting a rally to 597 on Monday, but we will likely see a rejection at the resistance line. I'm leaning towards the descending triangle and we see a fall through support to 567, but either of these patterns supports a drop to at least 577.

LAST HURRAH $SPY MONTHLY DIVERGENCE WHICH CAN LAST FOR MONTHs BUT THIS IS THE FINAL WAVE 5 THEN EXPECT PULLBACK ..i am 50% cash i have a feeling meltdown begins once trump takes over .FEB march may be meltdown .i m getting cash heavy

GSG - bullish returnThe AMEX:GSG chart isn't as clear to me as the S&P-GSCI Commodity Index SP:SPGSCI , but it tells the same story: a bull market, followed by a shallow correction to 38.2%, and now a MACD buy signal.

SPY Chart: Buy the DipsSummary
The S&P 500 (SPY) is still in a bullish trend.
This chart focuses on buying dips instead of selling.
Key buy zone is marked in the green box.
Key Points
Buy in the Green Box:
This area is where SPY is expected to bounce back.
Targets are $602.30 and $624.29.
Support and Stop-Loss:
Stop-Loss: $560.66 – If SPY falls below this, the bullish trend may be invalid.
Support Zone: Between $563 and $573, as highlighted by Fibonacci levels.
Invalidation Level:
If SPY breaks below the red line at $510.50, we’re no longer in a bullish cycle.
Upside Potential:
As long as SPY stays above the green zone, it can move toward higher targets.
Simple Plan
1. Wait for SPY to drop into the green box before buying.
2. Avoid selling SPY; it’s better to focus on buying dips in this setup.
3. If SPY goes above the (X) wave, the bearish scenario is invalid.
Key Message
This chart is about staying patient and waiting for the right time to buy. The green box is your chance to get in before the next rally.
Let me know your thoughts in the comments below! 🚀

EPV ... The hidden Gem for a soon to be Smoldering EuropeEPV could be a nice hideaway for those looking to see to Europe's demise seeing that they are already falling apart and the US will throw each one into the UKRuss grinder to pick up assets at dirt cheap...
Just a playful thought...that's all. Cut their gas...raise their prices...flood with more non-welcomers...make oil increase and on top of that- throw in a nice polar shot that persists until about mid April for chilly weather...Gotcha-self a trade

MSTUNow that we've retraced the election pump entirely, MMs that got blown out on the 2 week 356% increase have recuperated.
What if, similar to the election pump, we now price in the reduction of uncertainty surrounding Trump presidency to 0, with an inauguration pump that is even more extreme than the election pump?
Gaps in immediate vicinity as incentive for sharp move higher to $10+ locally. Wouldn't be surprised to see new highs later in January.

ON THE ROAD AGAIN?Have we recently seen a double bottom in CARS, and will it now be on the road again?

SPY reaching liquidity zone, hedge your longsSPY reaching liquidity zone, hedge your longs. This analysis is for informational purposes only and not a financial advise.

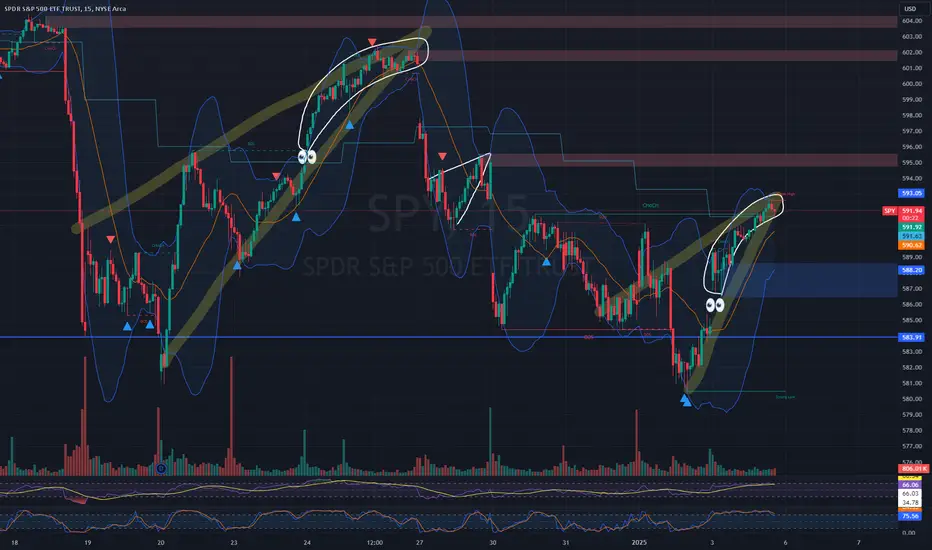
$SPY Land of #RisingWedge's (Was this the bottom?! Orrrr...)Was yesterday the bottom? Is today continuation? Seem's like people thought this just a few days ago after 3 big days only to lead to another leg down... hmmm
Wedges are my favorite setup. Ofc @TradingView software probably spotted 0 of these because...? lol
Notice; Gap (Eyes) up both days than slight lean (circles) of towards close... #FEW
#Warning for #BottomCallers , I see more downside. Also for anyone RED out there. I'm RED today despite that NASDAQ:TSLA chart and NASDAQ:NVDA chart LOL. We're all human and make mistakes, we don't all learn from them.
-Prophecies
Opening (IRA): EWZ Oct 17th 26/45 Short Call Vertical... for a 1.13 credit.
Comments: I'm fairly certain that I'm going to be assigned on my January 17th 26 short put, so am going out to October to sell a spread with the short leg at the 26 strike that pays at least 1.00. The reason I do this (sell a call for at least 1.00), is that this enables me to roll the short call down a strike by 1.00 without giving up profit potential if I need to. The 26 short call aspect of this spread will become the short call aspect of an October 17th 26 covered call, with the covered call setup having a break even of the strike at which I was assigned (26) minus the 1.13 in credit I got paid for this spread or 24.87.
Because I haven't been assigned shares yet and short calls are generally verboten in a cash secured account like an IRA, I've had to pay a few bones (.05 to be exact), to define the risk of the short call. I also had to pay a debit that is equal to the width of the spread (19.00) minus the credit received of 1.13 or 17.87 for the spread. I'm fine with this, since this buying power will eventually free up when I get assigned.
Naturally, the October expiry is extremely long-dated. I'm fine with this here, since EWZ pays a fairly decent dividend, albeit only in June and December.

Restest Rejects 591 592 play again.Down she goes in my opininionDown she goes in my opinion. but still be careful here bulls wanna see 600 gap fill, bears want 576 .Have a great weekend and hope everyone making some money

Beyond bond marketBuying the BND ETF (Vanguard Total Bond Market ETF) can be a smart move for several reasons, especially for those looking to diversify their portfolio, generate income, or manage risk. Here are some compelling reasons why you might consider buying BND:
1. Diversification
Broad Exposure to the Bond Market: BND gives you access to a wide variety of U.S. investment-grade bonds, including government, corporate, and mortgage-backed securities. This diversification reduces the risk compared to holding individual bonds or concentrating on a single sector of the bond market.
2. Income Generation
Regular Interest Payments: BND invests in bonds that pay interest, providing a consistent stream of income. If you're a retiree or someone looking for reliable income without the volatility of stocks, BND can be a good choice.
3. Lower Risk
Less Volatile Than Stocks: Bonds are generally less volatile than stocks, which makes BND a safer option for risk-averse investors. It tends to fluctuate less and is less affected by market swings.
Stability: Since BND tracks a broad basket of U.S. bonds, it provides stability during times of stock market turbulence. It can serve as a defensive asset in your portfolio, offering protection during market downturns.
4. Cost-Effective
Low Expense Ratio: With an expense ratio of just 0.035%, BND is extremely affordable. Compared to actively managed funds or other bond ETFs, it offers exposure to the bond market at a fraction of the cost.
5. Liquidity
Easily Tradable: As an ETF, BND can be bought and sold like a stock, meaning you have liquidity and can enter or exit the investment at any time during market hours. This makes it more flexible than holding individual bonds, which may be harder to sell quickly.
6. Accessibility for Small Investors
Low Minimum Investment: Unlike individual bonds, which may require large sums to purchase, you can buy BND in increments of a single share, making it accessible for investors with smaller portfolios.
7. Hedge Against Stock Market Volatility
Diversification in Times of Market Stress: When the stock market experiences significant volatility or downturns, bond prices often move in the opposite direction, helping balance out the performance of your overall portfolio. BND is a good way to hedge against market volatility.
8. Intermediate Duration for Balanced Risk
Moderate Duration Exposure: BND focuses on bonds with intermediate durations, balancing the risk between short-term and long-term bonds. This makes it less sensitive to interest rate changes compared to long-duration bonds, while still providing the benefits of bond exposure.
9. Performance During Economic Uncertainty
Defensive Nature: Bonds are generally seen as safer during economic uncertainty. While the stock market can be volatile during recessions or periods of high inflation, bonds tend to provide more stability and reliable returns.
10. Tax Efficiency
More Tax-Efficient Than Actively Managed Funds: Since BND is passively managed, it tends to have fewer capital gains distributions, which can be more tax-efficient than actively managed bond funds.

Spy Road To $615I Still am long With Spy, There is no Doubt, will we see a big correction possibly in the coming months , Yes I believe But in the Meantime Money Will Be Transferred To Different Stocks & Sectors Forsure Even if we do go in a bear Market!!! So I Will Be allocating Into The Stock Sector Which I had no exposure to, that can set me up for huge generational wealth and Gains Content Out Now,, As Always Good Luck Traders And Be Safe

Opening (IRA): XBI January 17th 89 Covered Call... for an 87.50 debit.
Comments: Adding at strikes/break evens better than what I currently have on ... . The ROC metrics aren't what I generally like to see out of these (2.0% or greater), but it's shorter duration than my usual wheelhouse (45 DTE) ... .
Metrics:
Buying Power Effect/Break Even: 87.50
Max Profit: 1.50
ROC at Max: 1.71%
50% Max: .75
ROC at 50% Max: .86%
Will generally look to take profit at 50% max.

Opening (IRA): TAN January 17th 33 Covered Call... for a 32.29 debit.
Comments: ETF IV > 35% with 30-day currently at 39.7%. Adding to my position at strikes better than what I currently have on, selling the -75 delta call against stock to emulate the delta metrics of a 25 delta short put, but with the built-in defense of the short call. Dinking and doinking on "little stuff" running into year's end ... .
Metrics:
Buying Power Effect/Break Even: 32.29/share
Max Profit: .71
ROC at Max: 2.20%
50% Max: .36
ROC at 50% Max: 1.10%
Will generally look to take profit at 50% max.

SPY/QQQ Plan Your Trade: Learning A or B Trading StylesYesterday, after the GDP Now data hit, I received a number of messages related to my SPY Cycle Patterns and how they work in comparison to big news data (like GDP, JOBS, PMI, & Others).
Let me try to explain one simple thing to all of you.
The SPY Cycle Patterns are based on GANN/Fibonacci Time/Price cycles. They DO NOT correlate or predict price movement based on NEWS EVENTS or other extraneous data.
The SPY Cycle Patterns are, in essence, the core price expectations related to time/price cycles WITHOUT EXTERNAL NEWS EVENTS.
They represent what price is likely to do without any big news, economic data, or critical major event taking place to disrupt the Cycle Pattern.
So, it is important for traders to understand what I call the "A or B" type of trade setup.
Price is always attempting to reach new highs or new lows - ALWAYS.
Failure to reach new highs means price must roll downward and attempt to reach new lows. Failure to reach new lows means price must roll upward and attempt to reach new highs.
It is that simple.
Price is always attempting to break above previous critical highs or lows - ALWAYS.
Thus, once you understand this as a basis of price structure/movement, then you can begin to apply more advanced patterns (Fibonacci Price Theory, Excess Phase Peak Pattern, Others) as an additional layer to price structure in an attempt to understand how price dictates all trending/movement.
Now, one must also understand when price attempts to break levels (high or low), it can REJECT at those level (after breaking to new highs or lows). This is what I call a "Washout" pattern.
Rejection happens when a new low or high is reached, but the price FAILS to continue to trend in that direction. For example, if price were to reach a new higher high, then reject, this would be an example that strong resistance exists at/near the previous high level - causing price to FAIL to maintain that new high price level. Thus, I would expect price to move downward after REJECTING at the new high levels (see above).
The reason I'm trying to teach you these price concepts is because I want you to learn to make better decisions - not learn to just "follow along". You have to learn to understand price and understand how price moves related to opportunities.
That is what trading is all about - anticipating price moves because of what you are able to discover on a price chart.
Get some. Happy Friday.
#trading #research #investing #tradingalgos #tradingsignals #cycles #fibonacci #elliotwave #modelingsystems #stocks #bitcoin #btcusd #cryptos #spy #es #nq #gold

SPY 1-Hour Technical Analysis and GEX Insights-Jan. 3Technical Analysis (1-Hour Chart)
* Trend and Price Action:
* SPY is trading in a clear downtrend, respecting a descending trendline, with lower highs and lower lows observed.
* Current price action shows a slight bounce off the $577.74 support level, but the structure remains bearish.
* Volume: Selling pressure has been dominant, with moderate volume on the bounce, indicating cautious buying.
* Indicators:
* MACD: Showing early signs of a potential bullish crossover, signaling a short-term recovery attempt.
* Stochastic RSI: Oscillating from oversold levels, hinting at a possible relief rally or consolidation.
* Key Levels:
* Support Levels:
* $577.74: Immediate support; a breakdown could lead to further declines toward $572.00.
* $572.00: A significant support zone aligned with historical price action.
* Resistance Levels:
* $585.87: Immediate resistance near the descending trendline.
* $588.00: Strong resistance level with GEX-related CALL activity.
* $592.30: Additional resistance if the price breaks out above $588.
GEX Insights for SPY
* Gamma Exposure (GEX):
* Positive GEX Zones:
* $588.00: Key CALL wall and a significant resistance zone, indicating strong seller interest.
* $590.00: Secondary resistance with additional CALL interest and moderate gamma exposure.
* Negative GEX Zones:
* $577.00-$572.00: Heavy PUT concentration and highest negative gamma levels, providing strong support but signaling potential volatility below these levels.
* Options Metrics:
* IVR (Implied Volatility Rank): 21.9%, suggesting relatively low volatility compared to historical levels.
* Options Flow:
* CALLs: Modest activity concentrated near $588-$590.
* PUTs: Dominant below $580, reflecting heightened downside hedging by market participants.
Trade Scenarios:
Bullish Scenario:
* Entry: Above $586.00 with confirmation of bullish momentum.
* Target: $588.00 (initial), $590.00 (extended).
* Stop-Loss: Below $584.00 to limit downside risk.
Bearish Scenario:
* Entry: Below $577.00 with strong selling volume.
* Target: $572.00 (initial), $570.00 (extended).
* Stop-Loss: Above $580.00 to cap losses.
Conclusion
SPY is at a critical juncture, with $577 acting as key support. A break above $586 could trigger a short-term rally, while a breakdown below $577 might lead to increased selling pressure. GEX data aligns well with these levels, providing clear zones for traders to watch.
Disclaimer: This analysis is for educational purposes only and does not constitute financial advice. Always conduct your own research and manage risk responsibly.

QQQ 1-Hour Technical Analysis and GEX Insights-Jan. 3Technical Analysis (1-Hour Chart)
* Trend and Price Action:
* QQQ is trending downward on the 1-hour chart, respecting a descending trendline.
* The price has tested the $505.34 support level and is attempting a minor recovery. However, the overall structure remains bearish.
* Volume: Moderate volume during recent declines suggests continued selling pressure.
* Indicators:
* MACD: Signs of a potential bullish crossover, which could indicate a short-term recovery if confirmed.
* Stochastic RSI: Rising from oversold levels, signaling a possible bounce or consolidation.
* Key Levels:
* Support Levels:
* $505.34: Critical support level; breaking below this could lead to further declines.
* $500.00: Psychological support and significant GEX activity zone.
* Resistance Levels:
* $511.87: Immediate resistance aligning with the descending trendline.
* $515.00: Secondary resistance with CALL wall activity, marking a critical breakout level.
GEX Insights for QQQ
* Gamma Exposure (GEX):
* Positive GEX Zones:
* $515.00: Key CALL wall, acting as a significant resistance zone for upside movement.
* Above $520.00: Positive gamma increases, signaling a strong resistance cluster.
* Negative GEX Zones:
* $505.00: Highest negative gamma exposure and a critical support zone.
* Below $500.00: Gamma exposure becomes more negative, increasing downside volatility.
* Options Metrics:
* IVR (Implied Volatility Rank): 20.1%, indicating relatively low volatility pricing.
* Options Flow:
* Calls: Modest activity near resistance levels at $515-$520.
* Puts: Concentrated near $505 and $500, reflecting strong protective positioning by investors.
Trade Scenarios:
Bullish Scenario:
* Entry: Above $512.00 with confirmation of momentum.
* Target: $515.00 (initial), $520.00 (extended).
* Stop-Loss: Below $510.00 to limit downside risk.
Bearish Scenario:
* Entry: Below $505.00 with strong volume.
* Target: $500.00 (initial), $495.00 (extended).
* Stop-Loss: Above $510.00 to cap losses.
Conclusion
QQQ is at a pivotal level, with $505 acting as a critical support zone. A breakout above $515 could trigger bullish momentum, while a breakdown below $505 could lead to further downside pressure. GEX levels provide clear zones to monitor for potential trading opportunities.
Disclaimer: This analysis is for educational purposes only and does not constitute financial advice. Always conduct your own research and manage risk responsibly.

SPXL - SPX - Were not done yetOn the SPXL I can see using TA plus fibs that it looks like another leg up is coming. Usually things don't top at the 1.4 fib but continue to the 1.618 fib. Doomers are out in full force which happens at every local bottom. Yes we are getting up here but doesn't mean we can't go higher yet and looking at my TA in addition to other stocks they all look bottomed out and ready for a move higher to keep the bull trend in tack. Yes yields are moving higher but stocks have moved higher with yields before... I don't see a top till end of January at earliest but learning more towards March/April. If BTC can continue up from here that would cement that timeframe for me. Lets see what happens.

LONG XBII am long AMEX:XBI via $AMEX:LABU. Seasonality is usually good for XBI this time of year and looking at 4h chart its ready to move up.

SPY JAN 24 callspicked up SPY $600 Jan24 calls buying the dip and looking at trump taking office to rocket us to new ATH. 2 FVGs along the way planning to be pretty much out going into the 24 accept for free runners.

UVIX had a nice run, but it's over nowUVIX had a nice spike and hope that everyone took advantage of my earlier call on this baby! Now the party is over and we're off to the next party with SVIX (inverse)! Nice set-up and primed for a nice jump since we reached the tip of UVIX. Best of luck and always do your own DD!
