SPY - Head and Shoulders AlertAnother tip off that the market is headed for a big drop. Market top signals showing up at every level. Looking for a one to two month drop followed by one more rally up. Whether we take out the highs, unknown this early. But good opportunities for trading profits.
ETF market

Will QQQ hold support?QQQ testing the long term channel for support after breakout. Holiday are low volume and a usually a time for the market to climb some without any selling pressure. If I had to guess, then I would say we generally move sideway and up through the end of December. When the traders are back in full for in January will tell us if this rally continues or it has been a big pump and dump for the incoming Trump administration and its new policies.

Pullback will be spectacular UVIX...enjoy!History can indeed repeat itself. Hopefully folks enjoyed their 20%+ profit I called out earlier. If you didn't sell, no worries, the upcoming spike will more than make up for the weak hands that profited off small gains versus seeing the bigger opportunity could be over 100% easily.
Best of luck and always do your own due diligence!

$TLT - It is getting crazy!NASDAQ:TLT The bond market seems out of its mind. We are basically less than 5% from the peak of the Fed's rate hiking cycle. Pretty sure funds are shorting it.
Currently, it is sitting on critical support. It's possible that this may be the bottom. 👀
As always, I share my opinions and trades. I'm not suggesting that anyone follow my trades. You do you.

We already bottomed, you just don't know it yet! NASDAQ:QQQ
We already bottomed, you just don't know it yet!
Daily Chart analysis:
A look back at 2024 shows us that every time we have come down to the Green support line on the Wr% we've bounced hard all the way back up to the red barrier.
It coincides with every time we've went below the 9ema that this occurs then we rocket back up. This time could be different but what I'm seeing on the weekly chart as well it doesn't look like it to me as we've already rebound back above the 9ema to this point.
I'm just a nerd who loves all things stock market, I'm no oracle but from my TA and my GUT we should bounce hard heading into the new year and back up to ATH's in January friends!
Not financial advice.

SPY Get ready for a bounce of this Fib LevelLooks good for a bounce on AMEX:SPY once it comes into this GZ area.

SPY - A GAPTacular 2024And leaves a tiny one on today's open up top...Oops.
Couple of those lower ones were on a different time, but lots of these on the daily chart forgotten behind.
Someday...my SPY crash will come...


$SPY $EUCRT setup, we're primed to see a bullish reversal to fill the CRT High through the afternoon
Wait for your setup
Find your entry
Pay yourself

VEGI - Stop Losses Hit at Support in UptrendThe stop losses were triggered at the support level. In the broader context,VEGI is in an uptrend. This could be a good buying opportunity.

Update: EWZ December 2026 32 Covered CallHere, starting to break my EWZ position (See Post Below) into its constituent pieces.
The first piece involves shares I acquired way back at 31.65/share. (Ugh). Rather than go back and calculate trade to date break even, I'm going out far in duration to sell the short call at or above my break even. Sometimes, you have to go way longer dated than you'd like, but I'm fine with devoting some buying power to this, particularly since EWZ pays a fairly decently dividend, albeit only twice a year.
The remaining legs are the January 17th 26 short put -- on which I'm pretty sure I'll be assigned shares, and the January 17th 23 short put, which is in-the-money by .50 or so. On assignment, I'll look to sell the call at the strike at which I was assigned and go from there ... .

VIX swing nicely set-up with UVIXSuper pumped by this upside of this set-up with VIX. Note that VIX is for sport vs. UVIX futures, but they typically align on the spikes. Do your own due diligence, but note the nice curve showing a bounce from the bottom / support level. RSI and key TAs validate bottom although there could be some volatility, but seeing where the market is and selling pressures across the board this seems like it's nicely set-up for a nice spike. Belated Xmas present!
Best of luck!

Spy down in my eyes if opening don’t push up.Spy back down to 590. Downtrend may continue if break 590 back to 582 possible 572 gap . Be careful trades as to being in top of 5th wave.🌊 lets gets some more gains 602 outs are printing. Premarket status

SPY/QQQ Plan Your Trade For 12-27-24: Momentum Rally PatternThe last Friday of the year (2024) should show up as a moderate Momentum Rally in the SPY/QQQ - possibly seeing the SPY target 603 or higher by the end of the day.
Gold and Silver are consolidating into a FLAGGING formation.
Bitcoin is trapped in a consolidation range (right shoulder) pattern that should break downward over the next 5+ days.
This is the time to position your trades for the beginning of 2025 and prepare for moderate volatility as the markets struggle for direction.
The Momentum Rally pattern, today, should present a very clean opportunity for skilled day traders.
I believe a deeper low is likely to setup between January 15 and January 25, 2025. So, be prepared for another roll to the downside after we get past the New Year.
Get some.
#trading #research #investing #tradingalgos #tradingsignals #cycles #fibonacci #elliotwave #modelingsystems #stocks #bitcoin #btcusd #cryptos #spy #es #nq #gold

SPY Resistance TestSPY came all the way back up to 602.50 and rejected, but not by much yet. Seems bullish if it reclaims soon, bearish below. Downside targets are the recent bottom around 585 followed by the election gap fill below and then a previous ATH around 565. Upside targets are ATH and beyond.

Quantum Computing vs. TechIntroduction:
Technological advancements continue to reshape markets, with artificial intelligence (AI) dominating headlines in recent years. However, the next major frontier appears to be quantum computing. The ratio between the quantum computing sector NASDAQ:QTUM and technology AMEX:XLK provides a unique perspective on this emerging trend.
Analysis:
Key Breakout: The QTUM-to-XLK ratio has recently broken out of a rounding bottom formation, a classic bullish reversal pattern. This breakout signals growing investor enthusiasm and capital flow into quantum computing, suggesting it may be the next major growth story in tech.
Higher Highs and Higher Lows: The ratio is printing a series of higher-highs and higher-lows, confirming a bullish trend. As long as this structure remains intact, quantum computing warrants serious attention.
Healthy Consolidation: After the recent surge, a pause or slight pullback would be a healthy consolidation within the broader uptrend. Such moves often precede the next leg higher.
Implications for Investors:
The breakout highlights quantum computing's increasing importance and potential. This sector could mirror the early stages of AI adoption, suggesting substantial long-term growth opportunities for QTUM-related investments.
Trade Setup:
Bullish Scenario:
Entry: Look for pullbacks to support levels or a continuation of higher-highs for confirmation of trend strength.
Target: Watch for the ratio to continue trending upward, signaling outperformance of QTUM over XLK.
Stop Loss: Place stops below recent lows to manage risk in case of a deeper correction.
Bearish Scenario:
A breakdown below the trendline or failure to print higher-highs would signal potential weakness, warranting caution.
Conclusion:
Quantum computing is emerging as the market’s next big focus, with the QTUM-to-XLK ratio breakout suggesting robust momentum in the sector. While a pullback could offer better entry opportunities, the long-term growth story for quantum computing remains compelling. Are you ready for the quantum revolution? Let’s discuss in the comments below!
Charts:
(Include charts showing the QTUM-to-XLK ratio breakout, the rounding bottom formation, and key levels of support and resistance. Highlight the trendline and any recent consolidation zones.)
Tags: #QuantumComputing #Technology #QTUM #XLK #EmergingTrends #TechnicalAnalysis #GrowthInvesting

LABD: Breakout Setup Above $6.68!LABD is forming a bullish breakout setup with an entry point at $6.68. Here are the trade parameters:
Entry: $6.68 (yellow line, breakout level).
Stop Loss (SL): $6.47 (below support zone).
Take Profit Targets:
Target 1 (T1): $7.11 (first resistance level).
Target 2 (T2): $7.56 (next resistance level).
Monitor for volume confirmation to validate the breakout and capitalize on upward momentum!

GLD UpdateStill waiting for price to continue lower towards the target box. As I have said many times before, C waves can either be 3 or 5-wave moves. This appears as if it will be a 3-wave move based on the structure it has carved out thus far. I am of a mindset that we should move into the box within the next month or two. Gold in general just moves very slow the majority of the time. Every once in a while, it sees some volatility but that is very rare.
Should it make a new ATH before entering the box, then wave 4 is likely already over and was very short. This is not my primary thought process but nonetheless it is very possible.

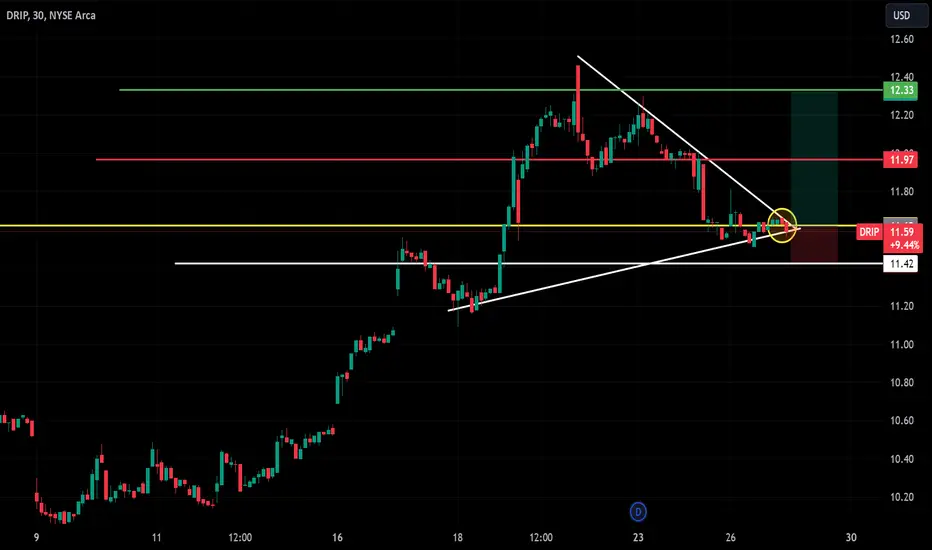
DRIP: Breakout Potential from Symmetrical Triange!DRIP is showing signs of a breakout from a symmetrical triangle pattern on the 30-minute chart.
Entry is set at the yellow line ($11.62) with the following trade parameters:
Stop Loss (SL): $11.42 (below lower trendline support).
Target 1 (T1): $11.97 (red resistance line).
Target 2 (T2): $12.33 (green resistance level).
Monitor volume for confirmation of breakout momentum.
$SPY December 27, 2024AMEX:SPY December 27, 2024
15 Minutes.
As expected, 602 gave resistance and AMEX:SPY managed to hold 597-598 yesterday.
I expect a move today after 2 days consolidation.
I will go long above 603 for a 3 to 4 $ move towatds 608-609 levels.
Provided 597 is held today. A close below 597 will result i a 2$ trade. Possible.
I prefer to go long above 602.6 - 603 for the day.

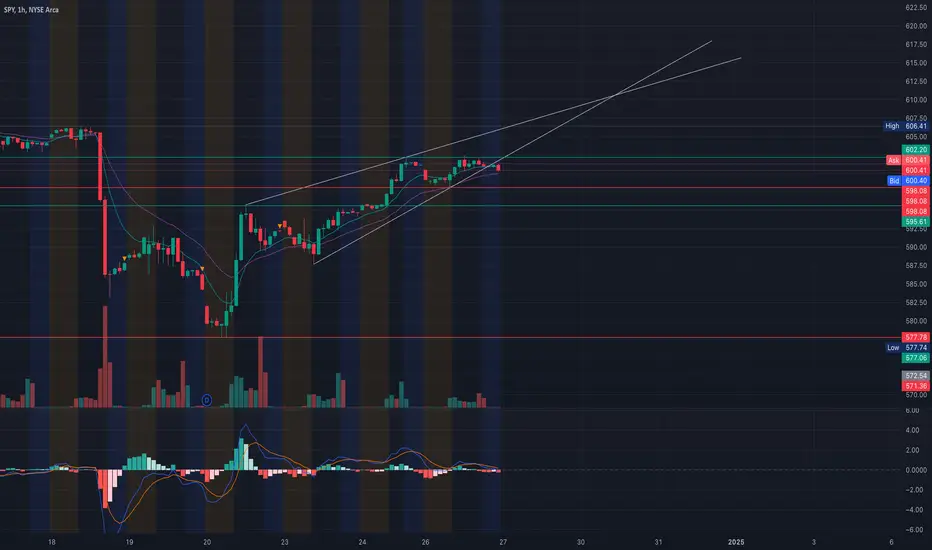
SPY Eyeing a Breakout! Scalping, Swing & Options StrategiesMarket Structure:
* SPY is trending within an ascending wedge pattern, holding above key EMAs (9 and 21), suggesting bullish momentum with caution near resistance levels.
* Current price at $600 indicates a consolidation phase near critical Gamma resistance levels, with the potential for a breakout or pullback.
Key Levels to Watch:
* Support Zones:
* $598: Immediate support, aligned with the Gamma 2nd PUT wall.
* $597: Strong support from the Gamma 3rd PUT wall and wedge base.
* Resistance Zones:
* $602: Critical resistance; breaking above signals bullish continuation.
* $604: Next resistance target near Gamma levels and technical confluence.
Indicator Insights:
* MACD: Flat but in bullish territory; watch for crossover to confirm momentum.
* Volume: Declining during consolidation; expect a spike for a breakout or breakdown.
* Options Oscillator: IVR (2.6) indicates low implied volatility, favoring directional plays near GEX levels.
Scalping Strategy:
1. Bullish Setup:
* Enter on a break above $602 with high volume.
* Targets: $604 and $606.
* Stop Loss: Below $601.
2. Bearish Setup:
* Enter on a breakdown below $598 with bearish momentum.
* Targets: $597 and $595.
* Stop Loss: Above $599.
3. Tools to Use:
* Use RSI and VWAP for intraday momentum confirmation.
* React quickly to price action at Gamma-determined levels ($598, $602).
Swing Trading Strategy:
1. Bullish Scenario:
* Enter on a daily close above $602 with volume confirmation.
* Targets: $604 and $606 for a short-term swing.
* Stop Loss: Below $600.
2. Bearish Scenario:
* Enter if SPY closes below $598 and sustains bearish momentum.
* Targets: $595 and $590.
* Stop Loss: Above $599.
3. Indicators to Monitor:
* EMA (9/21) for momentum confirmation.
* Volume spikes to confirm direction near key levels.
Options Strategy Based on GEX:
1. Bullish Options Play:
* Buy a Call Option with a $600 strike expiring in 1-2 weeks.
* Target: Exit near $604 or $606.
* Stop Loss: Close the trade if SPY falls below $598.
2. Bearish Options Play:
* Buy a Put Option with a $598 strike expiring in 1-2 weeks.
* Target: Exit near $597 or $595.
* Stop Loss: Close the trade if SPY rises above $599.
3. Neutral Strategy:
* Sell a Put Credit Spread at $598/$596, profiting from SPY staying above $598.
* Maximum profit achieved if SPY remains above $598 by expiration.
4. Advanced Gamma Strategy:
* If SPY holds above $602, consider selling a Call Spread at $604/$606 to collect premium while capping risk.
Actionable Plan for SPY:
* Scalpers should focus on intraday moves between $598 and $602, with quick reactions to price action.
* Swing traders can capitalize on breakouts above $602 or breakdowns below $598 with clear targets and stops.
* Options traders should leverage low IV and GEX levels for directional or neutral premium-selling strategies.
Disclaimer:
This analysis is for educational purposes only and does not constitute financial advice. Always conduct your own research and trade responsibly.
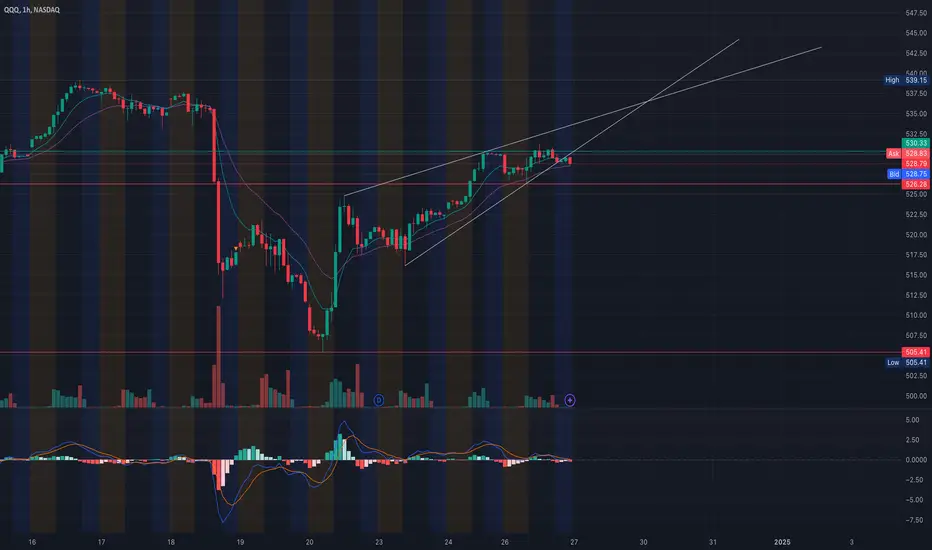
QQQ Poised for a Breakout! Scalping, Swing & Options Strategies Market Structure:
* QQQ has formed an ascending wedge pattern, suggesting potential breakout or breakdown scenarios.
* Price is consolidating around $529 after recovering from $505 lows, with the 9 EMA and 21 EMA trending upwards, signaling bullish momentum.
* A key resistance zone is evident at $531–$533, with strong support at $527.
Key Levels to Watch:
* Support Zones:
* $527: Immediate support aligned with the 2nd PUT wall from GEX and prior price pivot.
* $526: Major support near the 3rd PUT wall and ascending wedge base.
* Resistance Zones:
* $531: Immediate resistance; breaking above opens the door to $533 and $535.
* $535: Strong resistance and potential breakout target.
Indicator Insights:
* MACD: Flat but holding bullish territory; watch for crossover to confirm momentum.
* Volume: Lower during consolidation; expect volume spikes near key levels for directional confirmation.
* Options Oscillator: IVR (4.9) and net GEX suggest relatively low volatility but key resistance lies at $531 and $533.
Scalping Strategy:
1. Bullish Setup:
* Enter on a break above $531 with volume confirmation.
* Targets: $533 and $535.
* Stop Loss: Below $530 to limit risk.
2. Bearish Setup:
* Enter on a breakdown below $527 with bearish momentum.
* Targets: $526 and $524.
* Stop Loss: Above $528 for risk control.
3. Tools to Use:
* VWAP for intraday levels and RSI for momentum confirmation.
* React quickly to price movements at GEX-determined levels ($527, $531).
Swing Trading Strategy:
1. Bullish Scenario:
* Enter on a daily close above $531 with high volume.
* Targets: $533 and $535 for a short-term swing.
* Stop Loss: Below $529 to minimize downside risk.
2. Bearish Scenario:
* Enter if QQQ closes below $526 with bearish continuation.
* Targets: $524 and $520.
* Stop Loss: Above $528.
3. Indicators to Monitor:
* EMA (9/21) crossover and RSI levels for trend confirmation.
* Volume spikes at support or resistance levels.
Options Strategy Based on GEX:
1. Bullish Options Play:
* Buy a Call Option with a $530 strike expiring in 1-2 weeks.
* Target: Exit at $533 or $535 based on price action.
* Stop Loss: Close the trade if QQQ falls below $528.
2. Bearish Options Play:
* Buy a Put Option with a $527 strike expiring in 1-2 weeks.
* Target: Exit at $526 or $524.
* Stop Loss: Close the trade if QQQ rises above $529.
3. Neutral Strategy:
* Sell a Put Credit Spread at $527/$525, profiting from QQQ holding above $527.
* Maximum profit if QQQ remains above $527 by expiration.
4. Advanced Gamma Strategy:
* If QQQ holds above $531, consider selling a Call Spread at $533/$535 to collect premium while capping risk.
Actionable Plan for QQQ:
* Scalpers should focus on intraday moves between $527 and $531 with quick reactions to price action.
* Swing traders can capitalize on breakouts or breakdowns from $531 and $527, respectively.
* Options traders should leverage low IV and key GEX levels for directional plays or premium collection strategies.
Disclaimer:
This analysis is for educational purposes only and does not constitute financial advice. Always conduct your own research and trade responsibly.
IWM Breaking Out! Scalping, Swing & Options Strategies to WatchMarket Structure:
* IWM has broken its recent downtrend and is consolidating near the $225 level, supported by the 9 EMA and 21 EMA showing bullish momentum.
* A strong recovery from the $216 lows positions IWM for potential upside if resistance levels are cleared.
Key Levels to Watch:
* Support Zones:
* $224: Immediate support aligned with previous breakout levels and the Gamma support wall.
* $221: Strong support from the recent higher low.
* Resistance Zones:
* $229: Key resistance from GEX and technical confluence.
* $235: Recent highs; a breakout above could trigger further bullish momentum.
Indicator Insights:
* MACD: Bullish, but histogram indicates fading momentum; watch for potential crossover.
* Volume: Consistent buying interest; any surge in volume could signal a breakout or breakdown.
* Options Oscillator: Implied volatility is stable (IVR: 8.8), favoring controlled directional moves.
Scalping Strategy:
1. Bullish Setup:
* Enter on a pullback to $224 with confirmation of a bounce.
* Targets: $226 and $229.
* Stop Loss: Below $223 to minimize risk.
2. Bearish Setup:
* Enter on a breakdown below $224 with increased selling volume.
* Targets: $222 and $221.
* Stop Loss: Above $225 to manage losses.
3. Indicators to Use:
* Use RSI and VWAP for momentum confirmation.
* Quick trades aligned with market sentiment around GEX levels.
Swing Trading Strategy:
1. Bullish Scenario:
* Enter on a daily close above $226 with volume confirmation.
* Targets: $229 and $235.
* Stop Loss: Below $224.
2. Bearish Scenario:
* Enter if IWM closes below $224 and sustains a bearish trend.
* Targets: $221 and $216.
* Stop Loss: Above $225.
3. Indicators to Monitor:
* EMA (9/21) for momentum direction.
* MACD and RSI for trend and overbought/oversold levels.
Options Strategy Based on GEX:
1. Bullish Options Play:
* Buy a Call Option at a $225 strike expiring in 1-2 weeks.
* Target: Exit around $229 or $235 based on price movement.
* Stop Loss: Close the position if IWM drops below $223.
2. Bearish Options Play:
* Buy a Put Option at a $224 strike expiring in 1-2 weeks.
* Target: Exit near $222 or $221 for profits.
* Stop Loss: Close the position if IWM recovers above $225.
3. Neutral-to-Bullish Strategy:
* Sell a Put Credit Spread at $223/$220, taking advantage of strong GEX support at $224.
* Profit if IWM stays above $224 by expiration.
4. Advanced Gamma-Based Strategy:
* If IWM holds above $224 and approaches $229, consider selling a Call Spread at $230/$235 to capture premium while limiting risk.
Actionable Plan for IWM:
* Scalpers should focus on intraday moves around $224 and $229, watching volume spikes and RSI for momentum.
* Swing traders should look for breakouts or breakdowns with confirmation from daily candles.
* Options traders can leverage GEX insights and implied volatility for directional or premium-selling strategies.
Disclaimer:
This analysis is for educational purposes only and does not constitute financial advice. Always conduct your own research and trade responsibly.
